. 2024 Dec 30;14(1):31883.
doi: 10.1038/s41598-024-83010-5.

Impact of Acacia-derived biochar to mitigate salinity stress in Zea mays L. by morpho-physiological and biochemical indices

Affiliations

Impact of Acacia-derived biochar to mitigate salinity stress in Zea mays L. by morpho-physiological and biochemical indices

Ghulam Murtaza et al. Sci Rep. .

Abstract

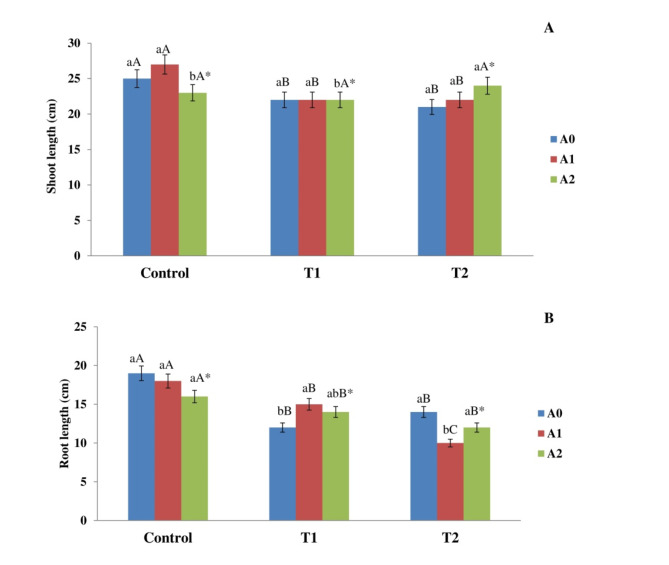
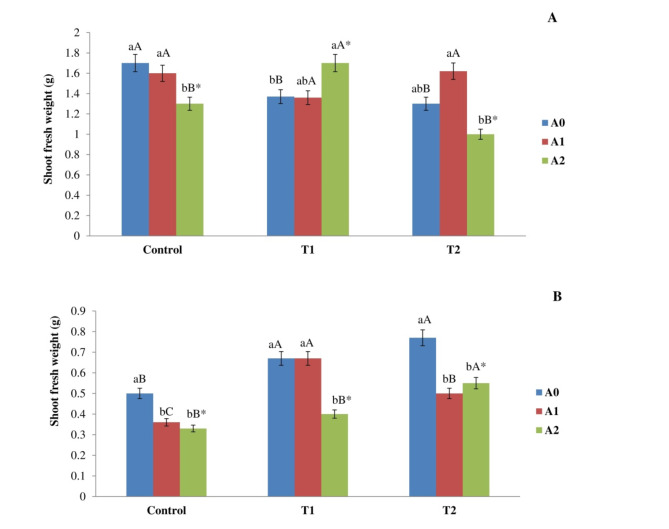
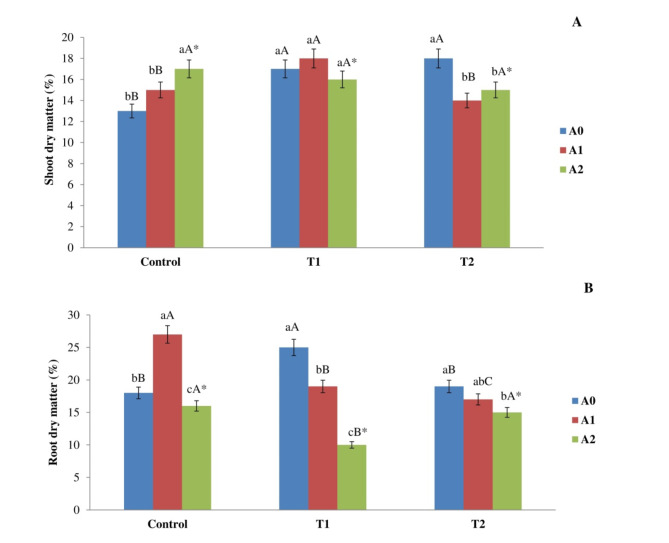
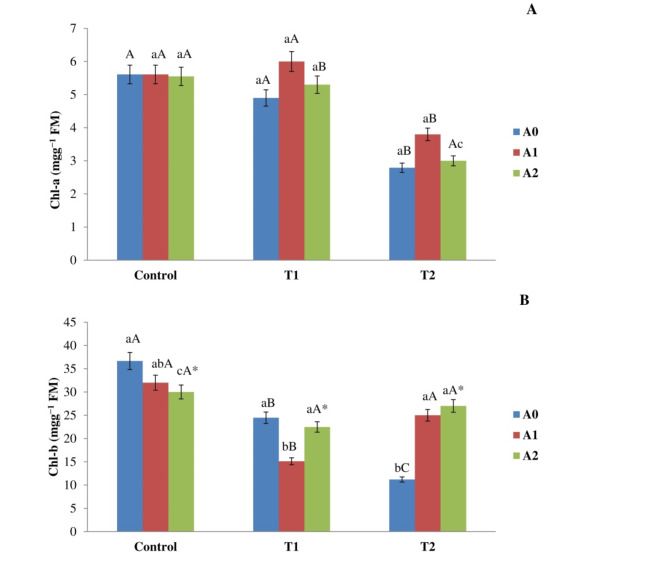
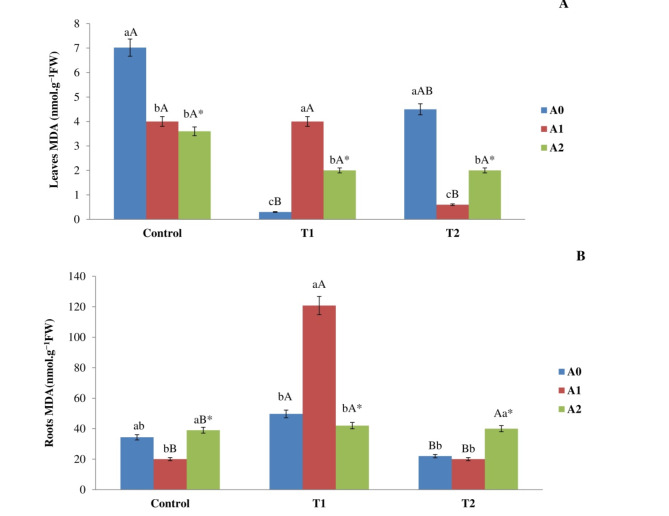
Climate change has caused many challenges to soil ecosystems, including soil salinity. Consequently, many strategies are advised to mitigate this issue. In this context, biochar is acknowledged as a useful addition that can alleviate the detrimental impacts of salt stress on plants. The objective of this study is to evaluate the effects of different levels of salt (Control; T0 0 gl-1, T1; 1.50, and T2; 3 gl-1) and biochar addition rates (A0; 0 g kg-1, A1; 40 g kg-1, and A2; 80 g kg-1) on the agronomic, physiological, and biochemical responses of corn plants. The results of our study showed a significant increase in the biomass of corn plants when exposed to salt stress and treated with 40 g kg-1 of biochar. The result underscores the significant function of Acacia-biochar in mitigating salt toxicity. The application of A1 biochar at a specified rate mitigated the adverse effects of salt-induced oxidative stress by augmenting the activities of catalase (CAT) and glutathione-S-transferase (GST). Furthermore, the utilization of biochar led to an increase in chlorophyll b concentrations in maize plants subjected to saline water treatment. Biochar is generally considered an efficient method for alleviating the adverse effects of salinity. To enhance plant growth and development while mitigating salinity-induced toxicity, the application of biochar in saline soils must be implemented appropriately.

Keywords: Acacia; Antioxidant activities; Biochar; Corn; Growth; Physiology; Salinity; Soil.


Conflict of interest statement

Declarations. Competing interests: The authors declare no competing interests. Ethics approval and consent to participate: This study does not include human or animal subjects. Permission: Permissions or licenses were obtained to collect maize variety (SILVER-2019) and Acacia bark taken from (Regional Agricultural Research Institute Bahawalpur) before starting the research. Statement on guidelines: All experimental studies and experimental materials involved in this research are in full compliance with relevant institutional, national and international guidelines and legislation.

Figures

Fig. 1
Fig. 1
Impact of salt levels (Control, T1, and T2) and biochar dose (A0, A1, and A2) on the length of maize plant shoots (A) and roots (B) following a 90-day exposure period. The means, denoted by various capital letters, exhibited a significant disparity for the same biochar level across the various treatments. The means, shown by various lowercase letters, exhibited a notable disparity in biochar addition rates within the same application. *The interaction between salt level and biochar application rate has a significant impact.
Fig. 2
Fig. 2
Impact of salt levels (Control, T1, and T2) and rate of biochar (A0, A1, and A2) on the weight (g) of (A) shoots and (B) roots of corn plants after a 90-day exposure period. The means, denoted by various capital letters, exhibited a significant disparity for the same rate of biochar across the diverse treatments. The means, shown by various lowercase letters, exhibited a significant disparity in biochar application rates within the same treatment. The interaction between biochar rate and salinity has a *significant impact.
Fig. 3
Fig. 3
Impact of salt level (Control, T1, and T2) and biochar rate (A0, A1, and A2) on the percentage of dry matter in corn plant (A) shoots (B) roots was assessed following exposure of 90 days. The methods employed by various capital letters shown a significant disparity in the same rate of biochar addition across various treatments. The methodologies employed by various lowercase letters showed a significant disparity in biochar rates within the identical treatment. *: The interaction between biochar rate and salinity has a significant impact.
Fig. 4
Fig. 4
Impact of salt level (Control, T1, and T2) and biochar rate (A0, A1, and A2) on (A) Chlorophyll a and (B) Chlorophyll b levels in maize leaves following a 90-day exposure period. The means employed by various capital letters show a significant disparity in the same biochar addition rate across various treatments. The means employed by various lowercase letters revealed a significant disparity in biochar addition rates within the same treatment. *The interactions between biochar rate and salinity level had a significant impact.
Fig. 5
Fig. 5
Impact of different levels of salinity (Control, T1, and T2) and rate of biochar (A0, A1, and A2) on the activity of the enzyme catalase in the (A) leaves and (B) roots of corn plants following 90 days of incubation. The means employed by various capital letters demonstrated a significant disparity in the same biochar addition rate across various treatments. The means employed by various lowercase letters showed a significant disparity in biochar rates within the similar treatment. *: The interactions between biochar rate and salinity have a significant impact.
Fig. 6
Fig. 6
Impact of different levels of salt (Control, T1, and T2) and rate of biochar (A0, A1, and A2) on the activity of GST in the (A) leaves and (B) roots of corn plants following a 90-day exposure period. The means employed by various capital letters show a significant disparity in the same biochar rate across different treatments. The means employed by various lowercase letters revealed a significant disparity in biochar rates within the similar treatment. *The interactions between biochar rate and salinity have a significant impact.
Fig. 7
Fig. 7
Impact of different levels of salt (Control, T1, and T2) and rate of biochar addition (A0, A1, and A2) on the concentration of MDA in the (A) leaves and (B) roots of corn plants following a 90-day exposure period. The means employed by various capital letters show a significant disparity for similar biochar addition rates across the various treatments. The means employed by various lowercase letters exhibited a notable disparity in biochar rates within the identical treatment. *: The interactions between biochar rate and salinity have a significant impact.

Similar articles

Cited by

References

    1. Nehela, Y. et al. The integrated amendment of sodic-saline soils using biochar and plant growth-promoting rhizobacteria enhances maize (Zea mays L.) resilience to water salinity. Plants10(9), 1960 (2021). - PMC - PubMed
    1. Murtaza, G. et al. Biochar enhances the growth and physiological characteristics of Medicago sativa, Amaranthus caudatus and Zea mays in saline soils. BMC Plant Biol.24(1), 304 (2024). - PMC - PubMed
    1. Anwar, T., Qureshi, H., Jabeen, M., Zaman, W. & Ali, H. M. Mitigation of cadmium-induced stress in maize via synergistic application of biochar and gibberellic acid to enhance morpho-physiological and biochemical traits. BMC Plant Biol.24(1), 192 (2024). - PMC - PubMed
    1. Irin, I. J. & Hasanuzzaman, M. Organic amendments: Enhancing plant tolerance to salinity and metal stress for improved agricultural productivity. Stresses4(1), 185–209 (2024).
    1. Mahmood, S. et al. Silicon and biochar synergistically stimulate nutrients uptake, photosynthetic pigments, gaseous exchange and oxidative defense to improve maize growth under salinity. Water Air Soil Pollut.235(6), 413 (2024).

Publication types

LinkOut - more resources