. 2024 Dec 30;14(1):31763.
doi: 10.1038/s41598-024-82621-2.

Effects of rumen fluid and molasses on the nutrient composition, fermentation quality, and microflora of Caragana korshinskii Kom. silage

Affiliations

Effects of rumen fluid and molasses on the nutrient composition, fermentation quality, and microflora of Caragana korshinskii Kom. silage

Wen Peng et al. Sci Rep. .

Abstract

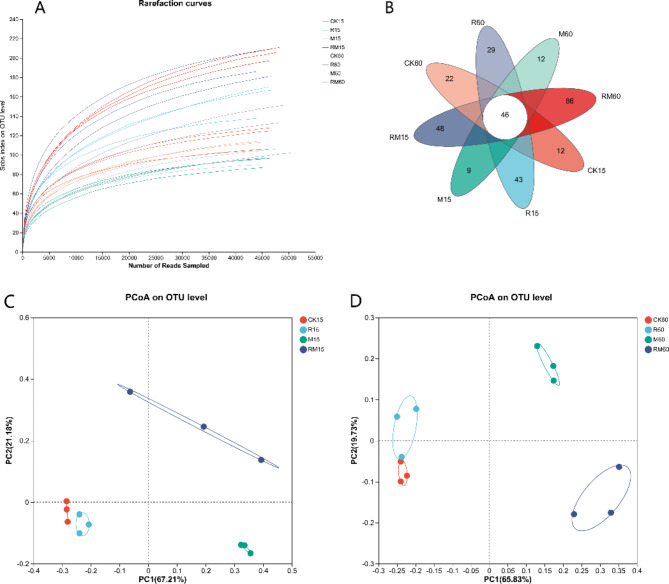
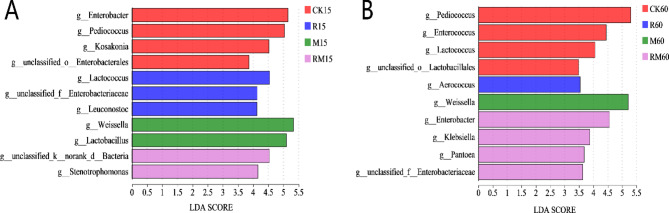
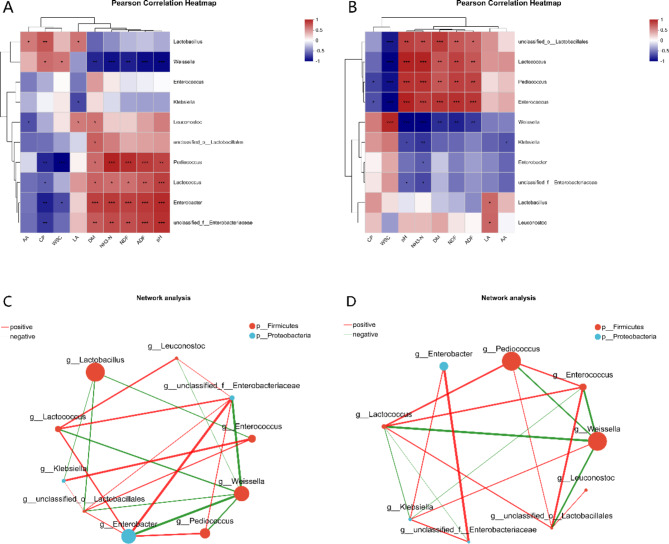
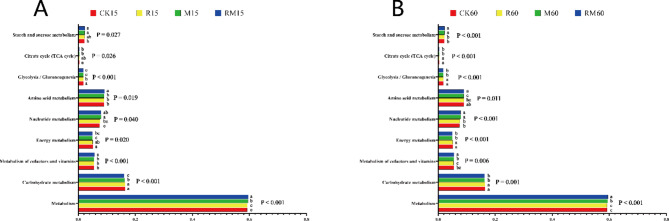
The aim of this experiment was to investigate the effects of rumen fluid and molasses on the nutrient composition, fermentation quality, and microflora of Caragana korshinskii Kom. The trial included four treatments: a control group (CK) without additives and experimental groups supplemented with 7% rumen fluid (R), 4% molasses (M), and 7% rumen fluid + 4% molasses (RM). 15 days and 60 days of ensiling. The results showed that the addition of R, M, and RM reduced the contents of neutral detergent fibre (NDF) and acid detergent fibre (ADF). The addition of M and RM increased the content of water soluble carbohydrates (WSC) but increased the loss of DM. The addition of M and RM promoted rapid pH reduction below 4.2. At 60 days of ensiling, the addition of R alone promoted the production of lactic acid (LA). The addition of R and RM increased microbial diversity. The addition of RM slowed the rate at which Lactobacillus became the dominant genus and improved the ability of Enterobacter to compete for fermentable substrates. M and RM could increase microbial activity and promote metabolism. In general, the addition of M or RM improved the fermentation quality and nutritional value of C. korshinskii silage.


Conflict of interest statement

Declarations. Competing interests: The authors declare no competing interests.

Figures

Fig. 1
Fig. 1
Rarefaction curves (A), venn diagrams of species (B) and PCoA analysis of Caragana korshinskii silage at 15 days (C) and 60 days (D) of ensiling. CK15, control for 15 days; CK60, control for 60 days; R15, rumen fluid for 15 days, R60, rumen fluid for 60 days; M15, molasses for 15 days, M60, molasses for 60 days; RM15, rumen fluid + molasses for 15 days, RM60, rumen fluid + molasses for 60 days.
Fig. 2
Fig. 2
C. korshinskii differences in genus level at 15 days (A) and 60 days (B) of ensiling. CK15, control for 15 days; CK60, control for 60 days; R15, rumen fluid for 15 days, R60, rumen fluid for 60 days; M15, molasses for 15 days, M60, molasses for 60 days; RM15, rumen fluid + molasses for 15 days, RM60, rumen fluid + molasses for 60 days.
Fig. 3
Fig. 3
Pearson correlation heatmap of nutrient composition, fermentation quality and microflora of C. korshinskii silage at 15 days (A) and 60 days (B). The color of the heatmap indicates the Spearman correlation coefficient “R” (-1 ~ 1). R > 0 indicates a positive correlation, and R < 0 indicates a negative correlation. *, **, and *** represent statistically significant differences at P < 0.05, < 0.01, and < 0.001, respectively. Pearson correlation network between microorganisms at the genus level at 15 days (C) and 60 days (D) of ensiling. The figure shows species with P < 0.05. The size of the nodes in the figure represents the abundance of the species, and different colours represent different species. The color of the line indicates positive and negative correlations, red indicates positive correlations, and green indicates negative correlations. The thickness of the line indicates the size of the correlation coefficient, and the thicker the line is, the greater the correlation between species. The more lines there are, the more closely related the species is to other species.
Fig. 4
Fig. 4
The predicted metabolic pathway changes of C. korshinskii silage at 15 days (A) and 60 days (B). CK15, control for 15 days; CK60, control for 60 days; R15, rumen fluid for 15 days, R60, rumen fluid for 60 days; M15, molasses for 15 days, M60, molasses for 60 days; RM15, rumen fluid + molasses for 15 days, RM60, rumen fluid + molasses for 60 days. Different lowercase letters indicate significant differences in different treatments at the same silage time (P < 0.05), and the same letter indicates nonsignificant differences (P > 0.05).

References

    1. Jia, B., Jia, L., Zhang, Y., Mou, X. M. & Li, X. G. Leguminous Caragana korshinskii evidently enhances microbial necromass carbon accumulation in dryland soils. CATENA215, 106342. 10.1016/j.catena.2022.106342 (2022). - DOI
    1. Zeng, Q., Lal, R., Chen, Y., An, S. & Soil Leaf and Root Ecological Stoichiometry of Caragana korshinskii on the Loess Plateau of China in Relation to Plantation Age. PLOS ONE. 12, e0168890. 10.1371/journal.pone.0168890 (2017). - DOI - PMC - PubMed
    1. Zhong, C. et al. Chemical characterization and nutritional analysis of protein isolates from Caragana korshinskii Kom. J. Agric. Food Chem.62 (14), 3217–3222. 10.1021/jf500349s (2014). - DOI - PubMed
    1. Zhong, C. et al. Functional properties of protein isolates from Caragana korshinskii Kom. Extracted by three different methods. J. Agric. Food Chem.60 (41), 10337–10342. 10.1021/jf303442u (2012). - DOI - PubMed
    1. Wang, X. et al. Effect of Caragana korshinskii Kom. As a partial substitution for sheep forage on intake, digestibility, growth, carcass features, and the rumen bacterial community. Trop. Anim. Health Prod.54, 190. 10.1007/s11250-022-03186-8 (2022). - DOI - PMC - PubMed

Publication types

LinkOut - more resources