. 2024 Dec 30;14(1):31838.
doi: 10.1038/s41598-024-82957-9.

An AMBRA1, ULK1 and PP2A regulatory network regulates cytotoxic T cell differentiation via TFEB activation

Affiliations

An AMBRA1, ULK1 and PP2A regulatory network regulates cytotoxic T cell differentiation via TFEB activation

Loredana Migliore et al. Sci Rep. .

Abstract

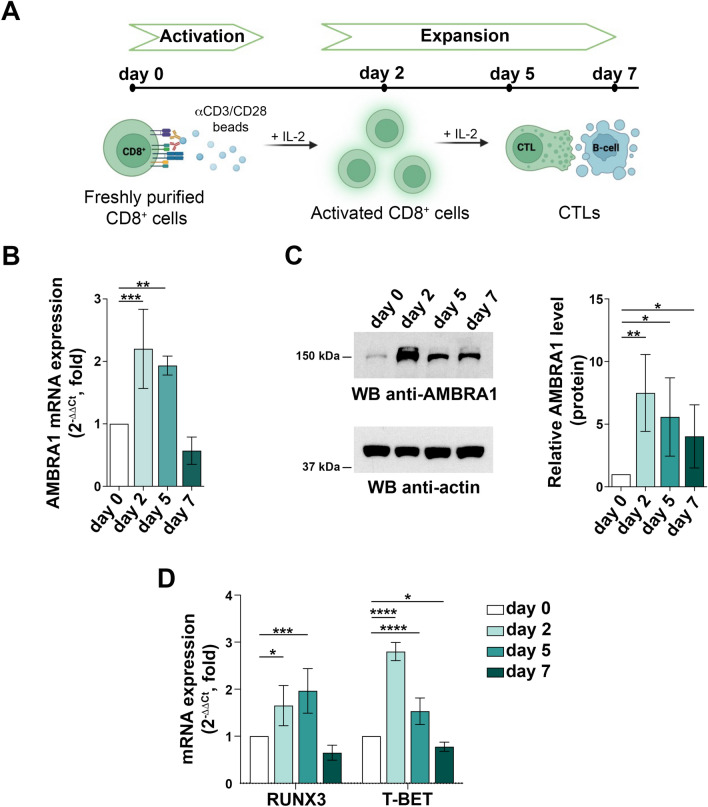
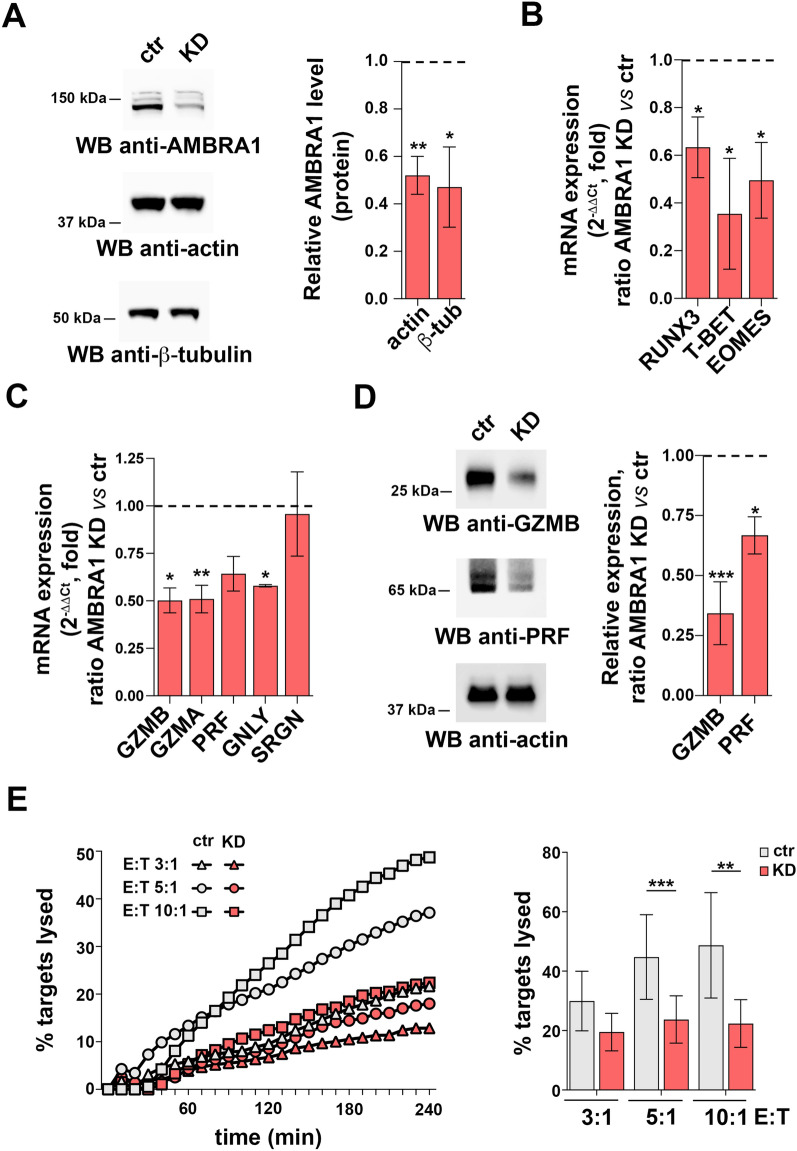
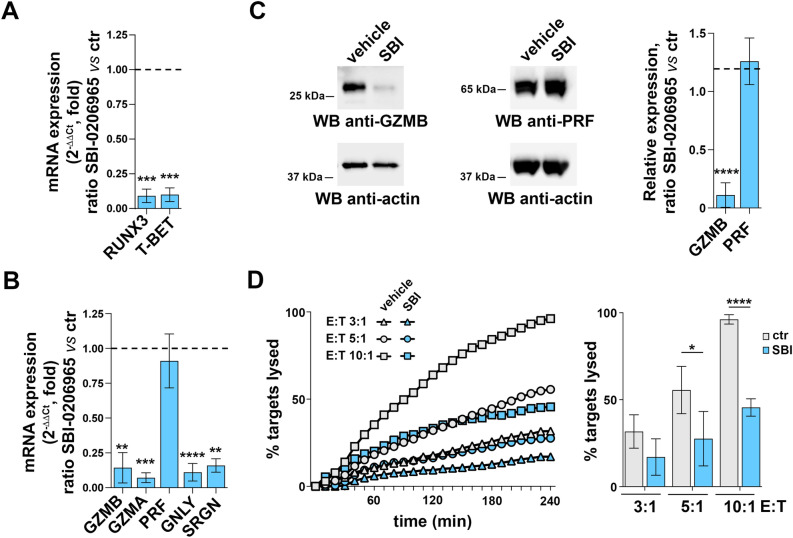
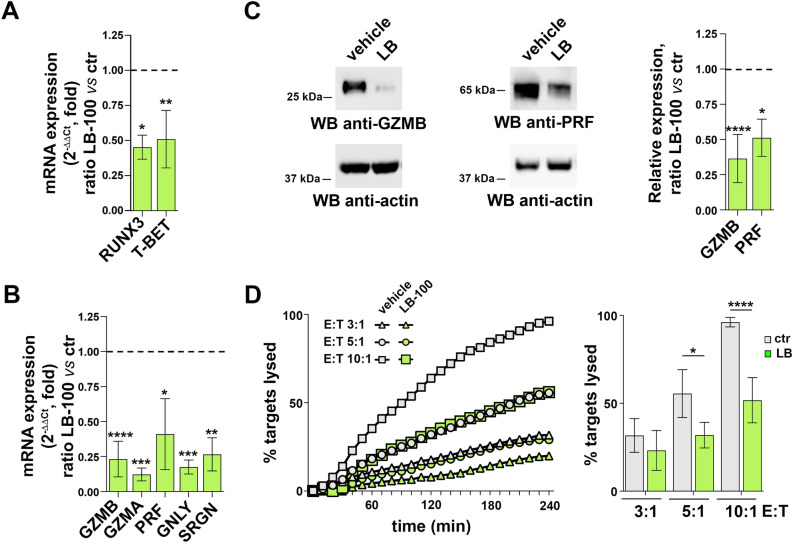
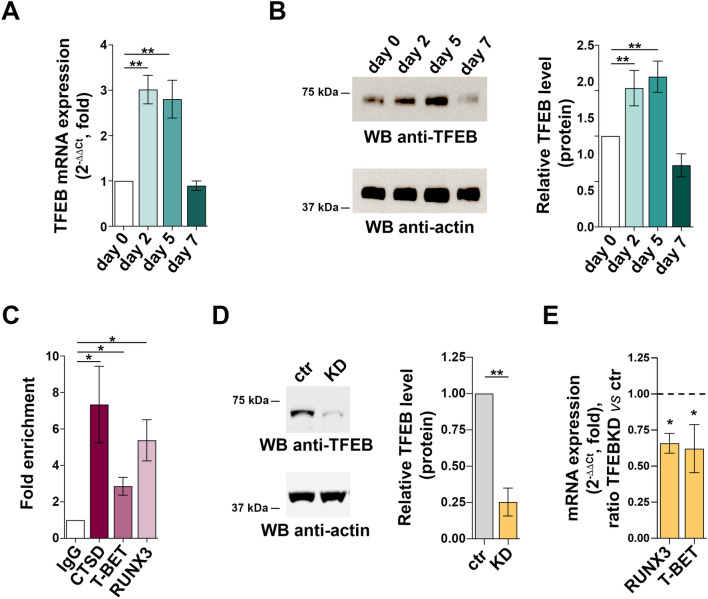
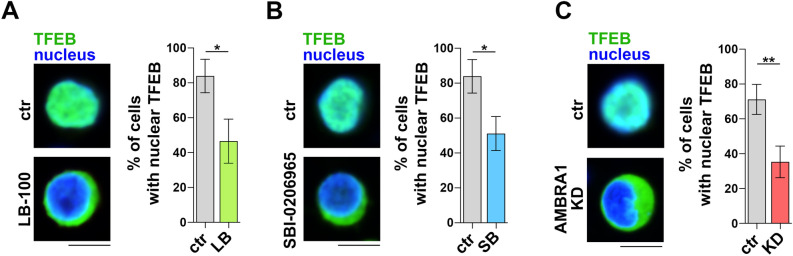
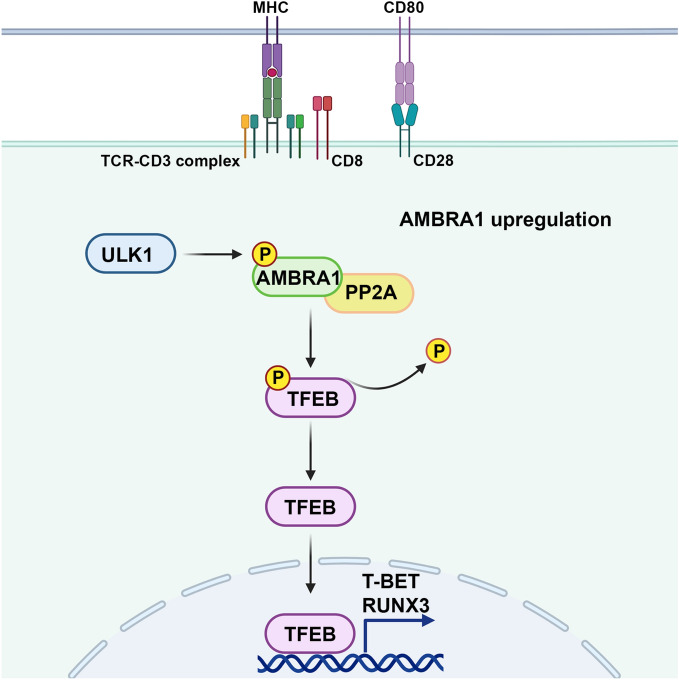
The scaffold protein AMBRA1, which participates in the autophagy pathway, also promotes CD4+ T cell differentiation to Tregs independent of autophagy through its interactor PP2A. Here we have investigated the role of AMBRA1 in CD8+ T cell differentiation to cytotoxic T cells (CTL). AMBRA1 depletion in CD8+ T cells was associated with impaired expression of the transcription factors RUNX3 and T-BET that drive CTL differentiation and resulted in impaired acquisition of cytotoxic potential. These effects were recapitulated by pharmacological inhibition of the AMBRA1 activator ULK1 or its interactor PP2A. Based on the ability of PP2A to activate TFEB, we hypothesized a role for TFEB in the CTL differentiation program regulated by AMBRA1. We show that TFEB modulates RUNX3 and T-BET expression and the generation of killing-competent CTLs, and that AMBRA1 depletion, or ULK1 or PP2A inhibition, suppresses TFEB activity. These data highlight a role for AMBRA1, ULK1 and PP2A in CTL generation, mediated by TFEB, which we identify as a new pioneering transcription factor in the CTL differentiation program.

Keywords: AMBRA1; Cytotoxic T cell; Lytic granule /; PP2A / ULK1.


Conflict of interest statement

Declarations. Competing interests: The authors declare no competing interests.

Figures

Fig. 1
Fig. 1
AMBRA1 expression is upregulated during CD8+ T cell differentiation to CTLs. (A) Workflow of in vitro CD8+ T cell differentiation starting from human CD8+ T cells purified from buffy coats of healthy donors. Freshly isolated CD8+ T cells (day 0) were activated with anti-CD3/CD28 coated beads in the presence of IL-2 and expanded for 5–7 days to generate CTLs. (B) RT-qPCR analysis of AMBRA1 mRNA and (C) immunoblot analysis of AMBRA1 protein levels in CD8+ T cells collected at days 0, 2, 5 and 7 after stimulation. 18S was used for normalization in RT-qPCR analysis. Actin was used as loading control. The migration of molecular mass markers is indicated. The histograms show the quantification of AMBRA1 expression during CTL differentiation (ndonor formula image 3, one sample t test, day 0 value = 1). (D) RT-qPCR analysis of human TBET and RUNX3 mRNA in CD8+ T cells at days 0, 2, 5 and 7 after stimulation. 18S was used for normalization (ndonor = 3, one-way ANOVA test, day 0 value = 1). Data are shown as mean fold ± SD, day 0 value = 1. * P ≤ 0.05; ** P ≤ 0.01; *** P ≤ 0.001; **** P ≤ 0.0001.
Fig. 2
Fig. 2
AMBRA1 is required for CD8+ T cell differentiation to CTLs. (A) Immunoblot analysis of human AMBRA1 levels in control (ctr, scramble RNAi) and AMBRA1 KD CTLs (KD). Actin and ß-tubulin were used as loading controls. The migration of molecular mass markers is indicated. The histogram shows the quantification of AMBRA1 expression in CTLs normalized to actin or ß-tubulin (n = 3, one sample t test, ctr value = 1). (B) RT-qPCR analysis of human RUNX3, T-BET and EOMES mRNA in control and AMBRA1 KD CTLs. 18S was used for normalization (ndonor = 3, one sample t test, ctr value = 1). (C) RT-qPCR analysis of the GZMA, GZMB, PRF, GNLY and SRGN mRNA and (D) Immunoblot analysis of the LG components GZMB and PRF in control and AMBRA1 KD CTLs. Actin was used as loading control. The migration of molecular mass markers is indicated. The histogram shows the quantification of GZMB and PRF expression in AMBRA1 KD CTLs related to control CTLs (n = 3, one sample t test, ctr value = 1). (E) Real-time calcein release-based killing assay. Control or AMBRA1 KD CTLs were co-cultured with sAg-loaded Raji B cells at the target:effector (T:E) ratios indicated. The graph shows the kinetics of target cell killing quantified by measuring calcein fluorescence every 10 min for 4 h. The histogram shows the quantification of the percentage of target cell death at the endpoint (4 h) of independent experiments carried out on CTLs from ndonor = 3, performed in duplicate (one-way ANOVA test). Data are shown as mean fold ± SD. * P ≤ 0.05; ** P ≤ 0.01; *** P ≤ 0.001; **** P ≤ 0.0001.
Fig. 3
Fig. 3
The AMBRA1 activator ULK1 is required for CTL differentiation and function. (A) RT-qPCR analysis of human RUNX3 and T-BET mRNA in CTLs treated with SBI-0206965 or vehicle (DMSO).18S was used for normalization. Data are shown as mean fold ± SD of treated vs untreated CTLs (ndonor = 3, one sample t test, vehicle value in CTLs set as 1). (B) RT-qPCR analysis of the GZMA, GZMB, PRF, GNLY and SRGN mRNA in CTLs treated with SBI-0206965 or vehicle. Data are shown as mean fold ± SD of treated vs untreated CTLs. 18S was used for normalization (ndonor = 3, one sample t test, vehicle value = 1). (C) Immunoblot analysis of the LG components GZMB and PRF in CTLs treated with SBI-0206965 or vehicle. Actin was used as loading control. The migration of molecular mass markers is indicated. The histogram shows the quantification of GZMB and PRF protein expression in SBI-0206965-treated CTLs related to untreated CTLs. Data are shown as mean fold ± SD (ndonor = 3, one sample t test, vehicle value = 1). (D) Real-time calcein release-based killing assay. CTLs either untreated or treated with SBI-0206965 were co-cultured with sAg-loaded Raji B cells at the target:effector ratios indicated. The graph shows the kinetics of target cell killing quantified by measuring calcein fluorescence every 10 min for 4 h. The histogram shows the quantification of the percentage of target cell death at the endpoint (4 h) of independent experiments carried out on CTLs from ndonor = 3, performed in duplicate. Data are shown as mean fold ± SD (n = 3, one-way ANOVA test). ** P ≤ 0.01; *** P ≤ 0.001; **** P ≤ 0.0001.
Fig. 4
Fig. 4
The AMBRA1 interactor PP2A is required for CTL differentiation and function. (A) RT-qPCR analysis of RUNX3 and T-BET mRNA in CTLs treated with LB-100 or vehicle (DMSO). 18S was used for normalization. Data are shown as mean fold ± SD (ndonor = 3, one sample t test, vehicle value in CTLs set as 1). (B) RT-qPCR analysis of GZMA, GZMB, PRF, GNLY and SRGN mRNA in CTLs treated with LB-100 inhibitor or vehicle. Data are shown as mean fold ± SD (treated vs untreated CTLs). 18S was used for normalization (n formula image 3, one sample t test, vehicle value = 1). (C) Immunoblot analysis of the LG components GZMB and PRF in CTLs treated with LB-100 inhibitor or vehicle. Actin was used as loading control. The migration of molecular mass markers is indicated. The histogram shows the quantification of GZMB and PRF protein expression in LB-100-treated CTLs related to untreated CTLs. Data are shown as mean fold ± SD (ndonor = 3, one sample t test, vehicle value = 1). (D) Real-time calcein release-based killing assay. CTLs either untreated or treated with LB-100 were co-cultured with sAg-loaded Raji B cells at the target:effector ratios indicated. The graph shows the kinetics of target cell killing quantified by measuring calcein fluorescence every 10 min for 4 h. The histogram shows the quantification of the percentage of target cell death at the endpoint (4 h) of independent experiments carried out on CTLs from ndonor = 3, performed in duplicate. Data are shown as mean fold ± SD (n = 3, one-way ANOVA test). * P ≤ 0.05; ** P ≤ 0.01; *** P ≤ 0.001; **** P ≤ 0.0001.
Fig. 5
Fig. 5
TFEB regulates expression of the CTL-specific pioneer transcription factors RUNX3 and T-BET. (A) RT-qPCR analysis of TFEB mRNA and (B) immunoblot analysis of TFEB protein in CD8+ T cells at days 0, 2, 5 and 7. 18S was used for normalization in RT-qPCR analysis. Actin was used as loading control. The migration of molecular mass markers is indicated. The histograms show the quantification of TFEB levels during CTL differentiation related to CD8+ T cells at day 0. Data are shown as mean fold ± SD (ndonor = 3, one-way ANOVA test, day 0 value = 1). (C) ChIP assays of nuclear extracts of CD8+ T cells at day 2 of differentiation using either anti-TFEB or control unspecific rabbit IgG antibodies. Selected regions of the RUNX3 and TBET promoters containing putative binding sites for TFEB were amplified by qRT-PCR. Data are show as fold enrichment (the percentage of input DNA of TFEB-Ab IP samples vs ctrl IgG-Ab samples (ndonor = 3, one sample t test). (D) Immunoblot analysis of human TFEB protein in control (scramble RNAi) and TFEB KD CTLs. Actin was used as loading control. Molecular weights are indicated at the left side of the representative immunoblot image. The histogram shows the quantification of TFEB expression in KD CTLs vs control CTLs. Data are shown as mean fold ± SD (ndonor = 3, one sample t test, ctr value = 1). (E) RT-qPCR analysis of human RUNX3 and T-BET mRNA in control and TFEB KD CTLs.18S was used for normalization. Data are shown as mean fold ± SD (ndonor = 3, one sample t test, ctr value = 1). * P ≤ 0.05; ** P ≤ 0.01; **** P ≤ 0.0001.
Fig. 6
Fig. 6
TFEB activity during CTL differentiation is regulated by ULK1, AMBRA1 and PP2A. (A-C) Quantification of nuclear GFP-tagged TFEB in untreated and LB-100- (A) or SBI-0206965-treated CTLs (B) and control and AMBRA1 KD CTLs (C). The histograms show the quantification of the percentage of cells showing nuclear TFEB localization. Representative images (medial optical sections) are shown (20 cells/sample, ndonor = 3, Student’s t test). Scale bar: 5 μm. * P ≤ 0.05.
Fig. 7
Fig. 7
Schematic representation of the function of AMBRA1 in CTL differentiation. AMBRA1 promotes the expression of the key transcription factors RUNX3 and T-BET that drive the CTL differentiation program through TFEB activation. The AMBRA1 upstream regulator ULK1 and its interactor PP2A may act in concert with AMBRA1 in this process.

References

    1. Dikic, I. & Elazar, Z. Mechanism and medical implications of mammalian autophagy. Nat. Rev. Mol. Cell Biol.19, 349–364 (2018). - PubMed
    1. Klionsky, D. J. et al. Autophagy in major human diseases. EMBO J40, 108863 (2021). - PMC - PubMed
    1. Metur, S. P. & Klionsky, D. J. Adaptive immunity at the crossroads of autophagy and metabolism. Cellular Mol. Immunol.10.1038/s41423-021-00662-3 (2021). - PMC - PubMed
    1. Macian, F. Autophagy in T cell function and aging. Front. Cell Dev. Biol.7, 213 (2019). - PMC - PubMed
    1. Nedjic, J., Aichinger, M., Emmerich, J., Mizushima, N. & Klein, L. Autophagy in thymic epithelium shapes the T-cell repertoire and is essential for tolerance. Nature455, 396–400 (2008). - PubMed

Publication types

MeSH terms

Substances

LinkOut - more resources