. 2024 Dec 30;14(1):31935.
doi: 10.1038/s41598-024-83383-7.

Arctiin alleviates knee osteoarthritis by suppressing chondrocyte oxidative stress induced by accumulated iron via AKT/NRF2/HO-1 signaling pathway

Affiliations

Arctiin alleviates knee osteoarthritis by suppressing chondrocyte oxidative stress induced by accumulated iron via AKT/NRF2/HO-1 signaling pathway

Junzheng Yang et al. Sci Rep. .

Abstract

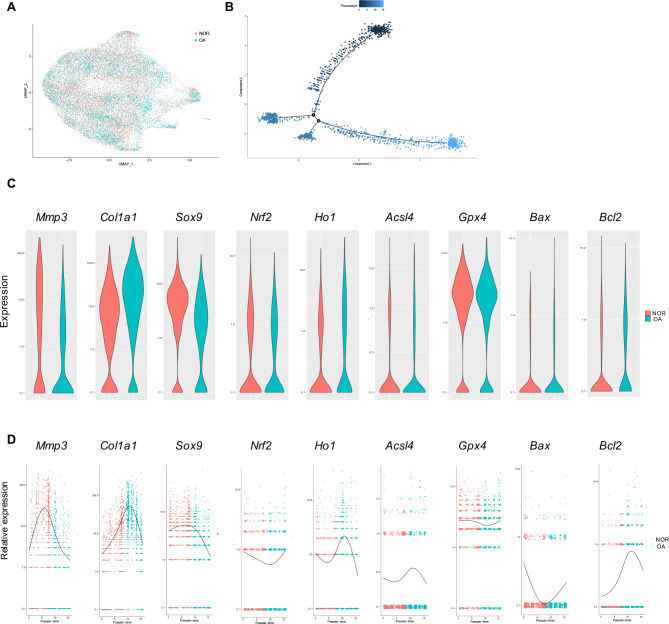
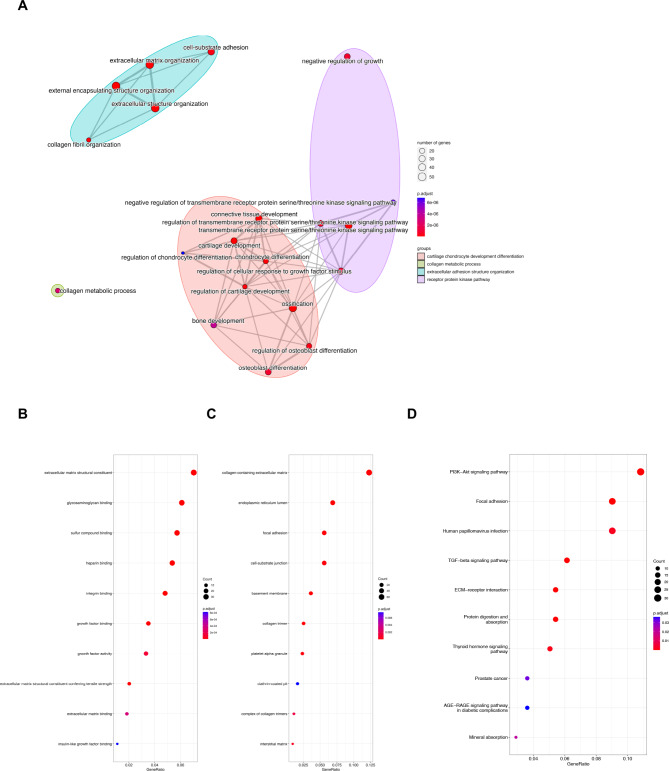
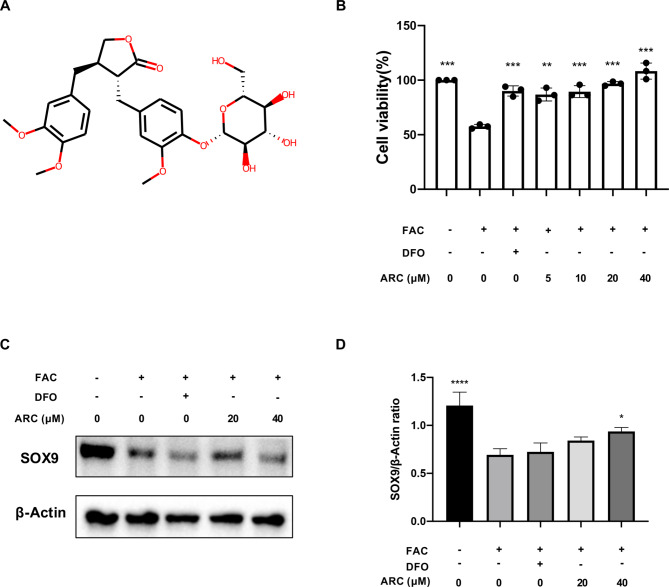
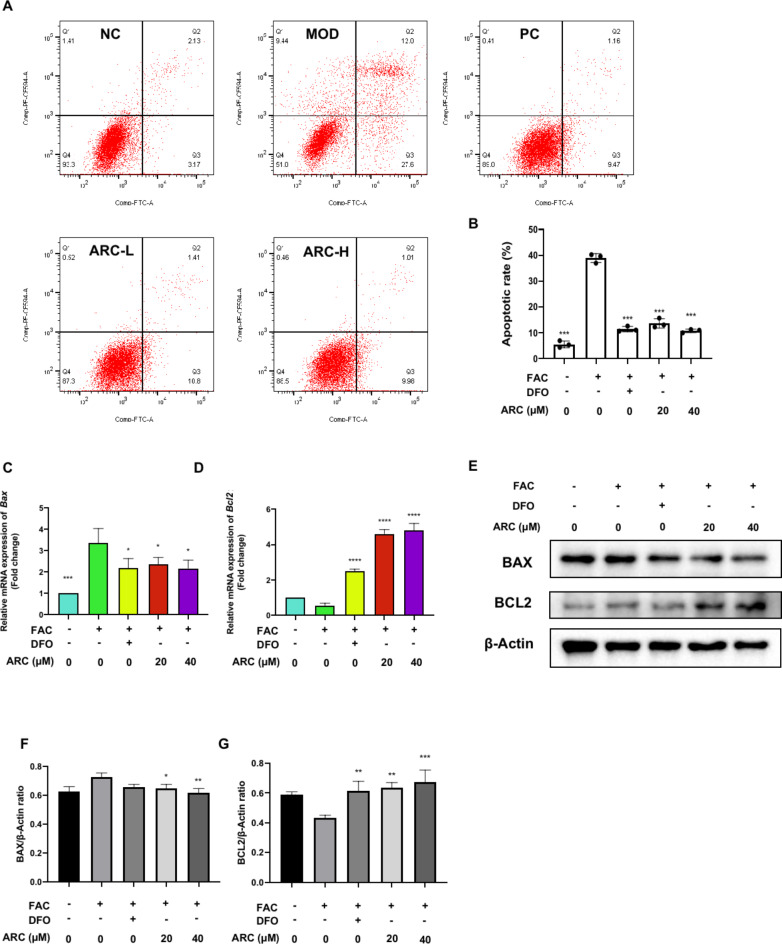
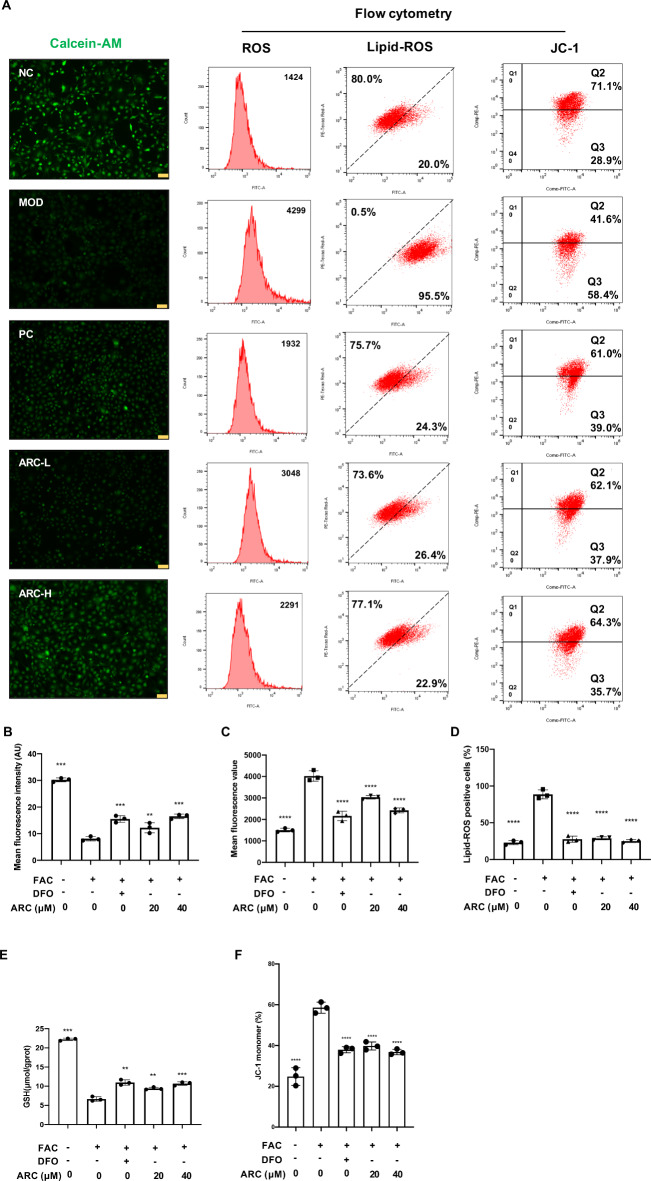
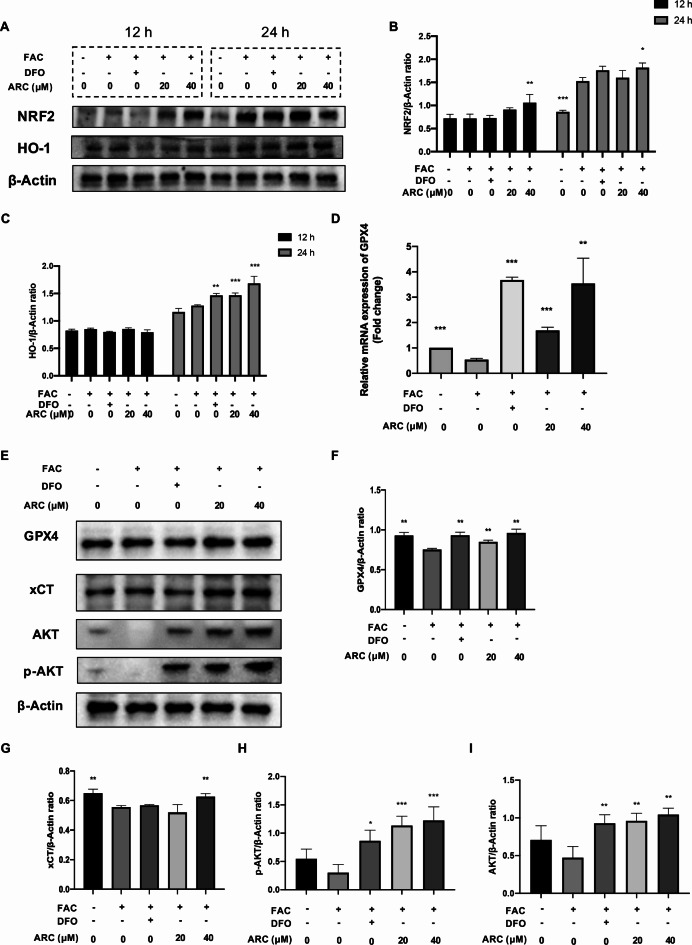
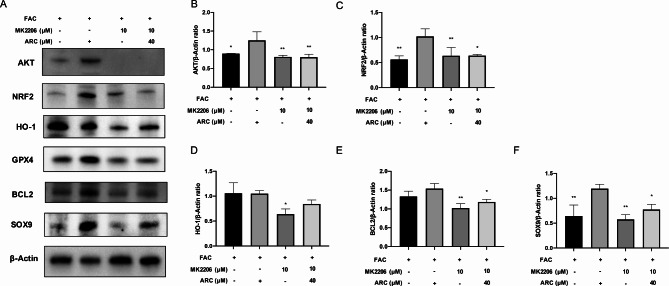
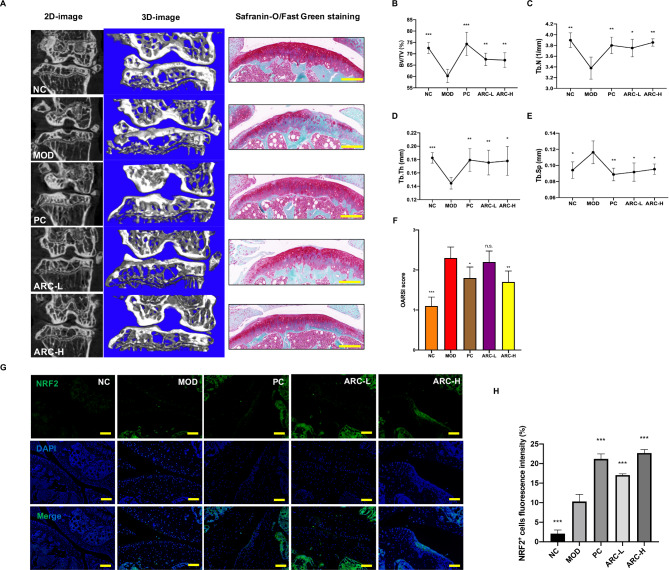
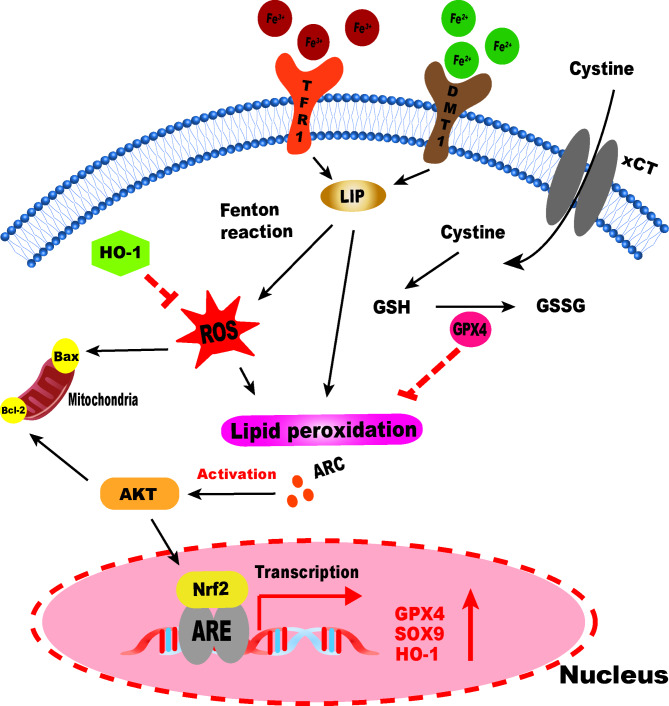
Iron overload (IO) was considered to be a risk factor for cartilage degradation in knee osteoarthritis (KOA) advancement. However, few drugs were found to improve cartilage degeneration by alleviating multiple cell death induced by the impaired iron level of the knee joints. We aimed to elucidate that Arctiin (ARC) plays a role in managing KOA caused by accumulated iron levels by restoring chondrocyte apoptosis and ferroptosis. Single-cell RNA sequencing analysis was used to discover the disparities in chondrocytes between KOA patients and non-KOA individuals. CCK-8 assay was performed to detect chondrocyte viability. Annexin V-FITC/PI staining determined the cell apoptosis rate. The fluorescence density reflected the iron content, ROS, lipid-ROS, and mitochondrial membrane potential. Q-RTPCR and Western Blotting were used to detect the expression levels of genes and proteins expression. Micro-CT and Safranin O-Fast Green staining were used to detect the phenotype of the knee joints. ARC increased cell viability and inhibited chondrocyte apoptosis. Further, ARC acts as an anti-ferroptosis effect by reducing the intracellular iron, ROS, and lipid-ROS content and restoring mitochondrial damage. Based on the results of scRNA-seq, we found that ARC can play a role by activating AKT/NRF2/HO-1 signaling pathway. In vivo, ARC can significantly improve the severity of KOA caused by IO. ARC alleviates oxidative stress in chondrocytes via the AKT/NRF2/HO-1 signaling pathway, suggesting the potential application of ARC in KOA.

Keywords: Apoptosis; Cartilage degeneration; Ferroptosis; Herbal medicine; Iron overload.


Conflict of interest statement

Declarations. Consent for publication: Written informed consent for publication was obtained from all participants. Competing interests: The authors declare no competing interests. Institutional Review Board Statement: All animal experiments were approved by the Review Board of The First Affiliated Hospital of Guangzhou University of Chinese Medicine (Ethic NO. TCMF1-2021029).

Figures

Fig. 1
Fig. 1
scRNA-Seq analysis of GSE220243. (A) Visualization of clustering by Uniform Manifold Approximation and Projection (UMAP) plot of healthy and OA articular cartilage samples. (B) Pseudotime analyses in healthy and OA articular cartilage samples. (C) Violin plot of cartilage degeneration-related, ferroptosis-related, and apoptosis-related markers expression levels between healthy and OA articular cartilage samples. (D) Pseudotime analysis of cartilage degeneration-related, ferroptosis-related, and apoptosis-related markers expression levels from healthy cartilage to OA cartilage.
Fig. 2
Fig. 2
Enrichment analysis. Dot plot of (A) GO biological processes; (B) GO molecular function; (C) GO cell component and (D) top 10 KEGG pathways.
Fig. 3
Fig. 3
ARC rescues chondrocytes killed by excessive iron in a dose-dependent manner. (A) Molecular structure of ARC. (B) Effect of 500µM FAC, 100µM DFO and indicated concentrations (0, 5, 10, 20, 40µM) ARC on the viability of chondrocytes as measured by CCK-8 assay. (C) Representative western blotting images of SOX9 protein. (D) The ratio of band intensity of SOX9 (D) was normalized by β-actin. (“-” means untreated while “+” means treated. Data were presented as mean ± SD. n = 3 per group. Significant differences between the MOD and other groups were shown as * (p-value < 0.05), and **** (p-value < 0.0001)).
Fig. 4
Fig. 4
ARC reduces cell apoptosis rate induced by iron overload. (A) Percentage pro-apoptotic and apoptotic chondrocytes under different treatments including 500µM FAC, 500µM FAC + 100µM DFO, 500µM FAC + 20µM ARC and 500µM FAC + 40µM ARC were examined by annexin V-FITC/PI staining flow cytometry. (B) Bar graph of cell apoptotic rate. (C, D) Relative mRNA expression of Bax and Bcl2. (E) Representative Western Blotting images reflecting the effects of ARC on BAX, and BCL2. (F, G) The ratios of band intensity of BAX (F), and BCL2 (G) were normalized by β-actin. (“-” means untreated while “+” means treated. Data were presented as mean ± SD. n = 3 per group. Significant differences between the MOD and other groups were shown as * (p-value < 0.05), ** (p-value < 0.01), *** (p-value < 0.001), and **** (p-value < 0.0001)).
Fig. 5
Fig. 5
ARC reduces intracellular iron, ROS, and lipid-ROS content of chondrocytes and restores mitochondrial damage. (A) Representative Calcein-AM images, flow cytometry images of ROS level, lipid-ROS level, and mitochondrial potential. (B) Mean fluorescence intensity of Calcein-AM evaluated by image J. (C) Bar chart of mean fluorescence of ROS. (D) Bar chart of lipid-ROS positive cells percentage. (E) Bar graph of intracellular GSH contents. (F) Bar chart of JC-1 monomers percentage. (scale bar = 200 μm; “-” means untreated while “+” means treated. Data were presented as mean ± SD. n = 3 per group. Significant differences between the MOD and other groups were shown as ** (p-value < 0.01), *** (p-value < 0.001), and **** (p-value < 0.0001)).
Fig. 6
Fig. 6
ARC regulates NRF2/HO-1 axis and ferroptosis-related markers. (A) Representative Western Blotting images of different time points (12 h and 24 h) reflecting the effects of ARC on NRF2 and HO-1. (B, C) The ratios of band intensity of NRF2 (B) and HO-1 (C) relative to β-Actin. (D) Relative mRNA expression of Gpx4. (E) Representative Western Blotting images reflecting the effects of ARC on GPX4, xCT. (F, G) The ratios of band intensity of GPX4 (F) and xCT (G) relative to β-Actin. (“-” means untreated while “+” means treated. Data were presented as mean ± SD. n = 3 per group. Significant differences between the MOD and other groups were shown as * (p-value < 0.05), ** (p-value < 0.01), and *** (p-value < 0.001)).
Fig. 7
Fig. 7
The effect of ARC was inhibited via blocking AKT. (A) Representative Western Blotting images reflecting the effects of 40µM ARC on NRF2, HO-1, GPX4, BCL2, and SOX9 with or without 10µM MK2206 which is AKT inhibitor. (B-F) The ratios of band intensity of AKT (B), NRF2 (C), HO-1 (D), BCL2 (E), and SOX9 (F) to β-Actin.
Fig. 8
Fig. 8
ARC reduces the damage to the cartilage induced by iron overload. (A) Representative figures of 2D and 3D reconstruction micro-CT figures of knee joints and decalcified bone stained with Safranin-O/Fast Green (scale bar = 100 μm). Quantitative measurements of subchondral trabecular bone of tibia including BV/TV (B), Tb.N (C), Tb.Th (D) and Tb.Sp (E). (F) OARSI score of Safranin-O/Fast Green staining. (G) Representative figures of NRF2 positive cells in the knee joint (scale bar = 50 μm). (H) Quantitative analyses of NRF2 positive cells per field. (Data were presented as mean ± SD. n = 10 per group. Significant differences between the MOD and other groups were shown as n.s. (p-value > 0.05), * (p-value < 0.05), ** (p-value < 0.01), and *** (p-value < 0.001)).
Fig. 9
Fig. 9
A schematic diagram of ARC inhibiting ferroptosis of chondrocytes via AKT/NRF2/HO-1.

Similar articles

References

    1. Hunter, D. J., Bierma-Zeinstra, S. & Osteoarthritis Lancet393, 1745–1759, doi:10.1016/s0140-6736(19)30417-9 (2019). - PubMed
    1. Brandt, K. D., Radin, E. L., Dieppe, P. A. & van de Putte, L. Yet more evidence that osteoarthritis is not a cartilage disease. Ann. Rheum. Dis.65, 1261–1264. 10.1136/ard.2006.058347 (2006). - PMC - PubMed
    1. Morales-Ivorra, I., Romera-Baures, M., Roman-Viñas, B. & Serra-Majem, L. Osteoarthritis and the Mediterranean Diet: A Systematic Review. Nutrients1010.3390/nu10081030 (2018). - PMC - PubMed
    1. Xu, J. et al. The emerging role of iron dyshomeostasis in the mitochondrial decay of aging. Mech. Ageing Dev.131, 487–493. 10.1016/j.mad.2010.04.007 (2010). - PMC - PubMed
    1. Zhang, H. et al. Hepcidin-induced reduction in iron content and PGC-1β expression negatively regulates osteoclast differentiation to play a protective role in postmenopausal osteoporosis. Aging (Albany NY). 13, 11296–11314. 10.18632/aging.202817 (2021). - PMC - PubMed

Publication types

MeSH terms