. 2024 Dec 30;14(1):32063.
doi: 10.1038/s41598-024-83683-y.

Biophysics and electrophysiology of pulsed field ablation in normal and infarcted porcine cardiac ventricular tissue

Affiliations

Biophysics and electrophysiology of pulsed field ablation in normal and infarcted porcine cardiac ventricular tissue

Damijan Miklavčič et al. Sci Rep. .

Abstract

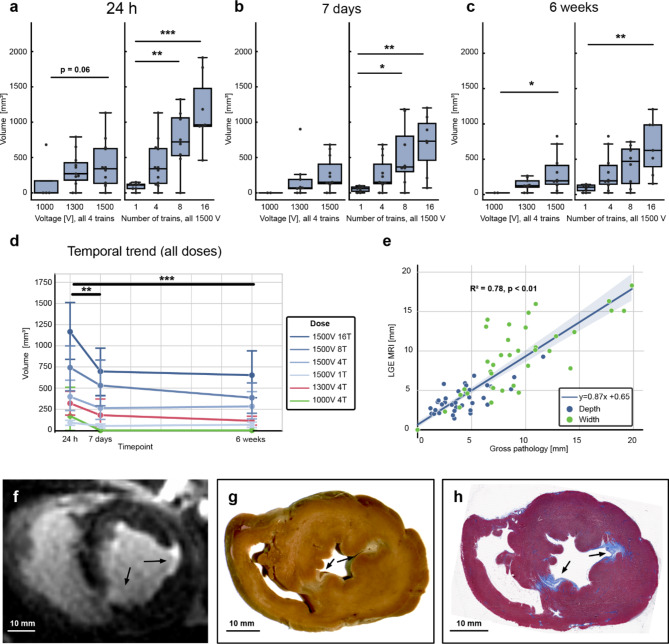
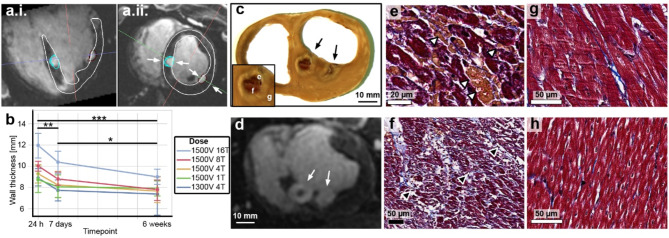
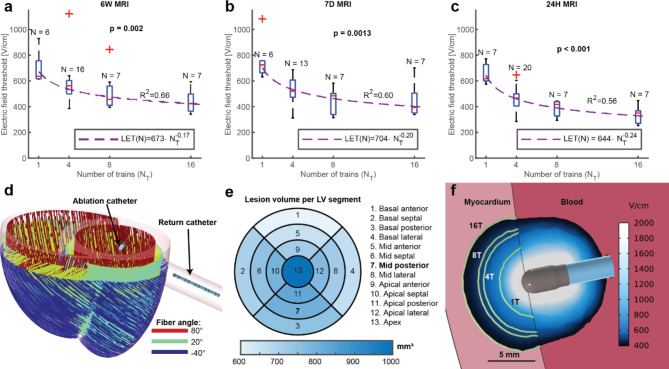
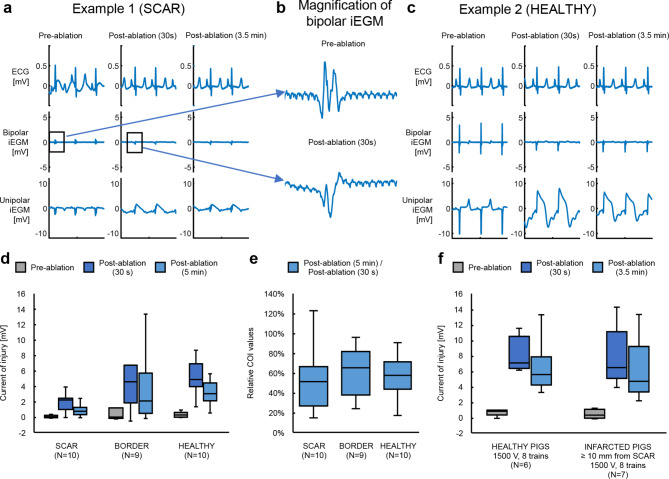
Pulsed Field Ablation (PFA) is a new ablation method being rapidly adopted for treatment of atrial fibrillation, which shows advantages in safety and efficiency over radiofrequency and cryo-ablation. In this study, we used an in vivo swine model (10 healthy and 5 with chronic myocardial infarct) for ventricular PFA, collecting intracardiac electrograms, electro-anatomical maps, native T1-weighted and late gadolinium enhancement MRI, gross pathology, and histology. We used 1000-1500 V pulses, with 1-16 pulse trains to vary PFA dose. Lesions were assessed at 24 h, 7 days, and 6 weeks in healthy and at 48 h in infarcted ventricles. Comparisons of lesion sizes using a numerical model enabled us to determine lethal electric field thresholds for cardiac tissue and its dependence on the number of pulse trains. Similar thresholds were found in normal and infarcted hearts. Numerical modeling and temperature-sensitive MRI confirmed the nonthermal nature of PFA, with less than 2% of a lesion's volume at the highest dose used being attributed to thermal damage. Longitudinal cardiac MRI and histology provide a comprehensive description of lesion maturation. Lesions shrink between 24 h and 7 days post-ablation and then remain stable out to 6 weeks post-ablation. Periprocedural electrograms analysis yields good correlation with lesion durability and size.


Conflict of interest statement

Declarations. Competing interests: Competing interests: G Wright receives research support related to this work from Medtronic, GE Healthcare, and ADAS 3D, D Miklavcic receives research grants from Medtronic and is retained consultant of Medtronic, B Kos is a consultant of Medtronic, A Verma receives research grants from Medtronic, Biosense Webster, Bayer, and serves in advisory capacity to Medtronic, Biosense Webster, Abbott, Adagio Medical, and Medlumics.All the remaining authors declare no conflict of interest.

Figures

Fig. 1
Fig. 1
Nonthermal vs. thermal damage by Pulsed Field Ablation. (a) Calculated temperature in the myocardium at depths of 1, 3 and 7 mm for the 16-pulse-train protocol. Solid lines indicate low blood flow scenario and dashed lines indicate high flow scenario. (b) Calculated temperature distribution in the myocardium at the end of the 16th train (peak temperature). Only temperatures above 43 °C are shown. Black line indicates possible size of the PFA lesion based on the 16-train 7-day MRI LET (median value: 394 V/cm, Fig. 6b). Grid size is 1 × 1 mm. (c) Predicted nonthermal vs. thermal damage for 16-train protocol. Calculated electric field distribution in the myocardium indicates the PFA lesion based on the 16-train 7-day MRI LET – only electric field values above 394 V/cm are shown. Red area indicates possible thermal damage using a threshold of 1 s at ≥ 55 °C in low blood-flow condition (worst case). (d) Calculated thermal damage for 16 train protocol using the threshold of 1 s at ≥ 55 °C and Arrhenius integral - probability of cell death exceeding 63%. Solid lines indicate low blood flow scenario and dashed lines indicate high flow scenario. All temperature and thermal damage calculations shown here were done for the mid posterior lesion, for which the model predicts the highest electric current. (e) Native T1w and 3D LGE MRI at different PFA doses at 24 h post-ablation (blue arrows), in comparison to same acquisitions for RFA (red arrows and red frame). Native T1w PFA images show absence of hyperintensity at lesion locations suggesting lethal thermal threshold was not achieved, compared with clear hyperintense lesion in RFA indicating lethal thermal damage. 3D LGE cMRI demonstrates hyperintensity in PFA locations despite the absence of hyperintensity in native T1w with some microvascular obstruction (MVO) structure at highest PFA dose, while image of RFA lesion shows large MVO. RFA – Radiofrequency ablation; LGE – Late gadolinium enhancement; PFA - Pulsed field ablation; T- train.
Fig. 2
Fig. 2
3D LGE cMR images of PFA lesions (arrows) at 24 h, 7 days, and 6 weeks after ablation of healthy porcine LV myocardium. PFA lesions shown were created in the (a) septum, (b) inferior wall, and (c) posterior wall using differing numbers of pulse trains, all at 1500 V. All images were acquired 15 min after gadolinium injection. The lesion created using the highest PFA dose c) shows a central dark region with slow penetration of gadolinium, likely associated with microvascular obstruction (MVO). At 24 h post-ablation all doses (a-i, b-i and c-i) show hyperintense regions indicative of increased interstitial fluid, vascular permeability and permeability of irreversibly damaged cells, which are diminished at later time points (ii and iii), consistent with edema resolution and degradation of dead cells.
Fig. 3
Fig. 3
Dose-dependence of lesion volume measured using LGE cMRI. Data at (a) 24 h, (b) 7 days, and (c) 6 weeks after ablation. A linear mixed effects model was used to compare voltages, taking the form: volume ~ voltage + (1|ID) (*p < 0.05, **p < 0.01, ***p < 0.001). Similarly, the model used to compare varying numbers of pulse trains at 1500 V was: volume ~ Ntrains + (1|ID). (d) Temporal evolution of lesion volumes created by different PFA dose schemes (model: volume ~ time + (1|ID) + (1|voltage) + (1|Ntrains)). (e). Strong agreement was observed between the 6-week lesion dimensions measured using LGE cMRI and gross pathology. Taken separately, the depth and width models were y = 0.65x + 1.18 (R2 = 0.59, p < 0.01), and y = 0.81x + 1.86 (R2 = 0.66 p < 0.01) respectively. PFA lesions at 6 weeks visualized in f) 3D LGE cMRI (30 min after gadolinium injection), in g) a formalin-fixed cross section of the heart, and in h) a Masson’s trichrome stained histology slide (scale bars: 10 mm).
Fig. 4
Fig. 4
Evaluation of LV wall thickness and local tissue characteristics after PFA using cMRI and histology. (a) 3D LGE cMR images 24 h post ablation, formatted along long-axis (a.i.) and short-axis (a.ii.) planes used to measure LV wall thickness at the site of each ablation. (b) Summary of cMRI-derived LV wall thickness at the site of PFA using differing dose schemes (T = pulse trains) at 24 h, 7 days, and 6 weeks after ablation. A linear mixed effects model controlling for individual differences and number of pulse trains revealed that wall thickness was significantly higher at 24 h post-ablation compared to subsequent time points (*p < 0.05, **p < 0.01, ***p < 0.001). (c) Formalin-fixed cross section of a heart of a pig sacrificed at 48-h time point and (d) corresponding 3D LGE cMRI showing two adjacent 48-h old PFA lesions (arrows), both created by delivering 1500 V in 8-pulse trains. Masson’s trichrome stained sections from a 48-h time point showing (e) hemorrhage (arrowheads), (f) minor interstitial leukocytic infiltrates (arrowheads), and (g) contraction band necrosis. Healthy myocardium at a remote site H) is within normal limits.
Fig. 5
Fig. 5
Evaluation of electrogram changes after PFA. (a) Schematic drawing of unipolar and bipolar iEGM recording generation. (b) Calculation of the current of injury (COI) parameter from unipolar iEGM signals. Blue circles: baseline value measured before the QRS. Red crosses: the start and the end of the area under the curve (AUC - shaded area) window, based on criteria described in the methods. The COI parameter (black arrow) was defined as the AUC divided by the AUC window width. (c) Examples of concrete signals recorded at two different ventricular sites treated with two different doses of PFA and shown for three different time points (pre-ablation, 30 s post-ablation and 3.5 min post-ablation). (c.1) Example 1: a lower dose (1300 V, 4 trains); (c.2) Example 2: a higher dose (1500 V, 8 trains). (d) and (e) Comparison of changes in peak-to-peak amplitude of bipolar iEGMs (bandwidth: 30–500 Hz). (d) Absolute values at three different time points (pre-ablation, 30 s post-ablation and 3.5 min post-ablation) grouped by the dose delivered. (e) Post-ablation values normalized to the pre-ablation values. A linear mixed effects (LME) model was used to compare doses and post-treatment times, taking the form: relative PP values ~ Time + Dose + (1|PigID/lesion) (*p < 0.05), where the dose was either the voltage or the number of pulses. (f) and (g): Comparison of changes in COI of unipolar iEGMs (bandwidth: 0.5–500 Hz). (f) Absolute values at three different time points (pre-ablation, 30 s post-ablation and 3.5 min post-ablation) grouped by the dose delivered. LME model was used to compare doses and post-treatment times, taking the form: COI ~ Time + Dose + (1|PigID/lesion) (*p < 0.05), where the dose was either the voltage or the number of pulses. (g) Values of COI recorded 3.5 min post-ablation normalized to COI values recorded 30 s post-ablation. LME model was used to compare doses, taking the form: relative COI ~ Dose + (1|PigID) (*p < 0.05, **p < 0.01), where the dose was either the voltage or the number of pulses.
Fig. 6
Fig. 6
Lethal electric field threshold (LET). LET was calculated/obtained by comparison of numerical model and volume determined by 3D LGE cMRI at different time points after ablation and number of trains: (a) 24 h: median LET was 617, 466, 417, and 350 V/cm for 1, 4, 8, and 16 trains, respectively. (b) 7 days: median LET was 725, 520, 484, and 394 V/cm for 1, 4, 8, and 16-pulse-trains, respectively. (c) 6 weeks: median LET was, was 636, 562, 457, and 423 V/cm for 1, 4, 8, and 16-pulse-trains, respectively. (d) 3D schematic biventricular geometry with the cardiac fiber orientation, which was used in the numerical model to calculate electric field distribution and determine LET. Image generated using COMSOL Multiphysics. (e) Predicted lesion volumes for lesions located in different LV segments based on the 16-pulse-train 7-day LGE cMRI LET (394 V/cm). (f) Predicted electric field distribution in the cardiac tissue and blood in the case of mid posterior lesion with the green contours representing the median LET threshold calculated with the 7-day LGE cMRI volumes for different number of trains as marked on the individual contours.
Fig.7
Fig.7
Pulsed field ablation delivered and simulated in infarcted ventricles. (a) Short-axis LGE cMRI showing infarct on the anterior side of the left ventricle. (b) 3D numerical model of scarred tissue. Healthy myocardium is shaded red, dense scar and border zone are dark and light blue respectively, and the PFA lesion is shaded in green. The catheter can be seen in the upper left part of the circled area. For PFA lesions, the LET determined based on MRI at 48 h (8 trains) for healthy tissue in infarcted pigs was chosen (median value: 456 V/cm, which is higher than the threshold determined in healthy animals at 24 h (417 V/cm), however the difference was not significant (p = 0.11, Kruskal-Wallis test)). The location of the image plane in a) and 2D view in (c) is indicated in blue. (c) Short axis cross-section of the LV at the lesion location. The image shows the in silico electric field above the LET, outlined in green. (d) The corresponding Masson’s trichrome stained histology section demonstrates the presence of an acute transmural PFA lesion despite the presence of significant regional intramural myocardial scar (red = myocardium, blue = fibrosis, purple = irreversible injury, acute lesion is outlined in green). (e) Comparison of depth, (f) comparison of transmurality, and (g) comparison of wall thickness of lesions created in healthy myocardium or scarred tissue, across the 5 infarcted animals (p-values calculated using LME models to control for individual differences).
Fig. 8
Fig. 8
(a) and (c) Examples of signals recorded at two different ventricular sites in scarred (a) and healthy tissue (c; 27 mm from the edge of scarred tissue based on histology) when treated with the same PFA dose (1500 V, 8 trains) in the same animal and shown for three different time points (pre-ablation, 30 s post-ablation and 3.5 min post-ablation). (b) Magnified depolarization component of bipolar signals (top: before ablation; bottom: 30 s after ablation). (d) Absolute COI measured at three different time points (pre-ablation, 30 s post-ablation and 5 min post-ablation) grouped by the targeted tissue type (scar, border, healthy). An LME model of the form COI ~ Time * Tissue + (1|Pig/Lesion) revealed significant difference between border & scar, averaged over all time points (* p = 0.01). (e) Normalized COI (5 min post-ablation values normalized to 30 s post-ablation values). No statistically significant differences between the tissue types were observed using a model of the form relative COI ~ Tissue + (1|PigID). (f) Comparison of absolute COI values (pre-ablation, 30s post-ablation, and 5 min post-ablation) in healthy myocardium of healthy and infarcted animals. An LME model of the form COI ~ Time + Pig Model + (1|PigID/Lesion) revealed significant changes in COI with time post-ablation (p < 0.0001 for both post-ablation measurements compared to pre-ablation; p = 0.02 comparing 30 s and 5 min post-ablation measurements). No significant difference was detected between healthy and infarcted animals.

References

    1. Reddy, V. Y. et al. Pulsed field or conventional thermal ablation for Paroxysmal Atrial Fibrillation. N Engl. J. Med.389, 1660–1671 (2023). - PubMed
    1. Verma, A. et al. Pulsed field ablation for the treatment of Atrial Fibrillation: PULSED AF Pivotal Trial. Circulation147, 1422–1432 (2023). - PMC - PubMed
    1. Anter, E. et al. Dual-energy lattice-tip ablation system for persistent atrial fibrillation: a randomized trial. Nat. Med. 1–8. 10.1038/s41591-024-03022-6 (2024). - PMC - PubMed
    1. Ekanem, E. et al. Safety of pulsed field ablation in more than 17,000 patients with atrial fibrillation in the MANIFEST-17K study. Nat. Med.10.1038/s41591-024-03114-3 (2024). - PMC - PubMed
    1. Chun, K. R. J. et al. State-of-the-art pulsed field ablation for cardiac arrhythmias: ongoing evolution and future perspective. Europace26, euae134 (2024). - PMC - PubMed

Publication types

LinkOut - more resources