. 2025 Jan;27(1):154-168.
doi: 10.1038/s41556-024-01558-w. Epub 2024 Dec 30.

TRACERx analysis identifies a role for FAT1 in regulating chromosomal instability and whole-genome doubling via Hippo signalling

Affiliations

TRACERx analysis identifies a role for FAT1 in regulating chromosomal instability and whole-genome doubling via Hippo signalling

Wei-Ting Lu et al. Nat Cell Biol. 2025 Jan.

Abstract

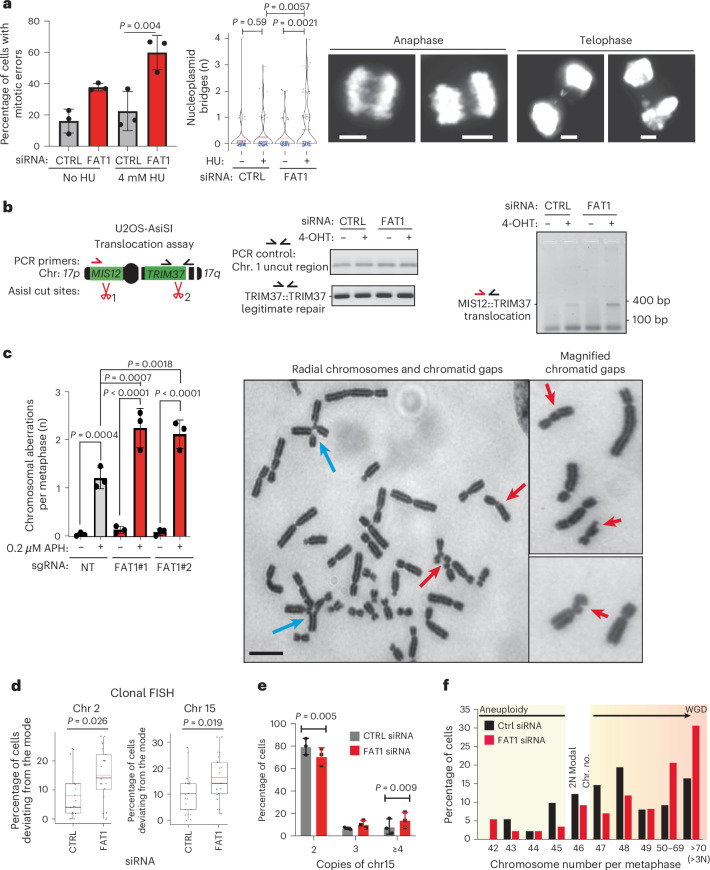
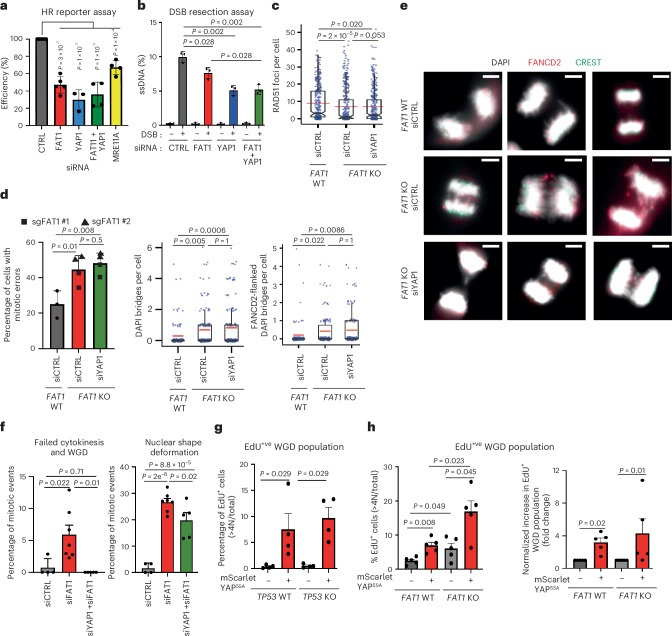
Chromosomal instability (CIN) is common in solid tumours and fuels evolutionary adaptation and poor prognosis by increasing intratumour heterogeneity. Systematic characterization of driver events in the TRACERx non-small-cell lung cancer (NSCLC) cohort identified that genetic alterations in six genes, including FAT1, result in homologous recombination (HR) repair deficiencies and CIN. Using orthogonal genetic and experimental approaches, we demonstrate that FAT1 alterations are positively selected before genome doubling and associated with HR deficiency. FAT1 ablation causes persistent replication stress, an elevated mitotic failure rate, nuclear deformation and elevated structural CIN, including chromosome translocations and radial chromosomes. FAT1 loss contributes to whole-genome doubling (a form of numerical CIN) through the dysregulation of YAP1. Co-depletion of YAP1 partially rescues numerical CIN caused by FAT1 loss but does not relieve HR deficiencies, nor structural CIN. Importantly, overexpression of constitutively active YAP15SA is sufficient to induce numerical CIN. Taken together, we show that FAT1 loss in NSCLC attenuates HR and exacerbates CIN through two distinct downstream mechanisms, leading to increased tumour heterogeneity.


Conflict of interest statement

Competing interests: D.B. reports personal fees from NanoString and AstraZeneca and has a patent (PCT/GB2020/050221) issued on methods for cancer prognostication. M.A.B. has consulted for Achilles Therapeutics. M.J.-H. has received funding from CRUK, the National Institutes of Health National Cancer Institute, the International Association for the Study of Lung Cancer International Lung Cancer Foundation, the Lung Cancer Research Foundation, the Rosetrees Trust, the UK and Ireland Neuroendocrine Tumour Society and the NIHR. M.J.-H. has consulted for, and is a member of, the Achilles Therapeutics Scientific Advisory Board (SAB) and Steering Committee, has received speaker honoraria from Pfizer, Astex Pharmaceuticals, Oslo Cancer Cluster, Bristol Myers Squibb and Genentech. M.J.-H. is listed as a co-inventor on a European patent application relating to methods for the detection of lung cancer (PCT/US2017/028013). This patent has been licensed to commercial entities and, under the terms of their employment, M.J.-H. is due a share of any revenue generated from such license(s). M.J.-H. is also listed as a co-inventor on a GB priority patent application (GB2400424.4) with title ‘Treatment and prevention of lung cancer’. K.L. has a patent pending on indel burden and checkpoint inhibitor response, has received speaker fees from Roche Tissue Diagnostics and research funding from the CRUK Therapeutic Discovery Laboratories–Ono Pharmaceutical–LifeArc alliance and Genesis Therapeutics and has held consulting roles with Ellipses Pharma, Monopteros and Kynos Therapeutics. N.J.B. is listed as a co-inventor on a patent related to the identification of responders to cancer treatment (PCT/GB2018/051912), has submitted a patent application (PCT/GB2020/050221) on methods for cancer prognostication and has a patent on methods for predicting anti-cancer response (US14/466,208). N.M. has stock options in, and has consulted for, Achilles Therapeutics and holds a European patent in determining human leukocyte antigen (HLA) LOH (PCT/GB2018/052004), has a patent pending on determining HLA disruption (PCT/EP2023/059039) and is a co-inventor on a patent on the identification of responders to cancer treatment (PCT/GB2018/051912). N.K. acknowledges grants from AstraZeneca. C.S. acknowledges grants from AstraZeneca, Boehringer Ingelheim, Bristol Myers Squibb, Pfizer, Roche VENTANA, Invitae (previously ArcherDX; a collaboration on minimal residual disease sequencing technologies), Ono Pharmaceutical and Personalis. He is Chief Investigator for the AZ MeRmaiD-1 and -2 clinical trials and is the Steering Committee Chair. He is also Co-Chief Investigator of the NHS Galleri Trial funded by GRAIL and a paid member of GRAIL’s SAB. He receives consultant fees from Achilles Therapeutics (and is also a SAB member), Bicycle Therapeutics (and is also a SAB member), Genentech, Medicxi, the China Innovation Centre of Roche (formerly the Roche Innovation Centre – Shanghai); Metabomed, until July 2022, Relay Therapeutics (and is also a SAB member), SAGA Diagnostics (and is also a SAB member) and the Sarah Cannon Research Institute. C.S. has received honoraria from Amgen, AstraZeneca, Boehringer Ingelheim, Bristol Myers Squibb, GlaxoSmithKline, Illumina, MSD, Novartis, Pfizer and Roche VENTANA. C.S. has previously held stock options in ApoGen Biotechnologies and GRAIL and currently has stock options in EPIC Bioscience, Bicycle Therapeutics, Relay Therapeutics and Achilles Therapeutics. C.S. is also a co-founder of Achilles Therapeutics. C.S. declares patents and patent applications relating to methods for the detection of lung cancer (PCT/US2017/028013), neoantigen targeting (PCT/EP2016/059401), the identification of patent response to immune checkpoint blockade (PCT/EP2016/071471), the identification of patients who respond to cancer treatment (PCT/GB2018/051912), the determination of HLA LOH (PCT/GB2018/052004), the prediction of survival rates of patients with cancer (PCT/GB2020/050221) and methods and systems for tumour monitoring (PCT/EP2022/077987). C.S. is an inventor on a European patent application (PCT/GB2017/053289) relating to assay technology to detect tumour recurrence. This patent has been licensed to a commercial entity and, under the terms of their employment, C.S. is due a share of any revenue generated from such license(s). The remaining authors declare no competing interests.

Figures

Fig. 1
Fig. 1. DDR and CIN loss-of-function screen of genome doubling-associated drivers from the TRACERx 100 cohort.
a, Flow chart depicting candidate gene selection for the DDR and CIN screens. b, Schematic of the design of the DDR and CIN screens. c, Venn diagram showing the six driver genes contributing to DDR and CIN. d, Validation of the six candidate genes by DR-GFP homologous recombination reporter assay; BRCA2 serves as a positive control. HR efficiencies are normalized to those of control samples. Statistical significance was determined by two-sided, one-sample t-test. The data represent means ± s.d. (n = 3 biological replicates, except for BRCA2, for which n = 2). e, Validation of the six candidate genes by DIvA U2OS-AsiSI site-directed resection assay. Statistical significance was determined by two-sided paired t-test. The data represent means ± s.d. (n = 3 biological replicates). f, Box plots quantifying RAD51 foci formation in A549 cells following depletion of the six candidate genes, following 6 Gy ionizing irradiation and 1 h of recovery. The box edges represent interquartile ranges, the horizontal lines represent median values and the ranges of the whiskers denote 1.5× the interquartile range (n = 3 biological replicates; >150 cells quantified per biological replicate). Statistical significance was determined by Kruskal–Wallis test with Dunn’s multiple comparison test. g, Driver mutation distribution and mutational timing of the six candidate genes in the TRACERx 421 cohort. ATM, CHEK2, ATR, CHEK1 and members of the Fanconi anaemia (FA)/BRCA pathway are included for comparison. FAT1 is highlighted in red. CTRL, control; EGFR, epidermal growth factor receptor; FACS, fluorescence-activated cell sorting; HU, hydroxyurea; IR, ionizing radiation; mut, mutant; nt, nucleotides; WT, wild type. Source data
Fig. 2
Fig. 2. FAT1 loss of function is enriched in the TRACERx 421 cohort and leads to an elevated mitotic error rate and WGD.
a, Top, schematic of dN/dS ratio analysis. Bottom, results of dN/dS ratio analysis in the TRACERx 421 cohort, demonstrating that FAT1 truncation mutations are selected early in LUSC tumour evolution. The data points represent estimated dN/dS ratios and the error bars represent 95% confidence intervals calculated using the genesetdnds function from the R package dNdScv. The TRACERx 421 cohort comprised 233 males and 188 females (421 patients total), corresponding to a 55:45 male:female ratio. 93% of the cohort was from a White ethnic background and the mean age of the patients was 69 years, ranging between 34 and 92 years. Written informed consent was obtained. None of the patients was compensated for their involvement in the study. b, Genomic identification of significant targets In cancer (GISTIC) analysis of LUAD (141 patients) and LUSC tumours (80 patients) in TRACERx with clonal WGD only, demonstrating that SCNA loss at the FAT1 genomic locus (4q35.2; red text and highlighted) is positively selected in tumours with clonal WGD only. SCNA loci overlapping with common or rare chromosome fragile sites, are annotated (in blue for common fragile sites and in green for rare fragile sites). c, MSAI analysis illustrating that the genomic region of chromosome 4 that harbours the FAT1 gene (arrows) is frequently lost in LUSC. Statistical significance was determined by Fisher’s exact test. In the schematic at the top, paternal and maternal chromosomes are indicated in blue and red, respectively. d, Top, schematic illustrating the location of the FAT1 gene on chromosome 4, together with other 4q35.2 genes within the frequently lost 4q35.2 genomic region. Bottom, selection pressures against losing genes. The data are from the Genome Aggregation Database (gnomAD) and demonstrate high selective pressure against deletion of the FAT1 genomic locus within 4q35.2. exp, expected; LOF, loss of function; obs, observed.
Fig. 3
Fig. 3. FAT1 loss attenuates HR repair.
a, Box plots demonstrating the impact of FAT1 siRNA knockdown on early DNA damage signalling and 53BP1 binding in A549 cells. The boxes represent interquartile ranges, the black and red bars represent median and mean values, respectively, and the ranges of the whiskers denote 1.5× the interquartile range. Statistical significance was determined by two-sided Wilcoxon rank-sum test (n = 3 biological replicates). The total numbers of cells quantified per condition were as follows: n ≥ 370 (pATM), n ≥ 438 (γH2A.X), n ≥ 448 (53PB1), n ≥ 560 (CtIP) and n ≥ 218 (BRCA1). b, Schematic of the FAT1 functional domains. The full-length FAT1 protein is 4,588 amino acids. c, RAD51 IRIF formation following 6 Gy ionizing radiation and 1 h of recovery in FAT1 CRISPR knockout (sgFAT1) versus control A549 cells with overexpression of HA–FAT1ICD versus pcDNA3.1. The boxes represent interquartile ranges, the black and red bars represent median and mean values, respectively, and the ranges of the whiskers denote 1.5× the interquartile range. Statistical significance was determined by two-sided Kruskal–Wallis test followed by Dunn’s test with Bonferroni correction (n = 3 biological replicates). df, Top, cartoons depicting examples of HRD-related large-scale transition (LST; d), telomeric allelic imbalance (TAI; e) and LOH (f). Bottom left, Permutation analysis showing a correlation between FAT1 CNA and HRD-related genomic signatures based on TCGA LUAD data. Red lines indicates 90 and 95% confidence intervals, blue line indicates observed correlation value. Bottom right, FAT1 driver mutation scores for these respective genetic alterations, based on TRACERx LUAD data. For the TRACERx LUAD data, tumour numbers were as follows: n = 212 (WT) and n = 17 (mut). In the box and whisker plots, the boxes represent interquartile ranges, the lines represent median values and the ranges of the whiskers denote 1.5× the interquartile range. Statistical significance was determined by two-sided mixed-effects linear model with purity as a fixed covariate and tumour ID as a random variable. g, Top, cartoon showing the design of the EJ5–GFP distal end-joining reporter integrated in U2OS cells. Bottom, 53BP1 siRNA knockdown, but not FAT1 knockdown, affects the distal end-joining rate. The data represent means ± s.d. Statistical significance was determined by two-sided repeated measures one-way analysis of variance (ANOVA) with Holm–Šidák correction (n = 5 biological repeats). h, Top, cartoon showing the design of the EJ2–GFP alternative end-joining reporter integrated into U2OS cells. Bottom, FAT1 siRNA knockdown significantly reduces the alternative end-joining efficiency. The data represent means ± s.d. Statistical significance was determined by two-sided paired t-test (n = 4 biological repeats). EGF, epidermal growth factor-like domain; LAMG, laminin G-like domain; NLS, nuclear localization signal. Source data
Fig. 4
Fig. 4. FAT1 loss elevates replication stress and micronuclei.
a, FAT1 knockout exacerbates replication fork stalling in A549 cells. Top, scheme of the nucleotide labeling used to measure replication fork stalling. Bottom (left) quantification; (right), representative image for the DNA fibre experiments. The data represent means ± s.d. Statistical significance was determined by two-sided paired t-test (n = 3 biological replicates; >600 forks counted in total). Scale bars, 20 µm. b, TCGA LUAD analysis showing that FAT1 copy number loss is significantly correlated with weighted genome instability index measurements. The blue lines indicate FAT1 loss and the red dotted lines indicate the 90 and 95% confidence intervals. Confidence intervals were generated using computational permutation analyses. c, Box plot comparing the numbers of indels in FAT1 WT versus mutated tumours in the Genomics England LUAD and LUSC cohorts. The boxes represent interquartile ranges, the lines represent median values and the ranges of the whiskers denote 1.5× the interquartile range. Statistical significance was determined by two-sided Wilcoxon rank-sum test. n = 818 (WT) and n = 16 (mut). d, Transient FAT1 siRNA knockdown induces the formation of 53BP1 bodies in cyclin A-negative U2OS cells following 4 mM hydroxyurea for 5 h and recovery for 24 h. Statistical significance was determined by two-sided Wilcoxon rank-sum test. Scale bars, 10 μm. The red bars in the graph to the left represent mean values (n = 5 biological replicates). e,f, Transient FAT1 siRNA knockdown in U2OS cells induces the formation of total micronuclei with or without replication stress induced by 5 h of 4 mM hydroxyurea followed by 24 h recovery (e), as well as the formation of both acentric and centromeric micronuclei following the hydroxyurea treatment (f). The data represent means ± s.d. Statistical significance was determined by one-way ANOVA with Bonferroni correction. Biological repeats: n = 8 (e) and n = 4 (f). g,h, FAT1 loss elevates the rate of micronuclei formation in response to replication stress induced by 0.2 µM aphidicolin treatment (24 h) following FAT1 CRISPR knockout in A549 cells (g) or transient siRNA knockdown in T2P cells (h). The data represent means ± s.d. Statistical significance was determined by two-sided Student’s t-test. Biological repeats: n = 4 (total micronuclei in g), n = 3 (centromeric and acentric micronuclei in g) and n = 8 (h). Source data
Fig. 5
Fig. 5. FAT1 loss increases structural CIN and chromosome numbers.
a, Transient FAT1 knockdown significantly increases the mitotic error rate (lagging chromosomes plus DAPI bridges; left; data represent means ± s.d.) and the occurrence of nucleoplasmid bridges (middle; red bars represent mean values) in U2OS cells after 5 h treatment with 4 mM hydroxyurea and 24 h recovery. Statistical significance was determined by one-way ANOVA with Bonferroni correction (left) or Dunn’s test (middle). Right, selected maximum projection images following FAT1 knockdown, showing DAPI-stained mitotic U2OS cells following treatment with 4 mM hydroxyurea and 24 h recovery. Scale bars, 5 μm. Over 100 mitotic cells were scored across three biological replicates. b, Representative PCR-based semi-quantitative DIvA U2OS-AsiSI translocation assay. Transient FAT1 siRNA knockdown increases illegitimate repair products. PCR products generated from the uncut region and the legitimate repair product were used as the loading control. n = 3 biological replicates. c, Histogram (left) and representative images (right) showing that A549 cells with FAT1 loss exhibit a significantly increased number of chromosomal aberrations upon challenge with replication stress induced by 0.2 µM aphidicolin (APH) treatment. Scale bar, 5 μm. The data represent means ± s.d. Statistical significance was determined by one-way ANOVA with Holm–Šidák correction. A total of 60 metaphases were scored across three biological replicates per condition. Blue and red arrows indicate radial chromosomes and chromatid gaps, respectively. df, Transient FAT1 siRNA knockdown causes a significant numerical deviation in chromosome number in H1944 cells, as determined by multiple methodologies, including clonal fluorescence in situ hybridization (d), ImageStream high-throughput flow cytometry (e) and metaphase spreads (f). The histogram data represent means ± s.d. For the box plots, the boxes represent interquartile ranges, the black and red lines represent median and mean values, respectively, and the ranges of the whiskers denote 1.5× the interquartile range. Statistical significance was determined by two-sided Wilcoxon rank-sum test (d) or two-sided paired t-test (e). n = 3 biological replicates for all cases. bp, base pairs. NT, non-targeting. Source data
Fig. 6
Fig. 6. FAT1 loss leads to an elevated mitotic error rate and results in WGD.
a, Representative dot plots demonstrating FAT1 ablation in PC9 cells and assessment of EdU incorporation beyond the normal G2 phase, to visualize WGD. b, Top, representative western blot validating FAT1 knockout. Bottom, quantification of EdU incorporation beyond the normal G2 population showing that FAT1 knockout significantly increases the WGD population in PC9 cells. The data represent means ± s.d. Statistical significance was determined by one-way ANOVA with Bonferroni correction. Biological repeats: n = 7 (sgNT), n = 5 (sgFAT1 clone 1) and n = 4 (sgFAT1 clone 2). c, Schematic (left) and histogram (right) showing the impact of transient FAT1 knockdown in TERT RPE-1 cells on the promotion of WGD through mitotic bypass, as determined by live-cell imaging. The data represent means ± s.e.m. Statistical significance was determined by one-way ANOVA with Bonferroni correction. Biological repeats: n = 3 (with aphidicolin treatment) and n = 6 (without aphidicolin treatment). d,e, Schematics (left) and histograms (right) showing that transient FAT1 siRNA knockdown in TERT RPE-1 cells increases the rates of cytokinesis failure (d) and nuclear shape deformation (e), as determined by 30× magnification live-cell microscopy imaging at 20 min intervals. The data represent means ± s.e.m. Statistical significance was determined by two-sided paired t-test, At least 200 mitotic events were tracked per condition over five biological replicates. YFP, yellow fluorescent protein. Source data
Fig. 7
Fig. 7. FAT1 loss leads to dysregulation of the Hippo pathway.
a, Western blot demonstrating the impact of FAT1 knockdown on the Src–Mek–Erk signalling axis in hTERT RPE-1 and T2P cells. The results are representative of three repeats. b, Scatter plot showing the impact of transient siRNA depletion of FAT1 on nuclear YAP1 localization using the stringent PTEMF fixation buffer (Methods) in TERT RPE-1 cells. The red bars represent median values. Statistical significance was determined by two-sided Kruskal–Wallis test followed by Dunn’s multiple comparisons test. Over 170 cells were scored per condition over three biological replicates. c, Top, schematic illustrating the predicted domains of the FAT1 protein and respective regions cloned into a pCMV expression plasmid with an HA epitope tag. Bottom, TEAD activity in FAT1 knockout PC9 hexaploid WGD cells. The normalized TEAD activity was measured as an enrichment of the neonGreen signal over the untransfected background signal in each experiment. The HA signal was used to identify successful FAT1 rescue construct co-transfection at the single-cell level. TEAD activity was elevated in FAT1-knockout cells but could be further increased by overexpressing the constitutively active HA–YAP15SA mutant. Overexpression of the FAT1 wild-type construct repressed TEAD activity. However, overexpression of FAT1 mutants devoid of the MIB2 binding region (mScarlet–HA–FAT1MIB∆) and HA–FAT1ICD did not repress TEAD activity. The edges of the histograms represent mean values. Statistical significance was determined by two-sided Kruskal–Wallis test followed by Dunn’s multiple comparisons test. More than 95 cells were scored over three biological replicates. d, DSB resection assay, showing that transient knockdown of LATS1 and LATS2—both negative regulators of YAP1—represses ssDNA formation at DSB break sites (chr22:37194035, ssDNA measured 131 nucleotides from the DSB) in U2OS-AsiSI cells. The data represent means ± s.d. (n = 4 biological replicates). Statistical significance was determined by two-sided paired t-test. e, Both LATS1 and LATS2 siRNA knockdown in U2OS cells elevate rates of 53BP1 nuclear body formation when challenged with replication stress (5 h of 4 mM hydroxyurea followed by 24 h recovery). The boxes represent interquartile ranges, the black and red lines represent median and mean values, respectively, and the ranges of the whiskers denote 1.5× the interquartile range. Statistical significance was determined by two-sided Wilcoxon rank-sum test. More than 340 cells were scored over three biological replicates. f, Both LATS1 and LATS2 siRNA knockdown in U2OS cells induce centromeric and acentric micronuclei formation following challenge with replication stress (5 h of 4 mM hydroxyurea followed by 24 h recovery), suggestive of a mitotic segregation deficiency. Statistical significance was determined by repeated measures one-way ANOVA. The data represent means ± s.d. (n = 3 biological replicates). g, Transient siRNA knockdown of LATS1 in U2OS cells elevates the mitotic error rate. The data represent means ± s.d. Statistical significance was determined by repeated measures one-way ANOVA (n = 3 biological replicates). MIB2, MindBomb2-interacting domain; mS, mScarlet; TM, transmembrane domain. Source data
Fig. 8
Fig. 8. Co-depletion of FAT1 and YAP1 reverses cytokinesis failure but not HR deficiencies.
a, Impact of FAT1/YAP1 siRNA co-depletion in U2OS cells, as determined by DR-GFP HR reporter assay. MRE11A siRNA served as a positive control. The HR efficiencies are normalized to those of the control samples. Statistical significance was determined by one-way ANOVA with Holm–Šidák correction. The data represent means ± s.d. Biological replicates: n = 5 (siCTRL and siFAT1), n = 3 (siYAP1) and n = 4 (siFAT1 + siYAP1 and siMRE11A). b, ssDNA resection rates for FAT1/YAP1 siRNA co-depletion, as determined by DIvA U2OS-AsiSI site-directed resection assay with the DSB site located at chr22:37194035, ssDNA measured 131 nucleotides from the DSB. Statistical significance was determined by one-way ANOVA with Holm–Šidák correction. The data represent means ± s.d. (n = 3 biological replicates). c, Box plots quantifying RAD51 foci formation in A549 cells following the loss of FAT1, or the combined loss of both FAT1 and YAP1, after 6 Gy ionizing irradiation and 1 h recovery. The boxes represent interquartile ranges, the black and red lines represents median and mean values, respectively, and the ranges of the whiskers denote 1.5× the interquartile range. Over 380 cells were scored across three biological replicates. Statistical significance was determined by uncorrected Dunn’s test. d,e, Plots (d) and representative images (e) illustrating the quantification of mitotic error rates in A549 cells after 24 h of aphidicolin treatment (0.2 µM). FAT1 wild-type or knockout cells were transiently depleted of YAP1 using RNAi. For the mitotic error analysis, statistical significance was determined by one-way ANOVA with Holm–Šidák multiple correction and the data represent means ± s.d. (biological repeats: n = 3 (FAT1 WT) and n = 4 (FAT1 knockout)). For the DAPI bridge and Fanconi anaemia complementation group D2 (FANCD2)-flanked DAPI bridge analyses, the red lines represent mean values, the boxes represent interquartile ranges and the ranges of the whiskers denote 1.5× the interquartile range, and statistical significance was determined by Dunn’s test with Bonferroni correction. Over 100 mitotic cells were scored across three biological replicates. Scale bars, 5 µM. f, Results of live-cell imaging analysis, showing that FAT1/YAP1 double siRNA knockdown in TERT–RPE-1 cells fully rescued the failed cytokinesis and WGD introduced by FAT1 knockdown (left) but only partially ameliorated the nuclear shape deformation (right). Statistical significance was determined by one-way ANOVA. At least five biological replicates were quantified per condition. Biological repeats: n = 4 (siCTRL), n = 7 (siFAT1) and n = 5 (siFAT1 + siYAP1). The data represent means ± s.e.m. g, Histogram illustrating the WGD populations in TP53 wild-type versus knockout RPE-1 cells with or without transient mScarlet–YAP5SA transfection. The data represent means ± s.e.m. Statistical significance was determined by two-sided Mann–Whitney test (n = 4 biological repeats). h, Histograms illustrating the total (left) and normalized (right) EdU+ WGD populations in FAT1 wild-type versus knockout PC9 cells, with or without transient mScarlet–YAP5SA transfection. The data represent means ± s.e.m. (n = 5 biological repeats). Statistical significance was determined by repeated measures one-way ANOVA with Benjamini–Hochberg correction (left) or Friedman test (right). KO, knockout. Source data
Extended Data Fig. 1
Extended Data Fig. 1. Summary of the DDR and CIN loss-of-function screen of genome-doubling-associated drivers from the TRACERx 100 cohort.
a, Unsupervised clustering of the results from the DDR screen of 37 TRACERx drivers in 4 LUAD cell lines. Each row represents a DDR foci readout under a given genotoxic stress. Random forest classifiers were used to identify genes that had feature scores similar to positive controls; known DDR genes such as ATR, CHEK1, RAD51 and TP53BP1 are highlighted. Hierarchical clustering was used to calculate the Euclidean distance between TRACERx drivers and the known DDR positive control genes. b, HAC assay was used to assess the impact of gene depletion and mild replication stress on CIN, through modelling chromosome loss using an HT-1080 reporter system. Cells were processed and data was analysed as described in Methods. Data are displayed as scatter plots of log fold changes (LFCs) and Strictly Standardized Mean Difference (SSMDs), highlighting negative and positive control genes, and genes that passed the hit threshold (green area). Source data
Extended Data Fig. 2
Extended Data Fig. 2. Depletion of several TRACERx driver genes reduces RAD51 foci formation post-ionizing radiation.
a-b, Box plots quantifying RAD51 foci in the presence and absence of 6Gy IR in A549 (A) and H1944 (B) cells. Cells were irradiated and allowed 1h recovery. The boxes represent the interquartile range, horizontal lines represent the median and the whiskers range denotes 1.5 x interquartile ranges, n=3 biological replicates, >150 cells quantified per biological replicate, Kruskal-Wallis test with Dunn’s multiple comparison tests. c, Histograms representing cell cycle profiles following siRNA knockdown of 6 candidate DDR+CIN genes in A549 (left) and H1994 (right) cells, using 2 sets of different siRNAs, n=3 biological repeats, 2-way ANOVA with Sidak corrections. d, Driver mutation distribution of FAT1, and HR-related genes (ATM-CHEK2, ATR-CHEK1, and members of FA/BRCA pathway) in the TRACERx 421 cohort. Source data
Extended Data Fig. 3
Extended Data Fig. 3. FAT1 mutation, copy number loss and hypermethylation are enriched in the TRACERx421 cohort.
a, FAT1 driver mutations are enriched in LUSC tumours in the TRACERx421 LUSC cohort, and mutations are timed early in tumor evolution. b, Graph showing the frequency of FAT1 SCNA loss in the TRACERx 421 cohort. c, GISTIC analysis demonstrating FAT1 genomic loci (4q35.2) SCNA loss is positively selected in both the LUAD and LUSC TRACERx cohort. d, Summary of GISTIC score analysis of LUAD and LUSC TRACERx tumors from Fig. 2b segregated by WGD status. Patients with no WGD and subclonal WGD are included. SCNA loci overlapping with common or rare chromosome fragile sites90,91 were annotated (common fragile sites=blue, rare fragile sites=green). e, FAT1 promoter hypermethylation is enriched in TRACERx LUSC tumors. Notably, FAT1 promoter hypermethylation also co-occurs with FAT1 SCNA loss. f-g, Correlation between FAT1 promoter hypermethylation and expression levels in LUAD (f) and LUSC tumors (g). Source data
Extended Data Fig. 4
Extended Data Fig. 4. FAT1 CRISPR KO cells show reduced RAD51 foci formation post-ionizing.
a, Impact of FAT1 on RAD51/γH2A.X foci formation in polyclonal FAT1 wild-type or CRISPR knockout H1944 cells following 6Gy IR. Cells were irradiated and allowed 1 h to recover. Left, quantification showing RAD51 foci in the presence of 6Gy IR. Red-line = mean. The boxes represent the interquartile range, the lines represent the median and the whiskers range denote 1.5 x interquartile ranges, 2-sided Mann-Whitney test, n=3 biological replicates. Right, representative figures illustrating RAD51/γH2A.X foci following 6Gy IR. Bar = 10 μM. Polyclonal FAT1 CRISPR knockout cells were irradiated and allowed 1h recovery. b, Left, representative figures illustrating RAD51 foci in the presence of 6Gy IR. Scale bar =10 µm. Right: box plots showing FAT1 CRISPR knockout A549 cells displayed a reduction in RAD51 foci formation. The boxes represent the interquartile range, the lines represent the median and the whiskers range denotes 1.5 x interquartile ranges, Dunn’s test, n=3 biological replicates. c, Quantification of 53BP1 foci at various time points post 6h IR irradiation in A549 cells. n=2 biological repeats, over 300 cells were quantified in each condition per time point. Solid line = median, dotted lines = quartile ranges, 2-sided Mann-Whitney tests were carried out between two conditions within the same time point. d, Representative western blot showing cellular fractionation of control and FAT1 CRISPR KO A549 cells. Localization of full-length FAT1 protein and C-terminal isoforms were visualized using a FAT1 antibody targeting the C-terminal of the FAT1 protein. Note the loss of FAT1 full-length and C-terminal (p65) signal in FAT1 KO cells. e, A549 FAT1 KO cells were transfected with the HA-FAT1ICD construct used in Fig. 3b,c. Top, representative western blot showing the level of endogenous FAT1 and HA-FAT1ICD construct in A549 cells following 6Gy IR. Levels of KAP1/TRIM28 phosphorylation, γH2A.X, and ubiquitination of γH2A.X are not affected. Bottom, representative figures illustrating RAD51 foci formation in the presence of 6Gy IR, with or without overexpression of HA-FAT1ICD. Scale bar =10 µm. HD, homozygous deletions; LOH, loss of heterozygosity. Source data
Extended Data Fig. 5
Extended Data Fig. 5. FAT1 KO A549 cells display mild sensitivity towards hydroxyurea, cisplatin and Olaparib.
a, Comparison of growth rate trajectories of CTRL, FAT1 and BRCA1 knockdown in HCT116-iRFP cells in the presence and absence of Olaparib. b, Representative images and quantification of clonogenic assays (left: hydroxyurea, replication stress inducer; middle: Olaparib, PARP inhibitor; right: cisplatin, DNA crosslinker). c-d, Genomics England mutational signature analysis showing the signature proportion (left) and signature count (right) of the mutational profile of COSMIC ID6 (c) and SBS3 (d) mutational signatures, both dependent on indels as a result of end-joining activity. Source data
Extended Data Fig. 6
Extended Data Fig. 6. FAT1 loss results in chromosomal instability in lung cancer cells.
a, Transient FAT1 siRNA knockdown induces the formation of 53BP1 nuclear bodies in T2P cells. The boxes represent the interquartile range, the lines represent the median and the whiskers range denotes 1.5 x interquartile ranges, Dunn’s test, red bar = mean, n=3 biological replicates. Scale bar =10 µm. b, Transient FAT1 siRNA significantly increases the number of lagging chromosomes per cell after replication stress (left, centromeric; right, acentric), Dunn’s test. Over 100 mitotic cells were scored across 3 biological replicates. Red bar = mean. c, Representative metaphase spreads of FAT1 WT and KO A549 cells after 24 hours of aphidicolin treatment. Scale bar = 5µM d, Metaphase chromosome number following transient FAT1 knockdown in H1944 cells. A significant increase in metaphase chromosome number is observed in H1944 cells following FAT1 knockdown. N=3 biological repeats, red bar = mean. 2-sided Welch’s T-test. e, Mitotic error rate in PC9 cells following transient FAT1 knockdown in PC9 cells. one-way ANOVA, N=4 biological repeats, mean±SEM. f, Western blot showing FAT1 knockdown efficiency in PC9 cells. FANCD2 monoubiquitylation and γH2A.X, or expression level of E2F7 are not significantly affected by FAT1 ablation. g, FAT1 knockdown leads to more replication fork stalling in genome-doubled PC9 cells. >600 forks were counted across 3 biological repeats, 2-sided Paired T-test, scale bar =20 µM. h–j, FAT1 knockdown significantly reduces interphase FANCD2 foci (h, histogram) and mitotic FANCD2 foci (i and j, histogram and representative image, respectively) despite the increased rate of fork collapse. The boxes represent the interquartile range, black horiziontal bar represent the median and the whiskers range denotes 1.5 x interquartile ranges, red line= mean, N=3 biological replicates, >1200 interphase and >120 mitotic cells scored per condition, Dunn’s test. Source data
Extended Data Fig. 7
Extended Data Fig. 7. FAT1 loss promotes WGD and multinucleation.
a, Proportion of FAT1 driver mutations in genome-doubled TRACERx421 tumors. Fisher’s Exact Test, p=0.179. b, FAT1 CRISPR KO leads to elevated MCM7 reloading rate >6N in TP53 mutant PC9 cells, 2-sided Paired T-test, mean±SD, n=3 biological replicates. c, FAT1 ablation leads to elevated MCM7 reloading rate >4N in TP53 WT RPE1 cells with transient FAT1 siRNA transfection, mean±SEM, 2-sided paired T-test, n=3 biological repeat. d,e, Cyclin B1 levels in the G2/M population following CTRL or FAT1 depletion in TP53 WT RPE1 cells. The histogram in d shows no difference in G2/M cyclin B1 levels, mean±SEM, 2-sided paired T-test, n=3 biological repeats. The representative dot plots in e show cyclin B1 levels of the G2 population. f, Nocodazole treatment arrests PC9 cells at mitosis and causes endoreplication (EdU positive cells >6N). FAT1 knockdown does not significantly further increase EdU-positive cells >6N when treated with nocodazole, mean±SEM, 2-sided paired T-Test, n=4 biological replicates. g, Live cell tracking data showing mitotic error rate of RPE1-TERT-FUCCI cells. 2 different FAT1 siRNAs produced a significant increase in mitotic error rate. One-way ANOVA with Sidak correction, mean±SD, n=3 biological repeats. h, Quantification of fixed microscopy images showing that FAT1 siRNA knockdown increases the rate of multinucleated U2OS cells, with or without replication stress induced with hydroxyurea. Left, multinucleation was quantified using phalloidin as a marker for cell boundaries and nuclear envelope stain emerin was used to mark the number of nuclei per cell. Mean±SD, 2-sided paired T-test, Biological repeats: n=4 without damage, n=6 with HU. Right, representative image of cells, scale bar = 10 μM, white arrows = multinucleated cells. i, Quantification of fixed microscopy images showing FAT1 knockdown elevates EdU incorporation rate in multinucleated TP53 KO RPE1-TERT cells, but not in the TP53 WT counterpart. Following aphidicolin-induced replication stress, FAT1 depletion increases EdU incorporation rate in both TP53 WT and TP53 KO cells, mean±SD, one-way ANOVA with Holm-Sidak correction. Biological repeats, no damage n=3; Ctrl siRNA with aphidicolin n=3, FAT1 siRNA with aphidicolin n=4. Source data
Extended Data Fig. 8
Extended Data Fig. 8. FAT1 loss results in nuclear shape deformation and exacerbates targeted therapy resistance.
a, Nuclear morphometric measurements of PC9 cells following CTRL and FAT1 siRNA knockdown. Genome-doubled PC9 cells were treated for 24h with replication stress inducer aphidicolin. Z-project images were segmented and analysed for the difference in nuclear morphology. More than 1680 cells were analysed per condition over 3 biological repeats. 2-sided Mann-Whitney test, p<0.001. b, Live-cell imaging demonstrated higher chromatin bridge formation rate following transient FAT1 siRNA knockdown in RPE1-TERT cells. In addition, the daughter cells are more likely to display nuclear shape deformation morphologies following chromatin bridge formation when FAT1 is depleted. c, Mitotic outcomes of RPE1-TERT cells monitored after initial nuclear shape deformation. Among FAT1 depleted cells, those cells with nuclear shape deformation were less likely to undergo normal mitotic segregation in the following mitosis. 60x magnification live cell microscopy performed using 5 minute intervals, 25 z-steps. scale bar = 5 μM, Chi-squared test. At least 50 mitotic events were tracked per condition over 8 biological repeats. d, Estimation of the effect of FAT1 depletion on mitotic timing in RPE1-TERT-FUCCI cells. At least 100 cells were scored per siRNA knockdown across 3 biological repeats. Cells were imaged at 5-minute intervals over 12 h. Black bar = mean, Kruskal–Wallis test with False Discovery Rate Correction. e, IC90 determination of osimertinib treatment in PC9 cells. f, Experimental flowchart showing the generation of osimertinib-resistant PC9 subclones. g,h, Graphs demonstrating the impact of FAT1 CRISPR KO on the acquisition of osimertinib resistance, as indicated by clone survival (g; 2-sided Mann-Whitney Test) and the number of long-term derivation of resistant subclones (h; Fisher’s exact test). i, Among Osimertinib-resistant subclones, FAT1 CRISPR KO cells exhibited significantly variable DNA ploidy compared with non-targeting controls. 2-sided Welch’s T-test, non-targeting = 6 clones, FAT1 KO = 31 clones. Source data
Extended Data Fig. 9
Extended Data Fig. 9. FAT1 loss results in dysregulation of YAP1 nuclear localization.
a,b Transient siRNA depletion of FAT1 increases the relative YAP1 nuclear localization ratio in RPE1-FUCCI cells (a; PTEMF fixation) and T2P cells (b (left panel); PFA fixation). Scale bars =10 µm. Representative images are shown. The right panel in b shows quantification of the results in T2P cells. Red bar =mean, 2-sided Mann-Whitney test. c, Transient siRNA depletion of FAT1 and LATS1 does not consistently alter the phosphorylation level of YAP1 in RPE1 and T2P cells. d, Plot showing the incidences of amplification and deep deletions of Hippo pathway members in the TRACERx 421 LUSC cohort. The effectors TEAD4 and WWTR1/TAZ are amplified in >10% and >35% of cases, respectively. e, The localization of the HA-epitope tag does not affect the ability to repress TEAD reporter transcriptional activity. Left, Scheme showing the location of the HA-epitope tag in different FAT1 expression constructs. The HA-epitope tag was located either at the N terminus or internally within the FAT1 construct. Right, Histogram showing normalized TEAD transcriptional activity upon overexpression of different FAT1 construct. The edge of histograms denotes the mean values, One-way ANOVA with Holm-Sidak multiple comparisons test, for each condition >95 cells were scored across 3 biological repeats. Source data
Extended Data Fig. 10
Extended Data Fig. 10. Loss of LATS2 is enriched in the TRACERx LUSC cohort.
a, Representative western blot following LATS1/2 knockdown in the U2OS-AsiSI DIvA system reveals that DNA damage markers such as γH2A.X and phospho-KAP1 are activated proficiently upon damage. b, Middle, representative gel showing that transient knockdown of LATS2, but not LATS1, induces an illegitimate repair product in U2OS-AsiSI DIvA cells. PCR products generated from the legitimate repair product were used as the loading control (bottom). n=3 biological repeats. c, Plots of GISTIC scores illustrating that the SCNA loss of the LATS2 genomic loci (13q12.11) is positively selected in the LUSC but not the LUAD TRACERx421 cohort. Red lines denote q value <0.2. d,e, Histograms representing cell cycle profiles following loss of FAT1, YAP1 or combined loss of both FAT1 and YAP1 by siRNA in U2OS-AsiSI cells (d) and A549 FAT1 WT/KO cells (e), n=3 biological repeats, one-way ANOVA with Sidak corrections. f, Histogram quantifying the percentage of FAT1 WT or KO A549 cells with lagging chromosomes after aphidicolin treatment following transient depletion of YAP1 using RNAi, mean±SD, one-way ANOVA with Holm-Sidak multiple correction, biological repeats: FAT1 WT =3, FAT1 KO =4. g, Representative western blot showing YAP1 and FAT1 knockdown efficiency in the RPE1-FUCCI and A549 cells. h, Proposed model showing potential interaction between FAT1 and the Hippo pathway. Source data

References

    1. Steele, C. D. et al. Signatures of copy number alterations in human cancer. Nature606, 984–991 (2022). - PMC - PubMed
    1. Drews, R. M. et al. A pan-cancer compendium of chromosomal instability. Nature606, 976–983 (2022). - PMC - PubMed
    1. Jamal-Hanjani, M. et al. Tracking the evolution of non-small-cell lung cancer. N. Engl. J. Med.376, 2109–2121 (2017). - PubMed
    1. Bakhoum, S. F. & Cantley, L. C. The multifaceted role of chromosomal instability in cancer and its microenvironment. Cell174, 1347–1360 (2018). - PMC - PubMed
    1. Gemble, S. et al. Genetic instability from a single S phase after whole-genome duplication. Nature604, 146–151 (2022). - PMC - PubMed

LinkOut - more resources