

The wrapped Rama distribution
- PMID: 39738751
- PMCID: PMC11686034
- DOI: 10.1038/s41598-024-83436-x
The wrapped Rama distribution
Abstract
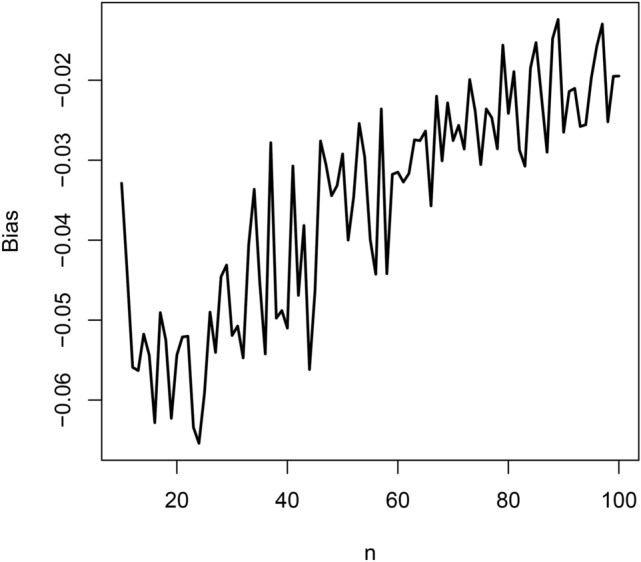
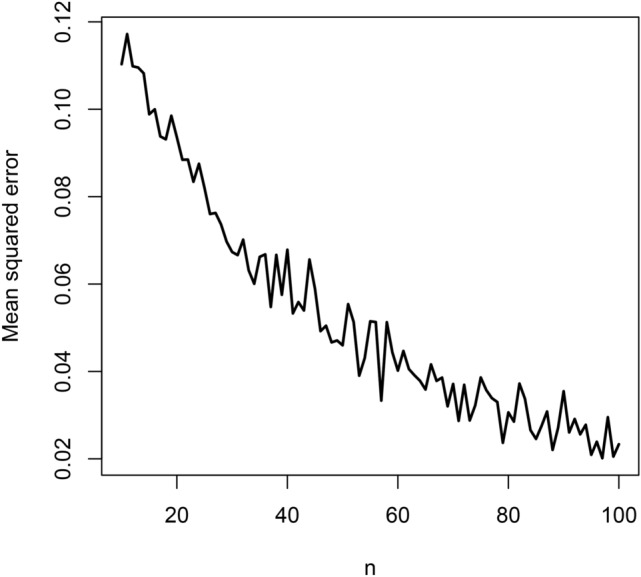
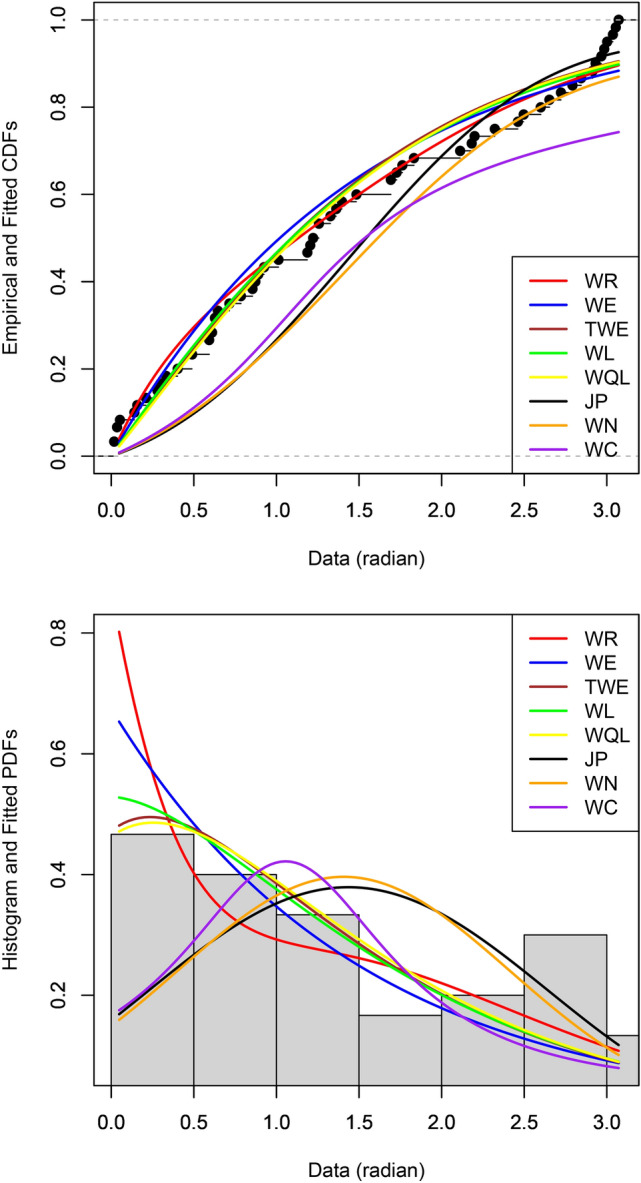
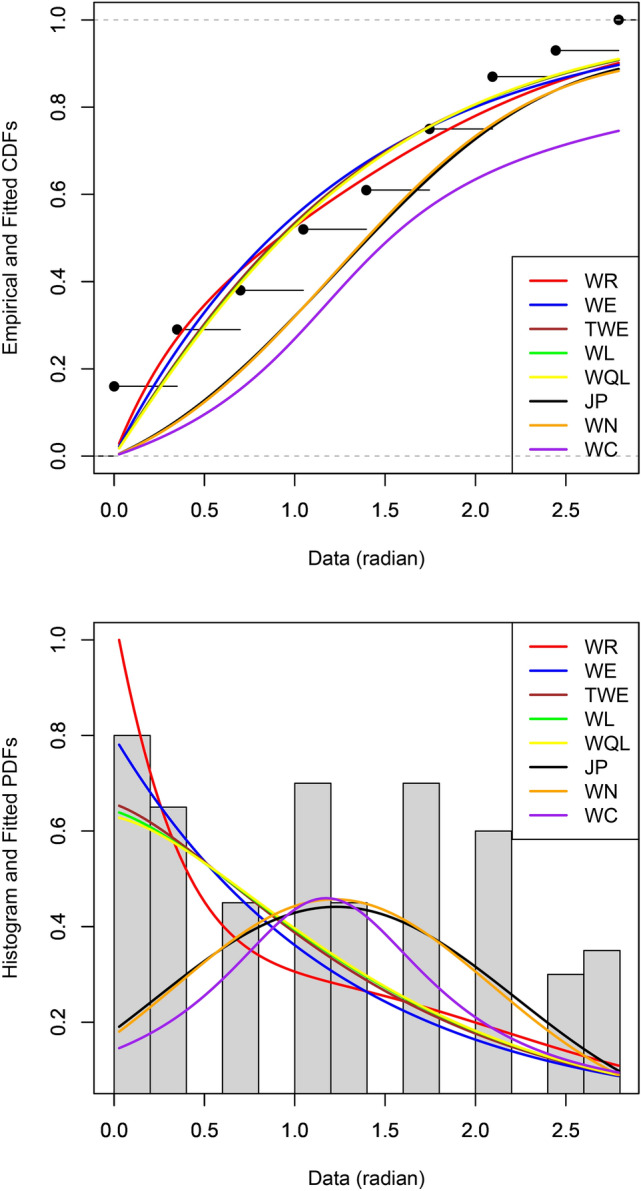
A new one-parameter distribution is proposed for circular data based on wrapping. Most distributions constructed via wrapping do not yield elementary expressions for their mathematical properties. Yet the new distribution yields elementary expressions for all of its mathematical properties. Better fits of the new distribution over the three-parameter distribution due to Jones and Pewsey10 and six other wrapped distributions including four that have two parameters each are shown for at least two data sets. Better fits were assessed in terms of probability plots, density plots, values of Akaike information criterion and values of Bayesian information criterion.
Keywords: Circular data; Maximum likelihood; Trigonometric moments.
© 2024. The Author(s).
Conflict of interest statement
Declarations. Competing interests: Both authors declare no conflicts of interest. Ethical approval: Not applicable. Consent to participate: Not applicable. Consent to publish: Both authors gave explicit consent to publish this manuscript.
Figures


References
-
- Akaike, H. A new look at the statistical model identification. IEEE Transactions on Automatic Control19, 716–723 (1974).
-
- Alhyasat, K. M., Ibrahim, K., Al-Omari, A. & Abu Bakar, M. A. Extended Rama distribution: Properties and applications. Computer Systems Science and Engineering39, 55–67 (2021).
-
- Al-Khazaleh, A. M. H. and Al-Khazaleh, S. (2019). On wrapping of quasi Lindley distribution. Mathematics, 7, article number 930.
-
- Casella, G. & Berger, R. Statistical Inference (Duxbury Press, New York, 2001).
-
- Edith, U. U., Ebele, T. U. & Henrietta, A. I. A two-parameter Rama distribution. Earthline Journal of Mathematical Sciences2, 365–382 (2019).
LinkOut - more resources
Full Text Sources
