. 2024 Dec 30;7(1):1712.
doi: 10.1038/s42003-024-07328-6.

RBM4-mediated intron excision of Hsf1 induces BDNF for cerebellar foliation

Affiliations

RBM4-mediated intron excision of Hsf1 induces BDNF for cerebellar foliation

Chiu-Lun Shen et al. Commun Biol. .

Abstract

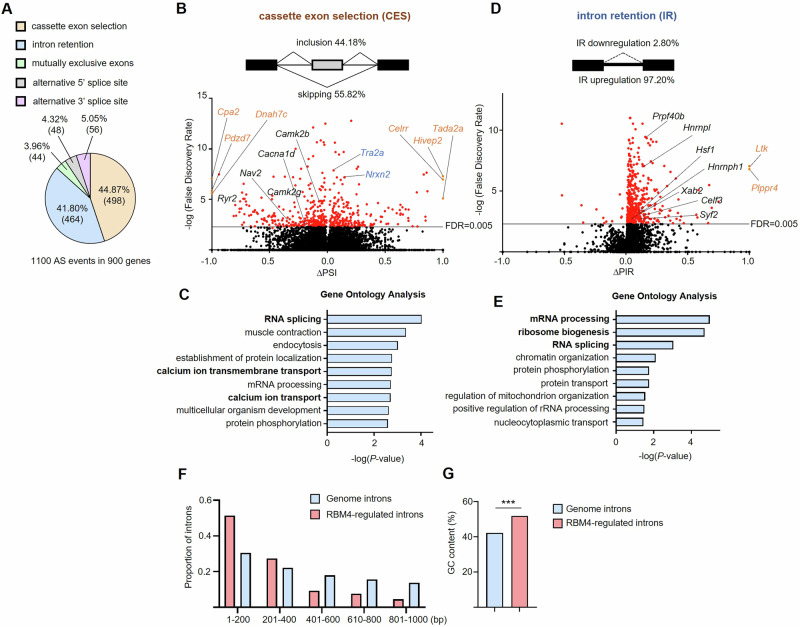
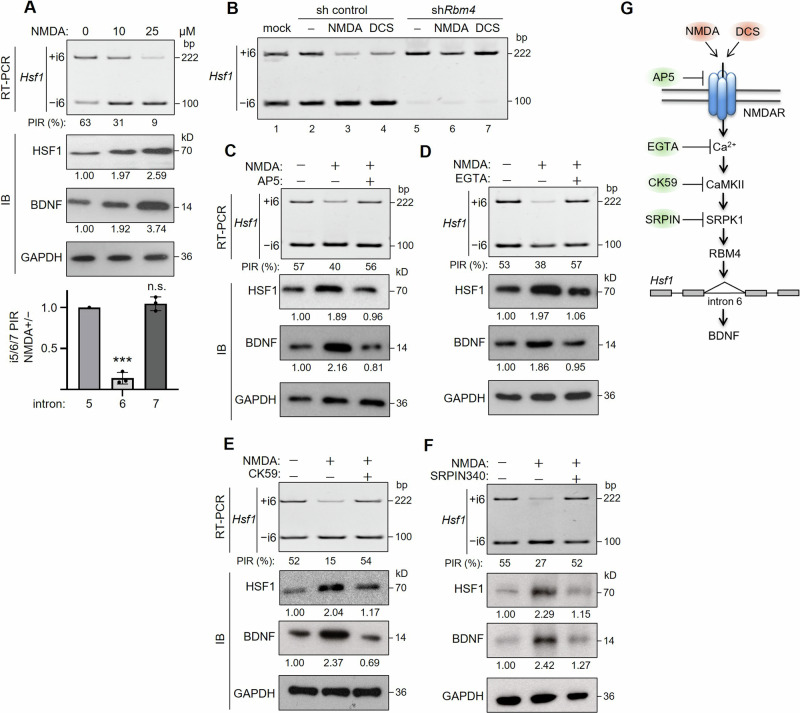
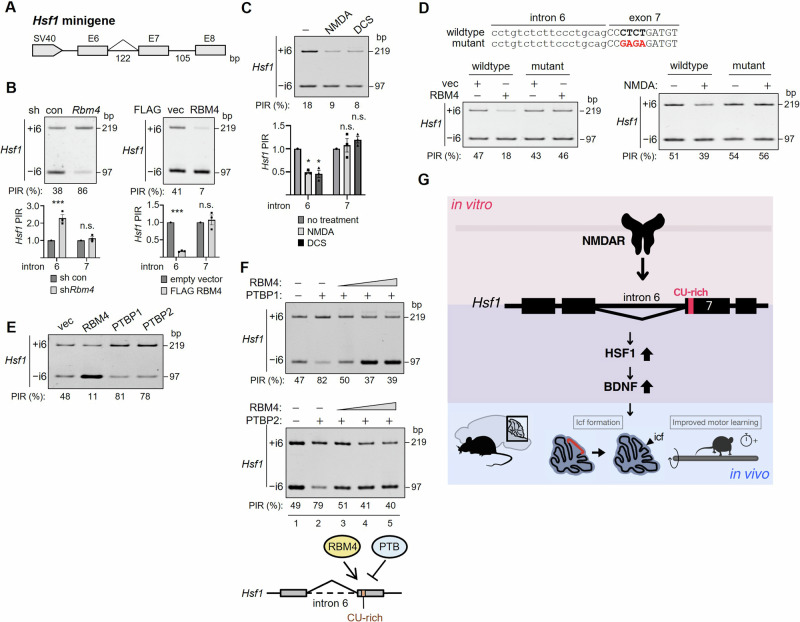
Brain-derived neurotrophic factor (BDNF) plays important roles in brain development and neural function. Constitutive knockout of the splicing regulator RBM4 reduces BDNF expression in the developing brain and causes cerebellar hypoplasia, an autism-like feature. Here, we show that Rbm4 knockout induced intron 6 retention of Hsf1, leading to downregulation of HSF1 protein and its downstream target BDNF. RBM4-mediated Hsf1 intron excision regulated BDNF expression in cultured granule cells. Ectopic expression of HSF1 restored cerebellar foliation and motor learning of Rbm4-knockout mice, indicating a critical role for RBM4-HSF1-BDNF in cerebellar foliation. Moreover, N-methyl-D-aspartate receptor (NMDAR) signaling promoted the expression and nuclear translocation of RBM4, and hence increased the expression of both HSF and BDNF. A short CU-rich motif was responsible for NMDAR- and RBM4-mediated intron excision. Finally, RBM4 and polypyrimidine tract binding (PTB) proteins play antagonistic roles in intron excision, suggesting a role for splicing regulation in BDNF expression.


Conflict of interest statement

Competing interests: The authors declare no competing interests.

Figures

Fig. 1
Fig. 1. RNA-seq analysis of Rbm4dKO embryonic brain.
A Pie chart shows alternative splicing events identified in the E13.5 Rbm4dKO brain. The percentage and event number of each category are indicated. B Schematic depicts cassette exon selection (CES). Volcano plot of CES: the x-axis represents the difference of percent spliced in (∆PSI: PSIRbm4dKO-PSIWT); the y-axis indicates the negative log10 transformation of false discovery rate (FDR). Red dots represent differentially expressed CES events with statistical significance (FDR < 0.005). Transcripts indicated were subjected to RT-PCR analysis (see Fig. 2) (black, exon skipping; blue, exon inclusion). Orange indicates the transcripts with a ∆PSI value of 1.0 or −1.0. C Gene Ontology analysis of the CES category. The x-axis represents the negative log10 transformation of the P-value; the y-axis indicates the top-ranked terms in the CES category. D Schematic depicts intron retention (IR). Volcano plot of the IR category: the x-axis indicates the difference in percent intron retention (∆PIR: PIRRbm4dKO-PIRWT); the y-axis is the same as in (B). Red dots represent differentially expressed IR events with FDR < 0.005. Orange indicates the transcripts with a ∆PIR value of 1.0. E Gene Ontology analysis of the IR category; the x-axis is the same as in (C); the y-axis indicates the top-ranked terms in the IR category. F Intron length distribution comparison between genome introns (n = 490290) and RBM4-regulated introns (n = 399). G The GC content of genome introns and RBM4-regulated introns. Bars represent average ± SEM (***P < 0.001).
Fig. 2
Fig. 2. Rbm4 knockout affects cassette exon selection and causes intron retention.
A RT-PCR of selected RBM4 targets in the CES category from E13.5 wild-type (WT) and Rbm4dKO (KO) brains. Bar graphs show relative PSI (+e/total); WT was set to 1 (n = 3). GAPDH was used as a loading control. B RT-PCR of selected RBM4 targets in the IR category from E13.5 brains. Bar graphs show relative PIR (+i/total); WT was set to 1 (n = 3). P-values were determined using the Student’s t-test. *P < 0.05, **P < 0.01, ***P < 0.001. The number in parentheses represents basepair (bp). C Immunoblotting shows three selected proteins (HSF1, hnRNPH1, hnRNP L) in E13.5 WT and KO brain lysates. The level of examined proteins was normalized to GAPDH. Numbers below the blots indicate relative protein level (WT was set to 1; n = 3). P-values are listed in Supplementary Data 2.
Fig. 3
Fig. 3. RBM4 promoted intron 6 excision of Hsf1 leads to Bdnf transactivation.
A RT-PCR of Hsf1 and immunoblotting of indicated proteins in WT and KO whole brain or cerebellar lysates at different developmental stages. For splicing, PIR (%) was indicated below the gel (average from three experiments) and in the dot graph (data of three experiments). For immunoblotting, the level of each protein was normalized to GAPDH. Numbers below the blots show relative protein levels. For HSF1, E13.5 WT brain was set to 1. For BDNF, E18.5 WT cerebellum was set to 1. B Bar graph shows relative KO/WT PIR of Hsf1 introns 5/6/7 at indicated time points. C RT-PCR of Hsf1 and immunoblotting of indicated proteins were performed in control (con) or Rbm4-targeting shRNA-transfected GCs. PIR (%) and relative protein level were as in (A). KD: knockdown. D RT-PCR and immunoblotting of mock (vec) or FLAG-RBM4-overexpressed GCs were performed as in (C). OE: overexpression. E Immunoblotting of indicated proteins was performed in control (con) or HSf1 shRNA-transfected GCs. Relative protein level was shown below the blots. F Mock (lane 1) or RBM4 knockdown GCs (lanes 2 and 3) were transfected with the empty (−) or FLAG-HSF1 expression vector. RT-PCR and immunoblotting were performed and relative RNA/protein expression levels were indicated. Lane 1 was set to 1. G Schematic shows that RBM4 promotes BDNF expression via removing retained intron 6 from Hsf1.
Fig. 4
Fig. 4. HSF1 rescues the foliation defects of the Rbm4 knockout cerebellum.
A Schematic diagram shows the construct of the DsRed (Con) and HSF1-DsRed fusion, and the procedure of in utero electroporation (IUE). The empty or HSF1-DsRed plasmid was electroporated into the lateral ventricle of the E15.5 Rbm4dKO brain. Newborn pups (Rbm4dKOCon and Rbm4dKOHSF1) were sacrificed at P0 or P30. B The expression levels of BDNF mRNA and indicated protein were evaluated in the P0 cerebellum of wild-type (WT), Rbm4dKO, Rbm4dKOCon, and Rbm4dKOHSF1. C Hematoxylin and eosin staining were performed in P0 and P30 cerebellums of mice as indicated. Arrowhead indicates icf. D The icf depth was measured in the P30 cerebellum. Bars represent average ± SEM (n = 3, ***P < 0.001). E For rotarod analysis, each mouse (6-week-old) was trained on the rod for 60 s at low constant speed (Supplementary Fig. 3C) before proceeding to the tests with an accelerating rotational speed from 4 to 40 rpm over a period of 300 s. Bar graph shows the average latency to fall (s) (10 mice for each group); ***P < 0.001; **P < 0.01.
Fig. 5
Fig. 5. NMDA receptor signaling regulates RBM4-mediated intron excision of Hsf1.
A GCs were treated with different concentrations of NMDA for one hour. RT-PCR of Hsf1 and immunoblotting of HSF1, BDNF, and GAPDH were performed. PIR (%) and relative protein level were measured as in Fig. 3A. Bar graph shows Hsf1 introns 5/6/7 PIR of 25 µM NMDA-treated (+) relative to mock-treated (−) cells (***P < 0.001; n.s. no significance). B GCs were transfected with the control or Rbm4 shRNA followed by NMDA (25 µM) or DCS (50 μM) treatment. RT-PCR of Hsf1 was performed. Lane number is indicated below the gel. CF GCs were mock-treated (−) or pre-treated with AP5 (25 μM), EGTA (2 mM), CK59 (500 nM) or SRPIN340 (30 µM) followed by NMDA treatment. RT-PCR, immunoblotting, and measurement of PIR (%) and relative protein levels were performed as in (A). G Schematic diagram shows that NMDAR signaling modulates RBM4-mediated Hsf1 intron 6 splicing. Activators and inhibitors of NMDAR signaling pathways are indicated in red and green ovals, respectively.
Fig. 6
Fig. 6. NMDAR signaling stabilizes RBM4 and promotes its nuclear translocation.
A GCs were treated with different concentrations of NMDA as in Fig. 5A. Immunoblotting of RBM4 protein and RT-PCR of Rbm4a/b mRNA were performed. Folds of RBM4 induction (normalized to GAPDH) were indicated below the blot (n = 3). B GCs were sequentially treated with AP5 or CK59 and NMDA as in Fig. 5C, E. Immunoblotting of RBM4 and GAPDH was performed. Induction folds were indicated as in (A). C Schematic diagram shows the S309A mutant of RBM4. GCs were transiently transfected with the vector expressing FLAG-RBM4 (wild-type or SA) followed by mock or NMDA treatment. Immunoblotting and fold changes were as in (A). D GCs were mock or NMDA treated alone or sequentially treated with AP5 or CK59 and NMDA. Immunofluorescence was performed using anti-RBM4. Cells were counterstained with DAPI. The scale bar represents 25 μm. Insets show enlarged images of a representative cell. Bar graph shows the relative ratio of RBM4 in the nucleus (N) vs. the whole cell (T) (average ± SEM, ***P < 0.001). For each group, ~60 cells were measured. Mock was set to 1. E Subcellular fractionation was performed in mock or NMDA-treated GCs. Immunoblotting was performed using antibodies against RBM4, Lamin A/C, and GAPDH. F GCs were transfected with the vector of FLAG-RBM4 (WT or SA) followed by mock or NMDA treatment. Immunofluorescence was performed using anti-FLAG. No signal was detected in untransfected cells (top panels), indicating the specificity of anti-FLAG. Scale bar, inset, and bar graph were as in (D). For the bar graph, mock-treated RBM4-transfection was set to 1. G Rbm4dKO GCs were mock-transfected or transfected with the FLAG-RBM4 (WT or SA) vector. RT-PCR and immunoblotting of indicated RNA/protein were performed. Relative Bdnf expression levels were indicated (n = 3); WT was set to 1.
Fig. 7
Fig. 7. RBM4 regulates Hsf1 intron excision via a CU-rich motif and antagonizes the negative effect of PTBP1/2.
A Schematic of the Hsf1 minigene spanning exon 6 to exon 8 of mouse Hsf1. SV40 denotes the promoter. B The Hsf1 minigene and the Rbm4 shRNA (left panel) or FLAG-RBM4 (right panel) vectors were co-transfected into GCs. RT-PCR was performed to detect intron 6 retention/excision. PIR (%) was indicated below the gels (n = 3); PIR measurement was the same in the following panels. Bar graphs show relative PIR of introns 6/7; con shRNA or empty vector was set to 1. C The Hsf1 minigene was transfected into GCs followed by NMDA or DCS treatment. Bar graph for relative PIR is shown as in (B). D Diagram shows the mutant Hsf1, of which nucleotides 3–6 of exon 7 were mutated. GCs were transfected with the wild-type or mutant minigene together with the empty or FLAG-RBM4 vector (left panel) or followed by NMDA treatment (right panel). E The Hsf1 minigene was co-transfected with the empty vector (vec) or vector expressing RBM4, PTBP1, or PTBP2. F The Hsf1 minigene was transfected with the vector of PTBP1 or PTBP2 alone (lane 2) or together with increasing amounts of the RBM4 vector (lanes 3–5). Lane 1 contained the Hsf1 minigene only. Model shows that RBM4 and PTB proteins may competitively regulate Hsf1 intron 6 splicing via a CU-rich motif. G Conclusion model: Rbm4 knockout caused IR of Hsf1 and hence reduced HSF1 protein level. In vitro results demonstrated that RBM4 promotes intron excision of Hsf1 via a CU-rich element and hence increased HSF1 and subsequent BDNF expression, and that NMDAR signaling potentiates RBM4 in splicing regulation. In vivo, evidence revealed that HSF1 rescues the foliation defects and motor learning ability of the Rbm4dKO cerebellum.

Similar articles

Cited by

References

    1. Baralle, F. E. & Giudice, J. Alternative splicing as a regulator of development and tissue identity. Nat. Rev. Mol. Cell Biol.18, 437–451 (2017). - PMC - PubMed
    1. Montes, M., Sanford, B. L., Comiskey, D. F. & Chandler, D. S. RNA splicing and disease: animal models to therapies. Trends Genet.35, 68–87 (2019). - PMC - PubMed
    1. Schwartz, P. M., Borghesani, P. R., Levy, R. L., Pomeroy, S. L. & Segal, R. A. Abnormal cerebellar development and foliation in BDNF-/- mice reveals a role for neurotrophins in CNS patterning. Neuron19, 269–281 (1997). - PubMed
    1. Licatalosi, D. D. et al. Ptbp2 represses adult-specific splicing to regulate the generation of neuronal precursors in the embryonic brain. Genes Dev.26, 1626–1642 (2012). - PMC - PubMed
    1. Raj, B. & Blencowe, B. J. Alternative splicing in the mammalian nervous system: recent insights into mechanisms and functional roles. Neuron87, 14–27 (2015). - PubMed

MeSH terms

Substances

LinkOut - more resources