

Cervicothoracic volumetric bone mineral density assessed by opportunistic QCT may be a reliable marker for osteoporosis in adults
- PMID: 39738830
- PMCID: PMC11882693
- DOI: 10.1007/s00198-024-07373-1
Cervicothoracic volumetric bone mineral density assessed by opportunistic QCT may be a reliable marker for osteoporosis in adults
Abstract
This study aimed to validate the correlation between volumetric bone mineral density in the cervicothoracic and lumbar spine using measurements from opportunistic CT scans. The bone density assessment proved feasible, allowing us to propose optimal cut-off values for diagnosing osteoporosis and predicting vertebral fractures in the cervical and thoracic spine.
Objectives: To investigate the performance of cervicothoracic volumetric bone mineral density (vBMD), obtained through opportunistic quantitative computed tomography (QCT), in discriminating patients with/without osteoporosis and with/without vertebral fractures (VFs), using lumbar vBMD as the reference.
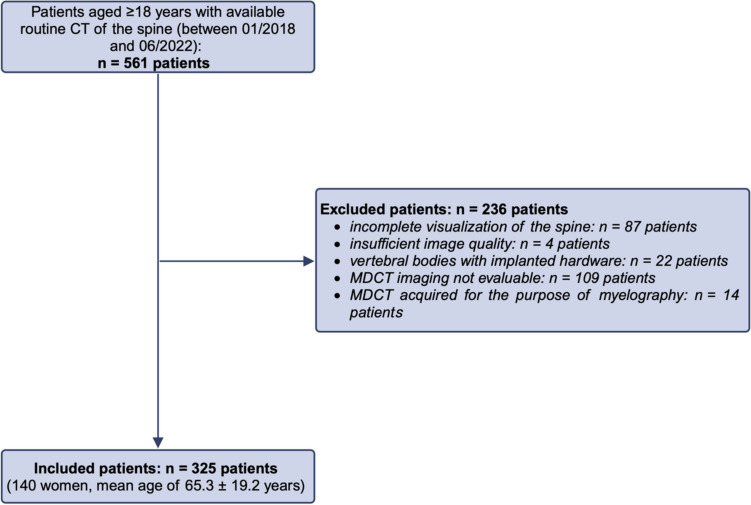
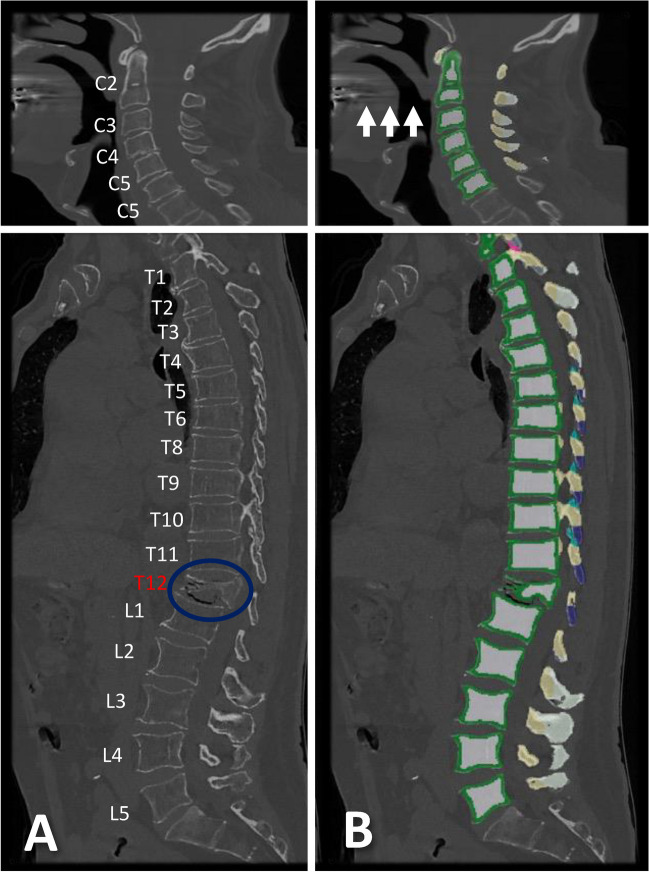
Methods: Three hundred twenty-five patients (65.3 ± 19.2 years, 140 women) with routine non-contrast or contrast-enhanced multi-detector CT (MDCT) scans were included. Trabecular vBMD was automatically extracted from each vertebra using a convolutional neural network (CNN)-based framework (SpineQ software v1.0) with asynchronous calibration and contrast phase correction. The correlations of vBMD between each vertebra spanning C2-T12 and the averaged lumbar spine (L1-L3, or L4 and L5) vBMD values were analyzed, considering fracture status and degeneration. Vertebra-specific linear regression equations were used to approximate lumbar vBMD at the cervicothoracic spine.
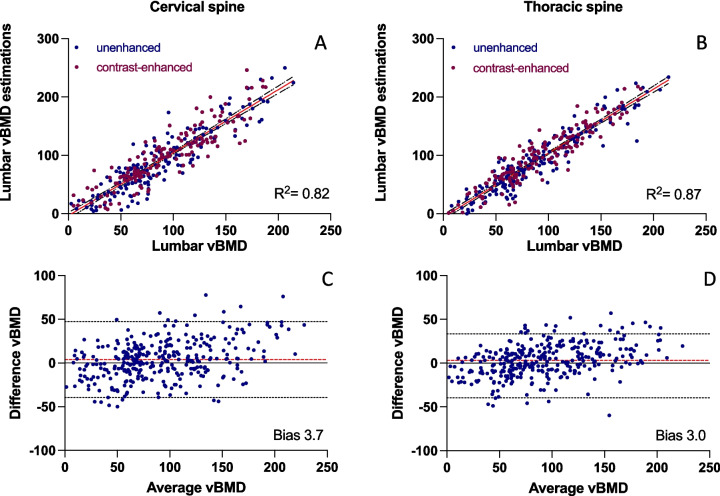
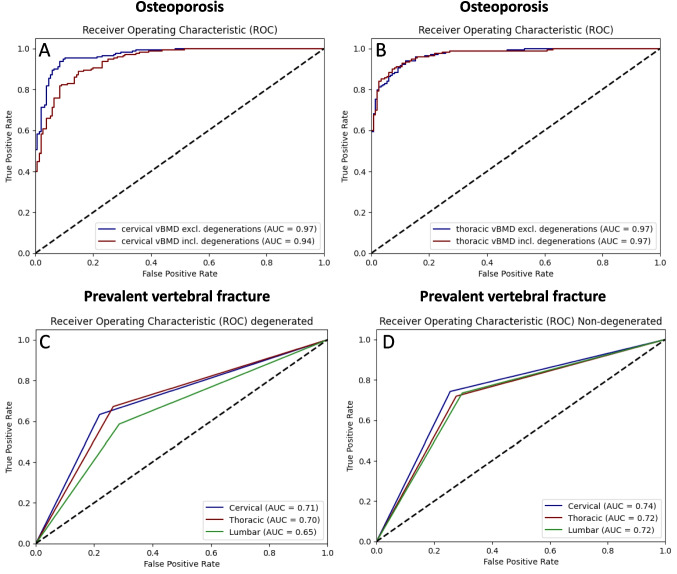
Results: Cervicothoracic vBMD correlated well with lumbar vBMD (r = 0.79), with significant improvement after excluding degenerated vertebrae (p < 0.05; r = 0.89), except for C7-T3 and T9. Cervical (AUC = 0.94) and thoracic vBMD (AUC = 0.97) showed strong discriminatory ability for osteoporosis (vBMD < 80 mg/cm3). Excluding degenerated vertebrae at the cervical spine increased the AUC to 0.97. Cervical and thoracic vBMD (AUC = 0.74, AUC = 0.72) were comparable to lumbar vBMD (AUC = 0.72) in differentiating patients with and without prevalent VFs. Trabecular vBMD < 190 mg/cm3 for the cervical spine and < 100 mg/cm3 for the thoracic spine were potential indicators of osteoporosis, similar to < 80 mg/cm3 at the lumbar spine.
Conclusion: Cervicothoracic vBMD may allow for determination of osteoporosis and prediction of VFs.
Keywords: Cervicothoracic vBMD; Quantitative computed tomography (QCT); Trabecular vBMD.
© 2024. The Author(s).
Conflict of interest statement
Declarations. Conflicts of interest: None.
Figures


Similar articles
-
Proposed diagnostic volumetric bone mineral density thresholds for osteoporosis and osteopenia at the cervicothoracic spine in correlation to the lumbar spine.Eur Radiol. 2022 Sep;32(9):6207-6214. doi: 10.1007/s00330-022-08721-7. Epub 2022 Apr 6. Eur Radiol. 2022. PMID: 35384459 Free PMC article.
-
Level-Specific Volumetric BMD Threshold Values for the Prediction of Incident Vertebral Fractures Using Opportunistic QCT: A Case-Control Study.Front Endocrinol (Lausanne). 2022 May 20;13:882163. doi: 10.3389/fendo.2022.882163. eCollection 2022. Front Endocrinol (Lausanne). 2022. PMID: 35669688 Free PMC article.
-
Automated Opportunistic Osteoporosis Screening in Routine Computed Tomography of the Spine: Comparison With Dedicated Quantitative CT.J Bone Miner Res. 2022 Jul;37(7):1287-1296. doi: 10.1002/jbmr.4575. Epub 2022 Jun 15. J Bone Miner Res. 2022. PMID: 35598311
-
[Diagnostics and classification of fractures of the thoracic and lumbar spine in adults : Approach depending on the bone structure].Unfallchirurgie (Heidelb). 2025 Mar;128(3):147-155. doi: 10.1007/s00113-024-01500-7. Epub 2024 Nov 15. Unfallchirurgie (Heidelb). 2025. PMID: 39545990 Review. German.
-
Opportunistic diagnosis of osteoporosis, fragile bone strength and vertebral fractures from routine CT scans; a review of approved technology systems and pathways to implementation.Ther Adv Musculoskelet Dis. 2021 Jul 10;13:1759720X211024029. doi: 10.1177/1759720X211024029. eCollection 2021. Ther Adv Musculoskelet Dis. 2021. PMID: 34290831 Free PMC article. Review.
Cited by
-
Simulated low-dose multi-detector computed tomography: spatial effects on surrogate parameters of bone strength at the proximal femur.Osteoporos Int. 2025 May;36(5):917-928. doi: 10.1007/s00198-025-07467-4. Epub 2025 Apr 5. Osteoporos Int. 2025. PMID: 40186637 Free PMC article.
-
Changes in scanographic bone mineral density in melanoma patients treated with immunotherapy: a new irAE from real-life data.Sci Rep. 2025 Jul 9;15(1):24600. doi: 10.1038/s41598-025-08974-4. Sci Rep. 2025. PMID: 40634374 Free PMC article.
References
-
- Vestergaard P, Rejnmark L, Mosekilde L (2005) Osteoporosis is markedly underdiagnosed: a nationwide study from Denmark. Osteoporos Int 16(2):134–141. 10.1007/s00198-004-1680-8 - PubMed
-
- Ensrud KE (2013) Epidemiology of fracture risk with advancing age. J Gerontol - Ser A Biol Sci Med Sci 68(10):1236–1242. 10.1093/gerona/glt092 - PubMed
-
- Bliuc D, Nguyen ND, Milch VE, Nguyen TV, Eisman JA, Center JR (2009) Mortality risk associated with low-trauma osteoporotic fracture and subsequent fracture in men and women. JAMA 301(5):513–521. 10.1001/jama.2009.50 - PubMed
-
- Schousboe JT (2017) Mortality after osteoporotic fractures: what proportion is caused by fracture and is preventable? J Bone Miner Res 32(9):1783–1788. 10.1002/jbmr.3216 - PubMed
Publication types
MeSH terms
Grants and funding
LinkOut - more resources
Full Text Sources
Medical
Miscellaneous
