. 2024 Dec 30;7(1):1714.
doi: 10.1038/s42003-024-07368-y.

Switching escape strategies in the parasitic ant cricket Myrmecophilus tetramorii

Affiliations

Switching escape strategies in the parasitic ant cricket Myrmecophilus tetramorii

Ryoya Tanaka et al. Commun Biol. .

Abstract

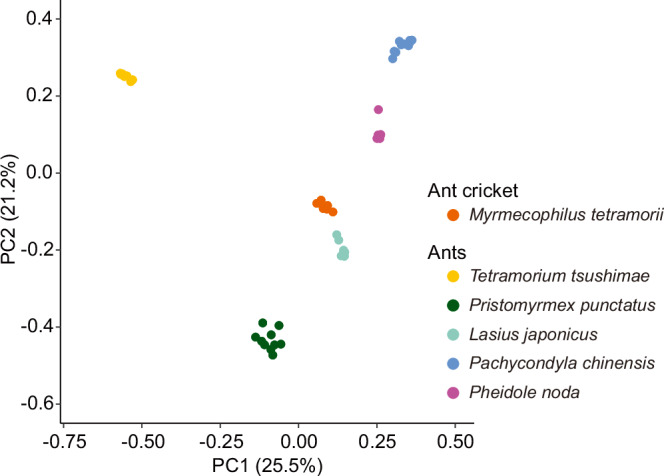
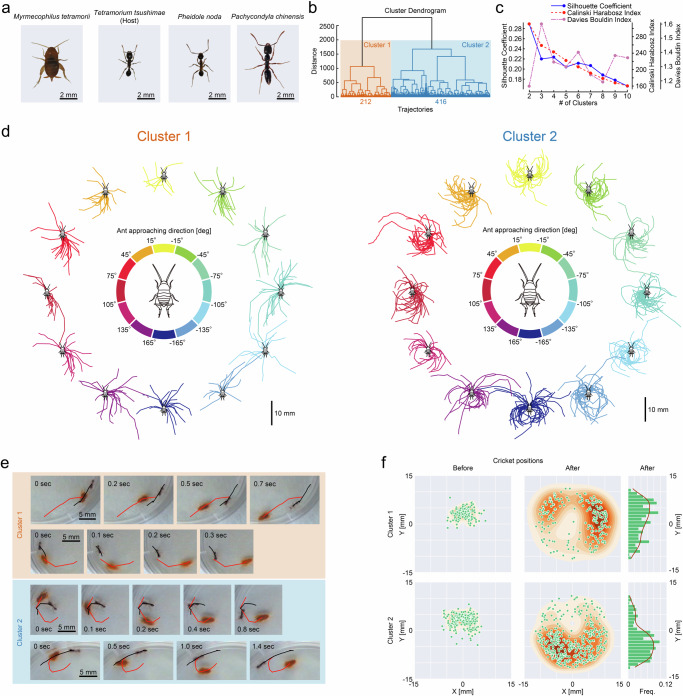
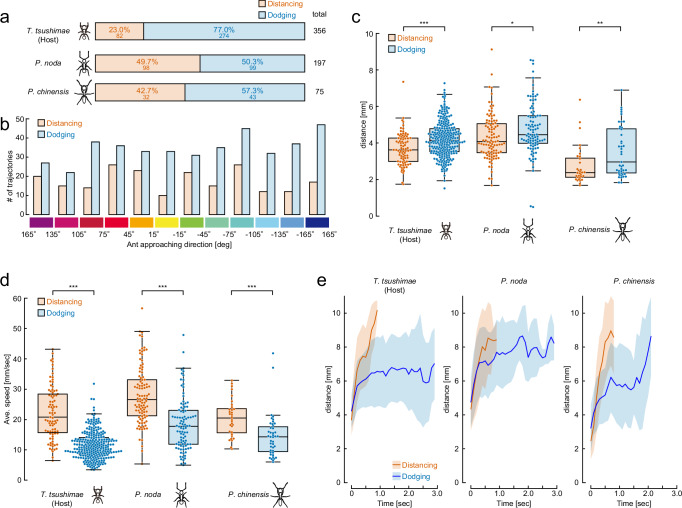
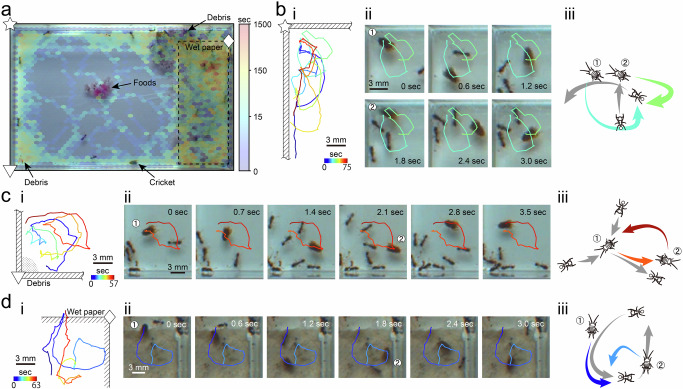
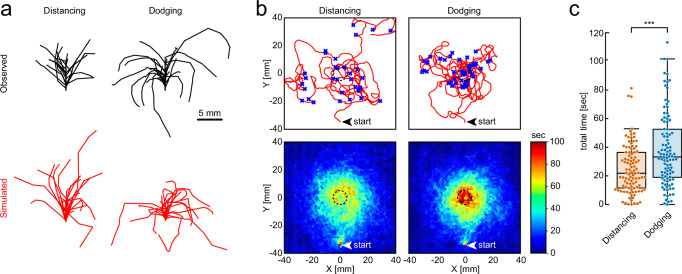
Social parasites employ diverse strategies to deceive and infiltrate their hosts in order to benefit from stable resources. Although escape behaviours are considered an important part of these multipronged strategies, little is known about the repertoire of potential escape behaviours and how they facilitate integration into the host colony. Here, we investigated the escape strategies of the parasitic ant cricket Myrmecophilus tetramorii Ichikawa (Orthoptera: Myrmecophilidae) toward its host and non-host ant workers. We identified two escape strategies with distinct trajectory characteristics by clustering analysis; distancing (defined by high-speed straight movement away from ants for emergency avoidance) and dodging (circular escape movement to get behind ants under low-threat conditions). Interestingly, dodging is dominantly elicited over distancing for host species. Furthermore, our simulations proposed that dodging contributes to efficient foraging while avoiding ants. These results demonstrate that switching to a host-adapted escape strategy facilitates integration of this parasitic cricket into ant nests.


Conflict of interest statement

Competing interests: The authors declare no competing interests.

Figures

Fig. 1
Fig. 1. PCoA of CHC profiles of an ant cricket and workers of five ant species.
Axes are represented by principal coordinates. Different colour plots show different species. Sample sizes are as follows: n = 6 for M. tetramorii, n = 6 for P. noda, n = 8 for L. japonicus, n = 10 for P. punctatus and T. tsushimae. CHC profiles were significantly differed among species (Pairwise PERMANOVA with Benjamini-Hochberg corrections, all combinations: p < 0.01, see Supplementary Table 1 for details).
Fig. 2
Fig. 2. The escape reaction of crickets against ants was quantitatively classified into two types of behaviours: distancing and dodging.
a Photograph of a Myrmecophilus tetramorii ant cricket, its host ant Tetramorium tsushimae, and non-host ants Pheidole noda and Pachycondyla chinensis. b Clustering dendrogram of cricket trajectories. Isolated clusters are coloured in orange and blue, respectively. The annotated numbers are the number of trajectories included in each cluster. c Values of three cluster validation indexes under different cluster numbers. The solid (blue), dashed (red), and dot-dash (purple) lines indicate the Silhouette coefficient index, Calinski-Harabasz index, and Davies-Bouldin index, respectively. d All cricket trajectories belonging to each cluster. Colours indicate the ant’s approaching directions to the cricket at the event time. e Examples of two individual traces of cricket (red) and ant positions (black) for each of the two clusters. f The cricket’s positions (green dots) and its density contour calculated by the Gaussian kernel density estimation (brown shaded) relative to the ant immediately before and after the event (left, middle). The origin of coordinates indicates the ant’s centroid, and the positive direction along the Y-axis indicates the front of the ant. The histogram (green) and the kernel density estimation (solid brown) of the cricket’s Y-positions immediately after the event (right) are shown.
Fig. 3
Fig. 3. Dodging behaviour is a more moderate escape strategy and is selectively elicited against the host ant species.
a The ratios and the number of trajectories for each behaviour against the ant species. We performed Pearson’s chi-square test for a fit of uniform distribution. T. tsushimae: p = 2.54 × 10−24; P. noda: p = 0.94; P. chinensis p=0.20. b The number of trajectories for each behaviour against the ant’s approaching direction at the event time. The trajectories for each ant species were integrated. Pearson’s chi-square test for statistical independence; p = 0.18. c Interindividual distances between the cricket and the ant at the encounter event. Dots represent data for individual events throughout subsequent panels. The centre line and box limits show median and the upper and lower quartiles, respectively. The whiskers show the rest of the distribution except for outliers. Sample sizes are as described in a. Repeated measures ANOVA followed by Bonferroni post-hoc test was used to verify differences: T. tsushimae, p = 3.64 × 10−4, Cohen’s d = 0.64; P. noda, p=0.022, Cohen’s d = 0.33; and P. chinensis, p = 7.42 × 10−3, Cohen’s d = 0.63. *p < 0.05, **p < 0.01, ***p < 0.001. d A cricket’s average movement speed during each behaviour against the ant species. Repeated measures ANOVA and Bonferroni post-hoc test: T. tsushimae, p = 1.67 × 10−17, Cohen’s d = 1.77; P. noda, p = 6.43 × 10−14, Cohen’s d = 1.16; P. chinensis, p = 2.26 × 10−4, Cohen’s d = 0.90. ***p < 0.001. e A time series of the interindividual distance between the cricket and the ant during behaviours. Mean distance is shown ±SEM (shaded regions).
Fig. 4
Fig. 4. Ant crickets attempt to maintain proximity to certain areas by consecutive dodging behaviour in its host’s ant colony.
a Heat-map showing the cricket’s position during 30-minute observation in the colony of T. tsushimae overlaid on the snapshot of video images. The colour represents the cumulative time spent at that location on a logarithmic scale. A star, inverted triangle and diamond shapes indicate landmarks where the cricket tended to stay for an extended period. bd i: Examples of cricket’s trajectory during consecutive dodging behaviour at each landmark. The colour represents the time. ii: Examples of sequential images at a part of the trajectories which are shown in (i). iii: Schematic illustrations of animal moving in the epoch shown in (ii). The coloured and grey arrows indicate cricket’s and ant’s moving respectively.
Fig. 5
Fig. 5. Dodging is a more effective escape strategy for remaining in an attractive area while avoiding ants in a limited space.
a Examples of observed (black) and simulated (red) trajectories for each behaviour. Each trajectory was aligned and displayed in the direction of the first frame to upward. b Examples of the whole trajectory in a single simulation for each escape strategy (upper panels). Red lines and blue cross marks are the simulated cricket’s trajectories and encounter events with simulated ants, respectively. Heat-maps showing the simulated cricket’s position calculated by 100 simulation runs (bottom panels). The colour represents the cumulative stay time at that location. A circle with black dashed line indicates the attractive area. An arrowhead indicates the initial position of the simulated cricket. c Quantification of the results in b as cumulative stay time in the attractive area. Dots indicate the results from individual simulations. Welch’s t-test; p = 2.22 × 10−5.

Similar articles

References

    1. Weinstein, S. B. & Kuris, A. M. Independent origins of parasitism in Animalia. Biol. Lett.12, 1–5 (2016). - PMC - PubMed
    1. Kronauer, D. J. C. & Pierce, N. E. Myrmecophiles. Curr. Biol.21, 208–209 (2011). - PubMed
    1. Lachaud, J. P., Lenoir, A. & Witte, V. Ants and their parasites. Psyche2012, 1–5 (2012).
    1. Parmentier, T. Guests of Social Insects. Encycl. Soc. Insects 1–15 (2020).
    1. Sturgis, S. J. & Gordon, D. M. Nestmate recognition in ants (Hymenoptera: Formicidae): A review. Myrmecological N.16, 101–110 (2012).

Supplementary concepts

LinkOut - more resources