. 2024 Dec 30;14(1):32121.
doi: 10.1038/s41598-024-83912-4.

Inhibition of AKT enhances chemotherapy efficacy and synergistically interacts with targeting of the Inhibitor of apoptosis proteins in oesophageal adenocarcinoma

Affiliations

Inhibition of AKT enhances chemotherapy efficacy and synergistically interacts with targeting of the Inhibitor of apoptosis proteins in oesophageal adenocarcinoma

Leanne Stevenson et al. Sci Rep. .

Abstract

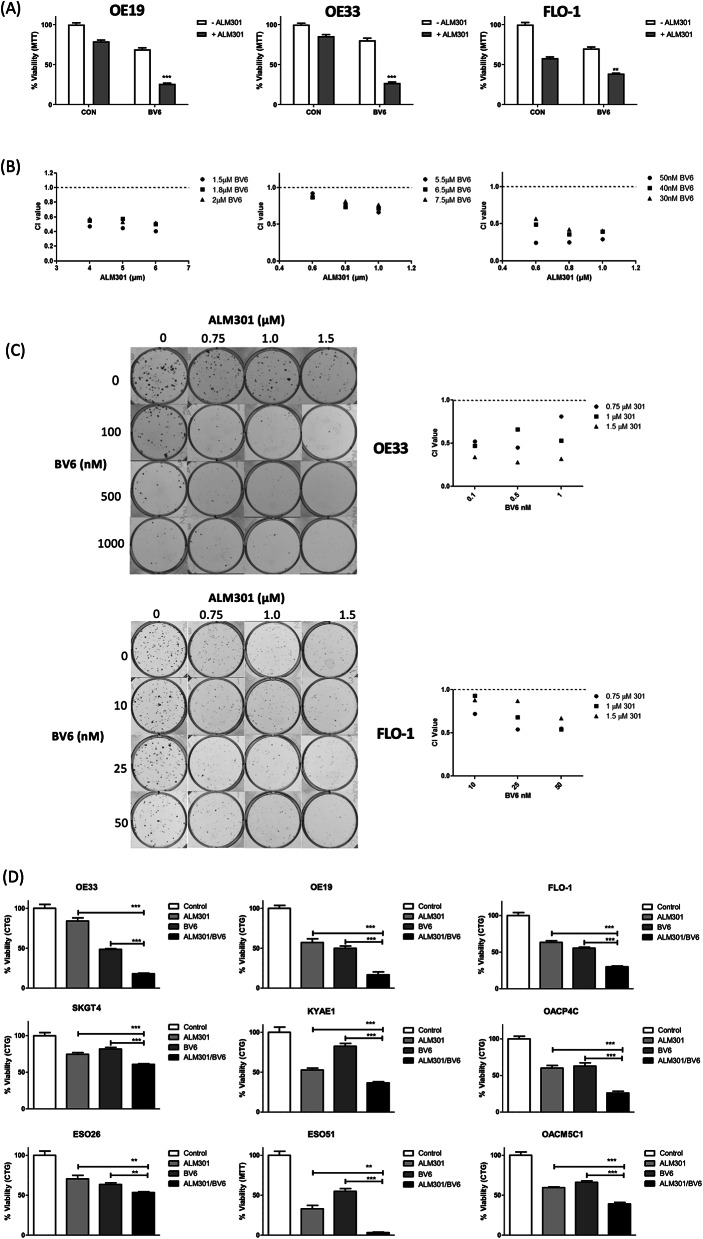
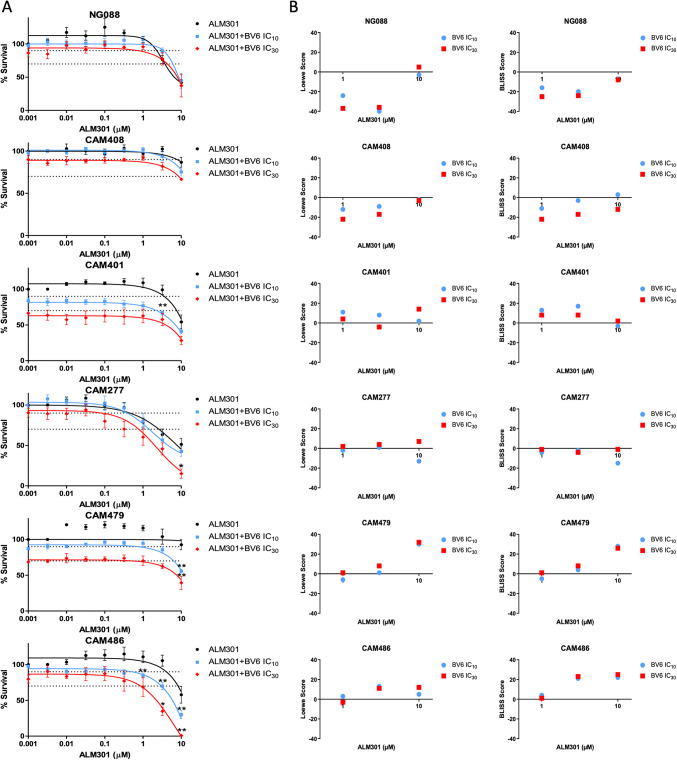
The incidence of oesophageal adenocarcinoma (OAC) has risen six-fold in western countries over the last forty years but survival rates have only marginally improved. Hyperactivation of the PI3K-AKT-mTOR pathway is a common occurrence in OAC, driving cell survival, proliferation and resistance to chemotherapeutic agents. Inhibition of AKT has been explored as a treatment strategy with limited success and current inhibitors have failed to progress through clinical trials. Our study, describes a novel allosteric AKT inhibitor, ALM301, and demonstrates an enhancement of the efficacy of conventional chemotherapy when combined with ALM301 in OAC. Reduced sensitivity to ALM301 is associated with high expression of the Inhibitor of Apoptosis (IAP) family of proteins, particularly XIAP. Combined AKT and IAP inhibition synergistically enhanced OAC cell death and successfully re-sensitized ALM301 and chemotherapy resistant cell lines. A high degree of synergism was also observed in patient-derived OAC organoids indicating the potential clinical relevance of the combination. This study demonstrates the role for dual AKT/IAP inhibition in OAC and provides a strong rationale for the further investigation of this highly efficacious combination strategy.


Conflict of interest statement

Declarations. Competing interests: TH, GG, JX are employees of Almac Diagnostic Services and have patent declarations. RCT reports personal fees from Eli Lilly, Astellas and Almac Diagnostic Services outside the submitted work. All other authors do not have competing interests to declare.

Figures

Fig. 1
Fig. 1
AKT inhibition enhances anti-tumour activity of chemotherapy. (A) Western blot analysis of constitutive levels of AKT protein expression/phosphorylation and PTEN protein in EAC cell line panel. (B) phospho-AKT-S473 to confirm of AKT inhibition in OAC cell lines following 24 h treatment with 1 µM ALM301. Vinculin was used as a loading control. (C) Combination index (CI) values from MTT viability assays following 72 h treatment with ALM301/CDDP combinations using drug doses of ~ IC30(72 h) or less. A CI value < 1, = 1, and > 1 indicates synergism, additivity and antagonism respectively. (D) Flow cytometric analysis of the sub-G1 OAC cell population at 72 h post-treatment with ~ IC30(72 h) doses of ALM301 or CDDP alone or in combination. (E) Combination index (CI) values from MTT viability assays following 72 h treatment with ALM301/5-FU combinations using drug doses of ~ IC30(72 h) or less. (F) Flow cytometric analysis of the sub-G1 OAC cell population at 72 h post-treatment with ~ IC30(72 h) doses of ALM301 or CDDP alone or in combination. A 2-way ANOVA was used to test for statistical significance of the ALM301/BV6 combination where NS is not significant, *** = p < 0.001, ** = p < 0.01 and * = P < 0.05. Data is representative of the mean of triplicate experiments ± standard error of the mean (SEM). (G) Q-PCR and Western blot analysis of AKT1 and AKT2 to confirm AKT knockdown at the gene and protein level respectively. Densitometry was applied to quantify levels of AKT. (H) Flow cytometric analysis of the Annexin V-positive FLO-1 cell population following AKT1/2 silencing alone or in combination with 72 h ~ IC30(72 h) 5-FU treatment. Western blot analysis of cleaved PARP following AKT1/2 silencing alone or in combination with 72 h ~ IC30(72 h) 5-FU treatment. Vinculin was used a loading control. Statistical significance of 5-FU-treated compared untreated controls was assessed by a paired t-test where NS = not significant, *** = p < 0.001, ** = p < 0.01 and * = p < 0.05. Data is representative of the mean ± SEM.
Fig. 2
Fig. 2
Characterisation of IAP proteins in OAC cells. (A) Western blot analysis of cleaved PARP, cIAP1, cIAP2, XIAP and Survivin following 24 h treatment with ~ IC30(72 h) doses of chemotherapy in OE33, FLO1 and OE19 cell lines. Western blot analysis of basal IAP protein levels in (B) paired sensitive and resistant OAC cell lines and (C) an OAC cell line panel. Vinculin was used as a loading control (D) Pearson correlation analysis of wild-type XIAP protein levels and ALM301 sensitivity, ~ IC50(72 h) in the OAC cell line panel (r = 0.79, p < 0.05). XIAP mutant KYAE1 cell line was omitted from the analysis due to predicted functionality effect.
Fig. 3
Fig. 3
IAP antagonist activity in OAC cells (A) Western blot analysis of cleaved PARP, cIAP1, cIAP2, XIAP and Survivin protein levels following 24 h treatment with SMC, BV6. Vinculin was used as a loading control. (B) MTT analysis of OAC cell viability following 72 h treatment with BV6.
Fig. 4
Fig. 4
Synergy between AKT inhibitor (ALM301) and IAP antagonist (BV6) in OAC cells. (A) MTT analysis of OAC cell viability following 72 h treatment with ~ IC30(72 h) doses of BV6 or ALM301 alone or in combination. Statistical significance of the ALM301/BV6 combination was assessed by a 2-way ANOVA where NS = not significant, *** = p < 0.001, ** = p < 0.01 and * = P < 0.05. Data is representative of the mean of triplicate experiments ± SEM. (B) MTT assays were used to assess OAC cell viability at 72 h post-treatment with ALM301/BV6 combinations using drug doses of ~ IC30(72 h) or less. (C) Colony formation assays were used to assess OAC cell viability at ~ 10–14 days post-treatment with ALM301/BV6 combinations using drug doses of ~ IC30(72 h) or less. To evaluate the interaction between BV6 and ALM301, the method of Chou and Talalay was used to calculate combination index (CI) values. CI values < 1, = 1, and > 1 indicating synergism, additivity, and antagonism, respectively. For synergistic interactions, CI values between 0.8–0.9 indicate slight synergy, 0.6–0.8 indicate moderate synergy, 0.4–0.6 indicate synergy and those < 0.4 indicate strong synergy. (D) CellTiter Glo analysis of OAC cell viability at 72 h post-treatment with ~ IC30(72 h) doses of ALM301 or BV6 alone or in combination. Statistical significance was assessed by an unpaired t-test where NS = not significant, *** = p < 0.001, ** = p < 0.01 and * = P < 0.05. Values are representative of the mean of triplicate experiments ± SEM.
Fig. 5
Fig. 5
IAP antagonist (BV6) enhances anti-tumour activity of AKT inhibitor (ALM301) in drug-resistant OAC cells. (A) MTT analysis of ALM301-R FLO-1 and OE33 cell viability at 72 h post-treatment with parental ~ IC30(72 h) doses of ALM301 alone or in combination with BV6. (B) CellTiter Glo analysis of CDDP-R OE33 cell viability at 72 h post-treatment with parental ~ IC30(72 h) doses of ALM301 or BV6 alone or in combination. Statistical significance of the ALM301/BV6 interaction was assessed using a 2-way ANOVA where *** = p < 0.001, ** = p < 0.01 and * = P < 0.05. Values are representative of the mean ± SEM. (C) Western blot analysis of constitutive AKT, phospho-AKT-S473 and –T308 in the paired OE33 parental and CDDP-R cells. Vinculin was used as a loading control.
Fig. 6
Fig. 6
Synergy between IAP antagonist (BV6) and AKT inhibitor (ALM301) in OAC organoid models. (A) CellTiter Glo viability of OAC organoids following ALM301 /BV6 combination treatment. Significant interaction by 2-Way ANOVA is represented as P value < 0.05*, 0.01** and 0.001*** (B) ALM301/BV6 synergy analysis using Loewe and BLISS methods where positive scores represent synergy, negative scores represent antagonism and scores of 0 represent an additive effect.

References

    1. Rustgi, A. K. & El-Serag, H. B. Esophageal carcinoma. N. Engl. J. Med.371, 2499–2509 (2014). - PubMed
    1. Shapiro, J. et al. Neoadjuvant chemoradiotherapy plus surgery versus surgery alone for oesophageal or junctional cancer (CROSS): Long-term results of a randomised controlled trial. Lancet Oncol.16, 1090–1098 (2015). - PubMed
    1. Al-Batran, S.-E. et al. Perioperative chemotherapy with fluorouracil plus leucovorin, oxaliplatin, and docetaxel versus fluorouracil or capecitabine plus cisplatin and epirubicin for locally advanced, resectable gastric or gastro-oesophageal junction adenocarcinoma (FLOT4): A ra. Lancet393, 1948–1957 (2019). - PubMed
    1. Allum, W. H., Stenning, S. P., Bancewicz, J., Clark, P. I. & Langley, R. E. Long-term results of a randomized trial of surgery with or without preoperative chemotherapy in esophageal cancer. J. Clin. Oncol.27, 5062–5067 (2009). - PubMed
    1. Cunningham, D., Allum, W. H., Stenning, S. P., Thompson, J. N., Van de Velde, C. J. H., Nicolson, M., Scarffe, J. H., Lofts, F. J., Falk, S. J., Ives, T. J., Perioperative Chemotherapy versus surgery alone for resectable gastroesophageal cancer. N. Engl. J. Med. 2213–2224 (2006) 10.1056/NEJMoa055531. - PubMed

Publication types

MeSH terms

Substances

Supplementary concepts