Phenotypic screening in zebrafish larvae identifies promising cyanobacterial strains and pheophorbide a as insulin mimetics
- PMID: 39739113
- PMCID: PMC11685485
- DOI: 10.1038/s41598-024-83986-0
Phenotypic screening in zebrafish larvae identifies promising cyanobacterial strains and pheophorbide a as insulin mimetics
Abstract
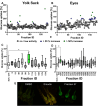
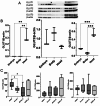
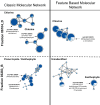
Diabetes is a pandemic disease that causes the loss of control of glucose regulation in the organism, in consequence of dysfunction of insulin production or functionality. In this work, the antidiabetic bioactivity of 182 fractions from 19 cyanobacteria strains derived from the LEGE Culture Collection were analysed using the 2-NBDG assay in zebrafish larvae. From this initial screening, two fractions (57 (06104_D) and 107 (03283_B)) were identified as promising insulin mimetics. These were further characterized by measuring glucose levels in whole larvae, the expression of glucose transporters (GLUT 1-3) using western blot, and the mRNA expression levels of the glut2, pepck, and insa genes using real-time qPCR. Both fractions showed a decrease in free glucose levels. Furthermore, exposure to fraction 06104_D decreased GLUT1 and increased insa mRNA levels. The chemical composition of these fractions was determined using LC-HRESIMS/MS and compared to inactive fractions of the same polarity in order to identify the unique bioactive molecules. The molecular networks constructed using the GNPS platform revealed that fraction 06104_D contained mass clusters primarily composed of chlorins, lipids, and terpenoids, while fraction 03283_B contained xanthophylls, peptides, and terpenoids. To correlate the observed activity with the chemical composition of fraction 06104_D, pheophorbide a was chosen as a representative of chlorophyll derivatives. Exposure to zebrafish larvae at 10 and 20 µM confirmed the increased glucose uptake on the 2-NBDG assay. These findings highlight the bioactivity of chlorophyll derivatives as insulin mimetic compounds, as well as cyanobacteria as a source of potential therapeutic diabetes applications.
Keywords: Cyanobacteria; Diabetes; Glucose; Metabolomics; Pheophorbide a; Zebrafish.
© 2024. The Author(s).
Conflict of interest statement
Declarations. Competing interests: The authors declare no competing interests. Ethic Declaration: According to the EC Directive 86/609/EEC for animal experiments, zebrafish larvae in non-independent feeding stages of development are not considered animal experimentation. Hence, ethical review and approval were not necessary.
Figures


Similar articles
-
Identification of Cyanobacterial Strains with Potential for the Treatment of Obesity-Related Co-Morbidities by Bioactivity, Toxicity Evaluation and Metabolite Profiling.Mar Drugs. 2019 May 10;17(5):280. doi: 10.3390/md17050280. Mar Drugs. 2019. PMID: 31083362 Free PMC article.
-
Exploring the potential of pheophorbide A, a chlorophyll-derived compound in modulating GLUT for maintaining glucose homeostasis.Front Endocrinol (Lausanne). 2024 Mar 11;15:1330058. doi: 10.3389/fendo.2024.1330058. eCollection 2024. Front Endocrinol (Lausanne). 2024. PMID: 38529398 Free PMC article.
-
β-cells regeneration by WL15 of cysteine and glycine-rich protein 2 which reduces alloxan induced β-cell dysfunction and oxidative stress through phosphoenolpyruvate carboxykinase and insulin pathway in zebrafish in-vivo larval model.Mol Biol Rep. 2022 Dec;49(12):11867-11879. doi: 10.1007/s11033-022-07882-4. Epub 2022 Oct 12. Mol Biol Rep. 2022. PMID: 36224446
-
Antidiabetic Phytocompounds Acting as Glucose Transport Stimulators.Endocr Metab Immune Disord Drug Targets. 2023;23(2):147-168. doi: 10.2174/1871530322666220510093720. Endocr Metab Immune Disord Drug Targets. 2023. PMID: 35538807 Review.
-
Effects of hyperglycemia on glucose transporters of the muscle: use of the renal glucose reabsorption inhibitor phlorizin to control glycemia.J Am Soc Nephrol. 1992 Nov;3(5):1078-91. doi: 10.1681/ASN.V351078. J Am Soc Nephrol. 1992. PMID: 1482748 Review.
Cited by
-
Beyond Green: The Therapeutic Potential of Chlorophyll and Its Derivatives in Diabetes Control.Nutrients. 2025 Aug 15;17(16):2653. doi: 10.3390/nu17162653. Nutrients. 2025. PMID: 40871679 Free PMC article. Review.
References
Publication types
MeSH terms
Substances
Grants and funding
LinkOut - more resources
Full Text Sources
Medical
Molecular Biology Databases
Miscellaneous

