

Accurately predicting optimal conditions for microorganism proteins through geometric graph learning and language model
- PMID: 39739114
- PMCID: PMC11683147
- DOI: 10.1038/s42003-024-07436-3
Accurately predicting optimal conditions for microorganism proteins through geometric graph learning and language model
Abstract
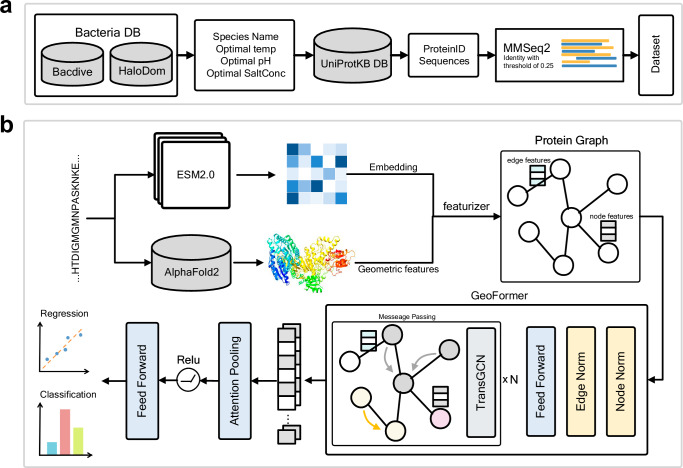
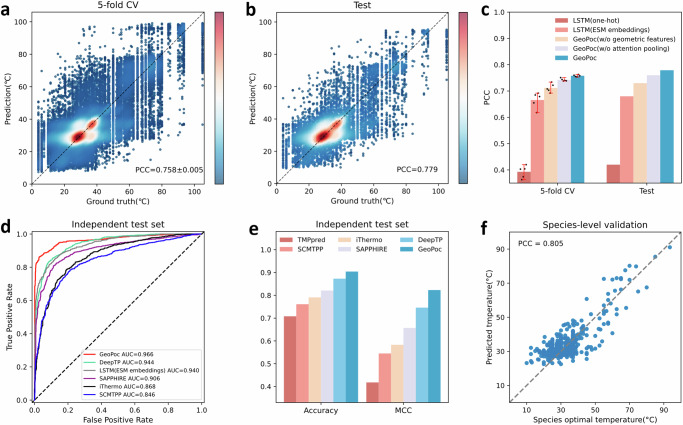
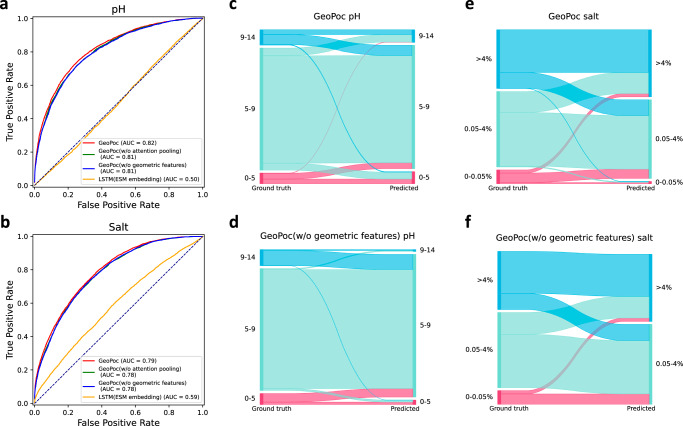
Proteins derived from microorganisms that survive in the harshest environments on Earth have stable activity under extreme conditions, providing rich resources for industrial applications and enzyme engineering. Due to the time-consuming nature of experimental determinations, it is imperative to develop computational models for fast and accurate prediction of protein optimal conditions. Previous studies were limited by the scarcity of data and the neglect of protein structures. To solve these problems, we constructed an up-to-date dataset with 175,905 non-redundant proteins and proposed a new model GeoPoc based on geometric graph learning for the protein optimal temperature, pH, and salt concentration prediction. GeoPoc leverages protein structures and sequence embeddings extracted from pre-trained language model, and further employs a geometric graph transformer network to capture the sequence and spatial information. We first focused on in-house validation for optimal temperature prediction for robustness assessment, and achieved a PCC of 0.78. The algorithm is further confirmed in an independent test set, where GeoPoc surpasses the state-of-the-art method by 2.3% in AUC. Additionally, GeoPoc was extended to pH and salt concentration prediction, and obtained AUC scores of 0.78 and 0.77, respectively. Through further interpretable analysis, GeoPoc elucidates the critical physicochemical properties that contribute to enhancing protein thermostability.
© 2024. The Author(s).
Conflict of interest statement
Competing interests: Y.Y. is an Editorial Board Member for Communications Biology, but was not involved in the editorial review of, nor the decision to publish this article. All the other authors declare no competing interests.
Figures
Similar articles
-
Learning a generalized graph transformer for protein function prediction in dissimilar sequences.Gigascience. 2024 Jan 2;13:giae093. doi: 10.1093/gigascience/giae093. Gigascience. 2024. PMID: 39657158 Free PMC article.
-
Accurately predicting enzyme functions through geometric graph learning on ESMFold-predicted structures.Nat Commun. 2024 Sep 18;15(1):8180. doi: 10.1038/s41467-024-52533-w. Nat Commun. 2024. PMID: 39294165 Free PMC article.
-
PLM-T3SE: Accurate Prediction of Type III Secretion Effectors Using Protein Language Model Embeddings.J Cell Biochem. 2025 Jan;126(1):e30642. doi: 10.1002/jcb.30642. Epub 2024 Aug 20. J Cell Biochem. 2025. PMID: 39164870
-
GraphPBSP: Protein binding site prediction based on Graph Attention Network and pre-trained model ProstT5.Int J Biol Macromol. 2024 Dec;282(Pt 1):136933. doi: 10.1016/j.ijbiomac.2024.136933. Epub 2024 Oct 28. Int J Biol Macromol. 2024. PMID: 39471921
-
GGN-GO: geometric graph networks for predicting protein function by multi-scale structure features.Brief Bioinform. 2024 Sep 23;25(6):bbae559. doi: 10.1093/bib/bbae559. Brief Bioinform. 2024. PMID: 39487084 Free PMC article.
References
-
- Stetter, K. O. Extremophiles and their adaptation to hot environments. FEBS Lett.452, 22–25 (1999). - PubMed
-
- Dumorné, K., Córdova, D. C., Astorga-Eló, M. & Renganathan, P. Extremozymes: a potential source for industrial applications J. Microbiol. Biothechnol. 27, 649–659 (2017). - PubMed
-
- Cowan, D. A., Ramond, J.-B., Makhalanyane, T. P. & De Maayer, P. Metagenomics of extreme environments. Curr. Opin. Microbiol.25, 97–102 (2015). - PubMed
-
- Fujiwara, S. Extremophiles: Developments of their special functions and potential resources. J. Biosci. Bioeng.94, 518–525 (2002). - PubMed
-
- Brininger, C., Spradlin, S., Cobani, L. & Evilia, C. The more adaptive to change, the more likely you are to survive: protein adaptation in extremophiles. In Seminars In Cell & Developmental Biology (ed. Mao, Y.) 158–169 (Elsevier, 2018). - PubMed
MeSH terms
Substances
LinkOut - more resources
Full Text Sources
