. 2025 Feb;12(8):e2411711.
doi: 10.1002/advs.202411711. Epub 2024 Dec 31.

Myeloid-Derived Suppressor Cell Accumulation Drives Intestinal Fibrosis through mCCL6/hCCL15 Chemokine-Mediated Fibroblast Activation

Affiliations

Myeloid-Derived Suppressor Cell Accumulation Drives Intestinal Fibrosis through mCCL6/hCCL15 Chemokine-Mediated Fibroblast Activation

Xiaohui Cheng et al. Adv Sci (Weinh). 2025 Feb.

Abstract

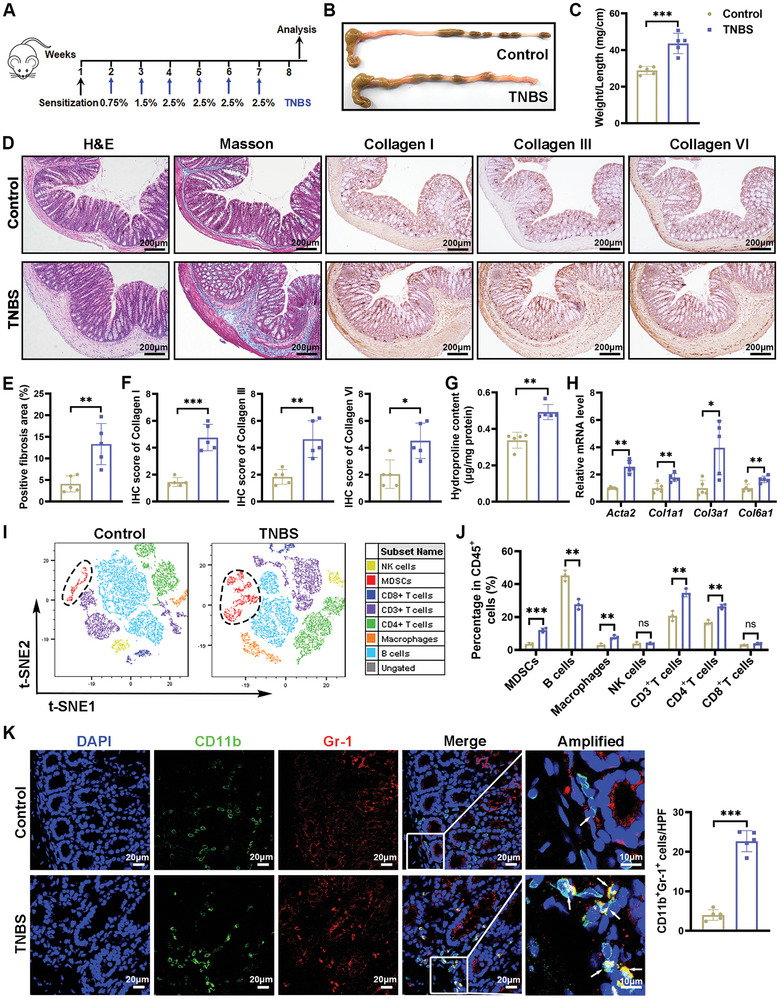
Intestinal fibrosis, a severe complication of Crohn's disease (CD), is linked to chronic inflammation, but the precise mechanism by which immune-driven intestinal inflammation leads to fibrosis development is not fully understood. This study investigates the role of myeloid-derived suppressor cells (MDSCs) in intestinal fibrosis in CD patients and a 2,4,6-trinitrobenzene sulfonic acid (TNBS)-induced mouse model. Elevated MDSCs are observed in inflamed intestinal tissues prior to fibrosis and their sustained presence in fibrotic tissues of both CD patients and murine models. Depletion of MDSCs significantly reduces fibrosis, highlighting their key role in the fibrotic process. Mechanistically, MDSC-derived mCCL6 activates fibroblasts via the CCR1-MAPK signaling, and interventions targeting this axis, including neutralizing antibodies, a CCR1 antagonist, or fibroblast-specific Ccr1 knockout mice reduce fibrosis. In CD patients with stenosis, human CCL15, analogous to mCCL6, is found to be elevated in MDSCs and activated fibroblasts. Additionally, CXCR2 and CCR2 ligands are identified as key mediators of MDSC recruitment in intestinal fibrosis. Blocking MDSC recruitment with CXCR2 and CCR2 antagonists alleviates intestinal fibrosis. These findings suggest that strategies targeting MDSC recruitment and mCCL6/hCCL15 signaling could offer therapeutic benefits for intestinal fibrosis.

Keywords: IBD; MDSCs; intestinal fibroblasts; intestinal fibrosis; mCCL6/hCCL15.


Conflict of interest statement

The authors declare no conflict of interest.

Figures

Figure 1
Figure 1
Induction of intestinal fibrosis in mice through repeated intracolonic administration of TNBS resulted in an increased proportion of MDSCs. A) The schematic diagram depicts the methodology for the establishment of TNBS‐induced intestinal fibrosis in mice. B,C) Eight weeks post‐initial TNBS treatment, colon tissues were harvested for gross examination and the calculation of the weight‐to‐length ratio. D) Histological examination, including hematoxylin & eosin (H&E) staining, Masson's trichrome staining, and immunohistochemical (IHC) staining for collagen types I, III and VI was performed on serial sections of colon tissue from both control and TNBS‐treated mice. Scale bar = 200 µm. E) The mean percentage of areas positive for Masson's trichrome and F) the semiquantitative scoring of IHC staining images were performed using ImageJ software. Extracellular matrix deposition in the colon tissues was measured by G) hydroxyproline assay and H) qRT‐PCR analyses for Acta2, Col1a1, Col3a1, and Col6a1. n = 5 mice per group for (C–H). I,J) Flow cytometry was applied to identify the immune cell subsets within the colonic lamina propria, with data visualized using t‐SNE maps and histograms. n = 3 mice per group. K) Immunofluorescence staining visualized MDSCs (CD11b+Gr‐1+) in the colon tissues. Red, Gr‐1; green, CD11b; blue, DAPI for nuclear staining. Scale bars are provided in the images. n = 5 mice each group. D–F,K) Tissue sections from each mouse were examined, and five fields were captured for quantitative analysis, with each data point representing the mean of these fields. Data are presented as means ± SD. Statistical analyses were performed using an unpaired t‐test with Welch's correction (two tailed) for (H) (Acta2, Col3a1), Mann‐Whitney U test for (G), and unpaired Student's t‐test (two tailed) for other panels. *p < 0.05, **p < 0.01 and ***p < 0.001, ns, not significant.
Figure 2
Figure 2
Abnormal accumulation of MDSCs in the lamina propria of Crohn's disease (CD) patients during the progression of intestinal fibrosis. A) Histological examination, including hematoxylin & eosin (H&E) staining, Masson's trichrome staining, and immunohistochemical staining for collagen types I, III and VI, was performed on serial intestinal tissue sections from different regions of CD patients. B–D) The ImageJ software was used to quantify the minimum and maximum submucosal thickness, the percentage of areas positive for Masson's trichrome, as well as the IHC staining scores (n = 5 patients). E,F) Flow cytometry was employed to detect the proportions of MDSCs (CD33+CD11b+HLA‐DR−/low) in different intestine segments of CD patients, and statistical analysis was performed (n = 20 patients). G,H) Immunofluorescence staining was conducted to visualize MDSCs (CD11b+CD33+) in different segments from CD patients, and the number of positive cells was quantified. The colors represent: red, CD33; green, CD11b; blue, DAPI nuclear staining. A scale bar is included in the image for reference (n = 5 patients). A,B,G) Tissue sections from each patient were examined, and five fields were captured for quantitative analysis, with each data point representing the mean of these fields. Results are presented as means ± SD. Statistical analyses were performed using Brown‐Forsythe and Welch ANOVA with Tamhane's multiple comparisons test for (F) and one‐way ANOVA with Bonferroni's multiple comparison test for the other panels. *p < 0.05, **p < 0.01 and ***p < 0.001, ns, not significant.
Figure 3
Figure 3
The impact of adoptive transfer of MDSCs or depletion MDSCs via anti‐Gr‐1 antibody on the TNBS‐induced mouse model of intestinal fibrosis was investigated. A) Experimental design for in vivo depletion and adoptive transfer of MDSCs in the intestine fibrosis mouse model is depicted. B) Flow cytometry was conducted to evaluate the MDSC population within the colonic lamina propria of mice subjected to various treatments. Colon tissues were harvested for C) morphological assessment, D) calculation of the weight‐to‐length ratio, E) hydroxyproline assay, and F) qRT‐PCR analysis of fibrotic markers (Acta2, Col1a1, Col3a1, and Col6a1). Histological evaluations, including G) H&E staining, Masson's trichrome staining, immunohistochemical staining for collagen types I, III, and VI, as well as H) immunofluorescence staining for α‐SMA, were performed on tissue sections from control and TNBS‐treated mice receiving different treatments. The quantification of Masson's trichrome and α‐SMA‐positive areas, along with IHC staining scores, was carried out using ImageJ software. Green, α‐SMA; blue, DAPI for nuclear staining. A scale bar is provided for reference. n = 5 mice per group. G,H) Tissue sections from each mouse were examined, and five fields were captured for quantitative analysis, with each data point representing the mean of these fields. Data are presented as means ± SD. Statistical analyses were performed using Brown‐Forsythe and Welch ANOVA with Tamhane's multiple comparisons test for (B,G) (analysis of Masson's trichrome staining), and one‐way ANOVA with Bonferroni's multiple comparison test for the remaining panels. *p < 0.05, **p < 0.01 and ***p < 0.001, ns, not significant.
Figure 4
Figure 4
MDSCs from the colon promoted fibroblasts activation and collagen production in intestinal fibrosis. A) Schematic illustration of the co‐culture setup with primary colonic MDSCs and intestinal fibroblasts at a ratio of 10:1 for 24 h. B,C) qRT‐PCR and western blotting analysis were used to assess the mRNA and protein levels of α‐SMA and collagen (types I, III, and VI) in fibroblasts following co‐culture with MDSCs. D) Immunofluorescence staining for α‐SMA in cocultured fibroblasts is shown. Green, α‐SMA; blue, DAPI for nuclear staining. Images are representative of three independent experiments. n = 3 biologically independent samples for (B), and the experiments were repeated three times independently with similar results for (D). E) mRNA levels of ACTA2 in healthy, inflamed non‐stenotic and stenotic intestinal tissues from CD patients were analyzed by qRT‐PCR (n = 20 patients). F) Correlation analysis between the relative expression of ACTA2 and MDSC levels in stenotic tissues versus healthy tissues from CD patients (R = 0.7349, P = 0.0002, n = 20 patients). G) Double‐staining for Gr‐1 and α‐SMA in colon tissues from TNBS‐treated mice is depicted, with boxed areas highlighting the proximity of Gr‐1+ and α‐SMA+ cells. n = 5 mice each group. H) Double‐stained for CD33 and α‐SMA in stenotic, inflamed non‐stenotic, and healthy intestinal tissues from CD patients is shown, with boxed areas indicating the proximity of CD33+ and α‐SMA+ cells. n = 5 patients. Green, α‐SMA; red, CD33 or Gr‐1; blue, DAPI for nuclear staining. Scale bars are included in (D,G,H) for reference. G,H) Tissue sections from each mouse or patient were examined, and five fields were captured for quantitative analysis, with each data point representing the mean of these fields. Data are presented as means ± SD. Statistical analyses were performed using Kruskal‐Wallis test with Dunn's multiple comparisons test in (B) (Acta2), Brown‐Forsythe and Welch ANOVA with Tamhane's multiple comparisons test for (E), Pearson's correlation analysis for (F), unpaired Student's t test (two tailed) for (G), and one‐way ANOVA with Bonferroni's multiple comparison test for other panels. *p < 0.05, **p < 0.01 and ***p < 0.001, ns, not significant.
Figure 5
Figure 5
MDSCs‐derived mCCL6 activated fibroblasts and promoted collagen production. A) A heatmap illustrates the differential expression of cytokines and chemokines in colonic MDSCs from control and TNBS‐treated intestinal fibrosis mice. B) Sequence reads for these cytokines and chemokines in colonic MDSCs isolated from normal and TNBS‐induced intestinal fibrosis mice are presented. C) Flow cytometry was performed to assess mCCL6 expression in colonic lamina propria MDSCs, including M‐MDSCs and PMN‐MDSCs, from control and TNBS‐treated intestinal fibrosis mice (n = 5 mice per group). D) Western blotting was used to assess mCCL6 protein levels in colons from control and TNBS‐treated intestinal fibrosis mice. E) qRT‐PCR was used to evaluate mRNA levels of mCcl6 and Ccr1 in epithelial cells, fibroblasts, MDSCs, and non‐MDSC LPMCs within the lamina propria (n = 3 mice per group for D–E). F) Primary intestinal fibroblasts were treated with 25 ng mL−1 mCCL6 to assess the levels of phosphorylated ERK1/2 (p‐ERK1/2) and phosphorylated p38 (p‐p38) at 30 min post‐stimulation, and α‐SMA, collagen I, collagen III, and collagen VI at 24 h post‐stimulation. G,H) Primary intestinal fibroblasts were co‐cultured with fibrotic colonic MDSCs at a ratio of 1:10. In selected experiments, mCCL6‐neutralizing antibodies (40 ng mL−1) or BX471 (20 µm) were added to the co‐culture. Western blotting was used to measure the expression of MAPK pathway molecules and activation markers in the fibroblasts at the indicated time points (p‐ERK1/2 and p‐p38 at 30 min; α‐SMA, collagen I, collagen III, and collagen VI at 24 h). Data are presented as means ± SD. Statistical analyses were performed using the Mann‐Whitney U test for (C) (mCCL6+ cells in M‐MDSCs), unpaired t test with Welch's correction (two tailed) for (E) (mCcl6 expression in MDSCs, Ccr1 expression in fibroblasts and other LPMCs), and unpaired Student's t test (two tailed) for other panels. *p < 0.05, **p < 0.01 and ***p < 0.001, ns, not significant.
Figure 6
Figure 6
Inhibiting CCL6‐CCR1 pathways mitigated intestinal fibrosis in TNBS‐treated mice. A) The experimental design is depicted for evaluating the therapeutic effects of a mCCL6 antibody on TNBS‐induced intestinal fibrosis. Colonic assessments included B) macroscopic observation, C) determination of the weight‐to‐length ratio, D) hydroxyproline content, and E) Western blotting analysis for p‐ERK1/2 and p‐P38. F) Histological analyses were performed using Masson's trichrome staining and immunofluorescence staining for α‐SMA (Green) with DAPI (Blue) for nuclear staining. n = 5 mice per group. G,H) Schematic representation of the strategy for generating fibroblast‐specific Ccr1 knockout mice. Further colonic assessments included I) macroscopic observation, J) calculation of weight‐to‐length ratio, and K) hydroxyproline content. L) Western blotting was used to evaluate p‐ERK1/2 and p‐P38 levels in colonic tissues of Ccr1 conditional knockout mice. M) Histological analyses included Masson's trichrome staining and immunofluorescence staining for α‐SMA. n = 5 mice per group. F,M) Five fields per tissue section were analyzed, with data points representing the mean of these fields. Representative images are presented. Scale bars are included in (F,M) for reference. The ImageJ software was utilized to quantify the percentages of Masson's trichrome and α‐SMA positive areas. Data are presented as means ± SD. Statistical analyses were performed using Brown‐Forsythe and Welch ANOVA with Tamhane's multiple comparisons test for (D) and one‐way ANOVA with Bonferroni's multiple comparison test for other panels. *p < 0.05, **p < 0.01 and ***p < 0.001.
Figure 7
Figure 7
CCR2 and CXCR2 ligands promoted MDSC infiltration into the colonic lamina propria in TNBS‐induced intestinal fibrosis in mice. A) Heatmaps show increased chemokine levels in TNBS‐treated colon tissues at 2 and 7 weeks compared with normal tissues (p < 0.05, and |log2FC|>1.0). n = 3 mice per group. B) ELISA measurements of CXCL1, CXCL5, CCL2, CCL6, CCL8, and CCL9 proteins in colon tissues from control and TNBS‐induced fibrotic mice at indicated time points. n = 5 mice per group. C,D) Bone marrow‐derived MDSCs were pretreated with receptor antagonists (BX471, 20 µm; RS504393, 200 nm; SB297006, 1 µm; Maraviroc, 10 µm; and SB225002, 400 nm) for 1 h before transwell migration assays with colonic tissue supernatants from both control and TNBS‐treated fibrotic mice. Antagonists were present throughout the 12 h chemotaxis assay. Migrated cells were stained with crystal violet and counted. Scale bars represent the image reference. Experiments were repeated three times with similar results. n = 3 independent samples. Representative images from five random fields per sample are shown. E) qRT‐PCR analysis of CXCL1, CXCL5, CCL2 and CCL8 in colon tissue from different CD patient regions. n = 10 patients. F) Schematic of the therapeutic approach combining SB225002 and RS504393 in a TNBS‐induced fibrosis mouse model. Colonic assessments included G) macroscopic evaluation, H) weight‐to‐length ratio calculation, and I) hydroxyproline content, and J) histological evaluations with Masson's trichrome and immunofluorescence staining for α‐SMA (Green), and DAPI (Blue). Scale bars are included. n = 5 mice per group. J) Five fields per tissue section were analyzed, with data points representing the field means. Representative images are presented. ImageJ software quantified the average percentages of Masson's trichrome and α‐SMA positive areas. Data are presented as means ± SD. Statistical analyses were performed using Kruskal‐Wallis test with Dunnett's multiple comparisons test for (E) (CCL2, CCL8), and one‐way ANOVA with Bonferroni's multiple comparison test for other panels. *p < 0.05, **p < 0.01 and ***p < 0.001, ns, no significant change.

References

    1. Lin S.‐N., Mao R., Qian C., Bettenworth D., Wang J., Li J., Bruining D. H., Jairath V., Feagan B. G., Chen M.‐H., Rieder F., Physiol. Rev. 2022, 102, 605. - PMC - PubMed
    1. D'Alessio S., Ungaro F., Noviello D., Lovisa S., Peyrin‐Biroulet L., Danese S., Nat. Rev. Gastroenterol. Hepatol. 2022, 19, 169. - PubMed
    1. Wang J., Lin S., Brown J. M., van Wagoner D., Fiocchi C., Rieder F., Immunol. Rev. 2021, 302, 211. - PMC - PubMed
    1. D'Haens G., Rieder F., Feagan B. G., Higgins P. D. R., Panés J., Maaser C., Rogler G., Löwenberg M., van der Voort R., Pinzani M., Peyrin‐Biroulet L., Danese S., Gastroenterology 2022, 162, 26. - PMC - PubMed
    1. Schulberg J. D., Wright E. K., Holt B. A., Hamilton A. L., Sutherland T. R., Ross A. L., Vogrin S., Miller A. M., Connell W. C., Lust M., Ding N. S., Moore G. T., Bell S. J., Shelton E., Christensen B., De Cruz P., Rong Y. J., Kamm M. A., Lancet Gastroenterol. Hepatol. 2022, 7, 318. - PubMed

LinkOut - more resources