. 2025 Feb;12(8):e2408751.
doi: 10.1002/advs.202408751. Epub 2024 Dec 31.

Inhibition of CDH11 Activates cGAS-STING by Stimulating Branched Chain Amino Acid Catabolism and Mitigates Lung Metastasis of Adenoid Cystic Carcinoma

Affiliations

Inhibition of CDH11 Activates cGAS-STING by Stimulating Branched Chain Amino Acid Catabolism and Mitigates Lung Metastasis of Adenoid Cystic Carcinoma

Rui-Feng Li et al. Adv Sci (Weinh). 2025 Feb.

Erratum in

Abstract

Salivary adenoid cystic carcinoma (SACC) is an intractable malignant tumor originates in the secretory glands and frequently metastasizes to the lungs. Hybrid epithelial-mesenchymal transition (EMT) cells within the tumors are correlated with augmented proliferative capacity and facilitation of lung metastasis. Single-cell RNA sequencing and spatial transcriptomic sequencing are employed to reveal the hybrid EMT subsets within the vascular fibroblast microenvironment. These hybrid EMT cells exhibit a pro-tumorigenic impact in vitro. Notably, cadherin 11 (CDH11), a specific marker for hybrid EMT cells, may exert its regulatory role in cellular function by interfering with branched-chain amino acids (BCAA) metabolism by inhibiting branched-chain ketoacid dehydrogenase to activate the mammalian target of the rapamycin pathway, thus making it a potential therapeutic target for SACC. Furthermore, celecoxib and its derivatives are specific CDH11 inhibitors that regulate BCAA metabolism, increase reactive oxygen species production, and subsequently activate the cyclic GMP-AMP synthase-stimulator of the interferongene pathway (cGAS-STING). They also inhibit lung metastasis in NOD-SCID mice in vivo. Overall, these findings suggest a promising treatment strategy that targets hybrid EMT cells to mitigate lung metastasis in SACC. Celecoxib may serve as a promising clinical intervention for the treatment of lung metastases in patients with SACC.

Keywords: adenoid cystic carcinoma; celecoxib; hybrid epithelial‐mesenchymal transforming cells; single‐cell transcriptome sequencing; spatial transcriptome sequencing; targeted therapy.


Conflict of interest statement

The authors declare no conflict of interest.

Figures
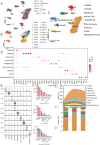
Figure 1
Figure 1
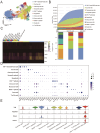
The infiltration of immune cells in SACC is comparatively diminished, particularly in solid‐type SACC. A) Uniform manifold approximation and projection (UMAP) analysis was performed on scRNA‐seq data from both SMG and SACC, with cells labeled by patient sample and histological type. The analysis included 23923 non‐solid SACC cells, 20469 solid SACC cells, and 7826 SMG cells. B) UMAP of scRNA‐seq cells recovered from both SMG and SACC labeled by cluster. Twenty clusters were identified after data combination and batch‐effect correction. C) UMAP of scRNA‐seq cells recovered from both SMG and SACC cells labeled by cell type. Twenty clusters were annotated with nine cell populations. D) Dot plot showing marker gene distributions across nine cell populations. E) Violin plots showing smoothed expression distribution of marker genes in nine cell populations. F) The number of differentially expressed genes (DEG) between groups within the same cell type. The quantification of differentially expressed genes within the same cell populations across distinct histological groups. G) The cell numbers and percentage frequencies of cell populations in scRNA‐seq data among different groups.
Figure 2
Figure 2
The immune function of SACC is impaired at bulk and single‐cell levels. A) CNV profiles inferred from scRNA‐seq of epithelial cells. Epithelial cells of SMG serve as a reference. B) Representative Gene Set Enrichment Analysis‐Gene Ontology (GSEA‐GO) enrichment pathways in DEG between SMG and SACC at the bulk level (nominal P‐value < 0.05, false discovery rate [FDR] < 0.1, sorted by the absolute value of normalized enrichment score (NES)). C) Heatmap showing Gene Set Variation Analysis (GSVA) results exploring the functional roles of different groups of epithelial cells. D,E) Representative GSEA‐GO enrichment pathways in differentially expressed genes of epithelial cells between SMG and SACC at a single‐cell level (nominal P‐value < 0.05, FDR < 0.1, sorted by the absolute value of NES). F) Representative GSEA‐GO enrichment pathways in DEG of immune cells between SMG and SACC at a single‐cell level (nominal P‐value < 0.05, FDR < 0.1, sorted by the absolute value of NES). G) Representative Gene Set Enrichment Analysis‐Kyoto Encyclopedia of Genes and Genomes (GSEA‐KEGG) enrichment pathways in differentially expressed genes of immune cells between SMG and SACC at a single‐cell level (nominal P‐value < 0.05, FDR < 0.1, sorted by the absolute value of NES).
Figure 3
Figure 3
Hybrid EMT cells are characterized by the upregulation of the gene expressions of PDGFRA, ITGA2, and CDH11. A) TheUMAP of epithelial subpopulations from both SMG and SACC labeled by cell type. The cell populations enclosed by dotted lines are hybrid EMT state cells. B) The cell number and percentage frequency of epithelial subpopulations in the scRNA‐seq data among different groups. C) The heatmap displays the expression levels of classical transcription factors that regulate EMT across different epithelial subpopulations. ZEB1, TWIST1, and SNAI1 have specific expression levels within the hybrid EMT state cell population. D) Dot plot showing marker gene distributions across the different epithelial subpopulations. E) Violin plot showing the expression of marker genes during hybrid EMT state cells, with PDGFRA, ITGA2, and CDH11 highly expressed in hybrid EMT state cells.
Figure 4
Figure 4
Hybrid EMT state cells reside in the vascular‐fibrous microenvironment and exhibit a pro‐tumorigenic impact. A) Enrichment scores of gene sets linked to immunoactivation, immunosuppression, and EMT across distinct epithelial subpopulations. B) The heatmap showing GSVA across different epithelial subpopulations. C) The spatial distribution score of epithelial cells in the four tumor samples: a higher score indicates a greater likelihood that the region is composed of epithelial cells. D) The top illustration depicts the composition and proportion of ST sequencing cell types and epithelial subsets. The bottom illustration demonstrates the composition and proportion of epithelial subsets surrounding the nerve invaded by the tumor, with a white triangle indicating the location of the nerve. E) The cell cycle analysis shows the percentage of cells in different cell cycle states of epithelial subpopulations. F) Hybrid EMT cells sorted using flow cytometry and cultured for 0, 24, 48, and 72 h. The cell proliferation was assessed with the CCK‐8 assay to calculate the relative rate. Mean ± standard error of the mean (SEM) is shown, *P < 0.05 using one‐way analysis of variance (ANOVA). G) Results of the clone formation experiment, which documented colonies consisting of a minimum of 50 cells. Mean ± SEM is shown, *P < 0.05 using one‐way ANOVA. H,I) Transwell assays performed to assess the cell migration and invasion: the number increases during the migration and invasion of hybrid EMT cells. Mean ± SEM is shown, *P < 0.05 using one‐way ANOVA. J) Hybrid EMT cells sorted using flow cytometry after they were cultured in low‐adhesion culture dishes, harvested after 48 h, and labeled with Annexin V‐FITC and Propidium Iodide (PI).
Figure 5
Figure 5
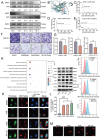
CDH11 acts as a biomarker for hybrid EMT state cells, playing a crucial role in promoting cell proliferation, migration, invasion, and anoikis resistance. A) The UMAP shows the expression distribution of CDH11 in epithelial cells, and CDH11 is highly expressed in hybrid EMT state cells. B) Efficiency of CDH11 overexpressed or knocked down by a plasmid or small interfering RNA (siRNA) in SACC‐83 cells measured on western blotting. C,D) CDH11‐overexpressed SACC‐83 cells analyzed for their migration and invasion ability using transwell assays. The number of migrated and invaded cells was counted (= 3, *< 0.05). Scale bar, 200 µm, Mean ± SEM is shown, *P < 0.05 using t test. E,F) CDH11‐overexpressed or ‐knockdown SACC‐83 cells cultured for 0, 24, 48, and 72 h, and cell proliferation determined using the CCK‐8 assay. Mean ± SEM is shown, *P < 0.05 using t test. G,H) CDH11‐knockdown SACC‐83 cells analyzed for their migration and invasion ability using transwell assays. The number of migrated and invaded cells was counted (= 3, *< 0.05). Scale bar, 200 µm, Mean ± SEM is shown, *P < 0.05 using t test. I) CDH11‐overexpressed or ‐knockdown SACC‐83 cells cultured in low‐adhesion culture dishes, harvested after 48 h, and labeled with Annexin V‐FITC and PI were subjected to flow cytometry. J) Volcano plot showing differentially expressed genes in SACC‐83 cells after CDH11 overexpression, as identified via RNA‐seq. K) Top 10 terms of GO enrichment pathways in SACC‐83 cells after CDH11 overexpression.
Figure 6
Figure 6
CDH11 disrupts the catabolism of BCAA leading to the activation of the mechanistic target of rapamycin pathway. A) The co‐immunoprecipitation assay demonstrates the interaction between CDH11 and BCKDHA, BCKDHB, and DBT proteins. B,C) Western blot showing increased phosphorylation levels of BCKDHE1α in CDH11‐overexpressed SACC‐83 cells. The results are reversed in CDH11‐knockdown cells. D) BCAA content in the culture medium shows no significant change after culturing SACC‐83 cells with CDH11 overexpression or knockdown for 24 h. = 3, Mean ± SEM is shown. *P < 0.05 using t test. E) BCAA content per million SACC‐83 cells exhibits an increase following 24 h of CDH11‐overexpressed cell culture. The results are reversed in CDH11‐knockdown cells. = 3, Mean ± SEM is shown, *P < 0.05 using t test. F) BCAA consumption per million SACC‐83 cells exhibits a decrease after culturing 24 h in CDH11‐overexpressed cells. The results are reversed in CDH11‐knockdown cells. = 3, Mean ± SEM is shown, *P < 0.05 using t test. G) RNA‐seq analysis shows an upregulation of ATP6V1B1 and rnf152 gene expression and a downregulation of TNF gene expression in SACC‐83 cells with CDH11 overexpression. H) Quantitative reverse transcription polymerase chain reaction (qRT‐PCR) analysis shows that overexpressing CDH11 in cells significantly increased the expression of EMT‐associated transcription factors. The results are reversed in CDH11‐knockdown cells. = 3, Mean ± SEM is shown, *P < 0.05 using t test. I) qRT‐PCR analysis reveals a significant upregulation of EMT‐associated genes in cells overexpressing CDH11. The results are reversed in CDH11‐knockdown cells. = 3, Mean ± SEM is shown, *P < 0.05 using t test. J) The Dissociation Constants (KD) of Celecoxib (CXB), Dimethylcelecoxib (DMC) and SD‐133 with the CDH11 protein detected by Surface plasmon resonance were 4.67e‐06, 1.09e‐05, and 2.74e‐05 M, respectively.
Figure 7
Figure 7
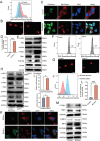
Combination of CXB/DMC/SD‐133 with CDH11 activates the cyclic GMP‐AMP synthase‐stimulator of the interferon gene (cGAS‐STING) pathway through ROS, suppressing cellular invasion and migration. A) Representative western blots of the cellular thermal shift assay showing increase in CDH11 thermostable performance in the presence of CXB, DMC, and SD‐133. B) SD‐133 with interactive residue side chains at the pocket are shown in stick rendering, with the inhibitors drawn in colorful. The polypeptide backbones are rendered as ribbons. The yellow broken lines indicate potential intermolecular hydrogen bonds, while the gray broken lines indicate pi‐cation interactions. C–E) Effect of CXB, DMC, and SD‐133 on the inhibition of SACC‐83 cells; normalized data and non‐linear regression curve fitting are shown. IC50 values are indicated. F) BCAA per million SACC‐83 cells exhibited a decrease 24 h after treatment with CXB, DMC, or SD‐133. Mean ± SEM is shown, *P < 0.05 using t test. G) SACC‐83 cells treated with CXB, DMC, or SD‐133 analyzed for their migration and invasion ability using transwell assays. Scale bar, 100 µm, = 3, Mean ± SEM is shown, *P < 0.05 using t test. H) Top 10 terms of GO enrichment analysis of DEG by RNA‐seq in SACC‐83 cells treated with SD133. I) Expression of cGAS‐STING pathway‐related proteins in SACC‐83 cells, treated with CXB, DMC, and SD 133, assessed using western blotting. J) Flow cytometry reveals an increase in reactive oxygen species (ROS) production after treatment with CXB, DMC, or SD‐133. K,L) Confocal microscopy showing the accumulation and quantification of cytosolic deoxyribonucleic acid (DNA) in SACC‐83 cells following treatment with CXB, DMC, or SD‐133. Double‐stranded DNA (dsDNA) visualized using PicoGreen staining (green), while MitoTracker (red) and DAPI (blue) employed to label mitochondria and nuclei, respectively. Scale bar, 5 µm. More than 100 cells were analyzed per group. = 10, Means ± SEM is shown. ***P < 0.001 using one‐way analysis of variance. M) Representative images of DNA comet assays of SACC‐83 cells subjected to treatment with CXB, DMC, or SD‐133.
Figure 8
Figure 8
Metabolism of BCAA increases the production of ROS, activating the cGAS‐STING pathway. A) Flow cytometry detected ROS production in SACC‐83 cells with CDH11 knockdown. B) Representative images of DNA comet assays of SACC‐83 cells subjected to various experimental conditions. Scale bar, 20 µm. C,D) Confocal microscopy showing the accumulation and quantification of cytosolic DNA in SACC‐83 cells under knockdown CDH11. dsDNA visualized using PicoGreen staining (green), while MitoTracker (red) and DAPI (blue) employed to label mitochondria and nuclei, respectively. Scale bar, 5 µm. More than 100 cells were analyzed per group. Mean ± SEM is shown. = 10, ***P < 0.001 using t test. E) Expression of cGAS‐STING pathway‐related proteins in SACC‐83 cells, treated under various experimental conditions, assessed using western blotting. F) Flow cytometry of SACC‐83 cells overexpressing CDH11 to evaluate the mitochondrial activity. G) Representative images of DNA comet assays of SACC‐83 cells subjected to various experimental conditions. Scale bar, 20 µm. H) Expression of cGAS‐STING pathway‐related proteins in SACC‐83 cells, treated under various experimental conditions, assessed using western blotting. I) qRT‐PCR analysis shows that CDH11‐knockdown cells significantly increase the expression of IFNB1. No significant difference in the overexpression group. = 3, Mean ± SEM is shown, *P < 0.05 using t test. J) Flow cytometry detected ROS production in BCAA‐ deprived or ‐added SACC‐83 cells. K,L) Confocal microscopy showing the accumulation and quantification of cytosolic DNA in BCAA‐deprived or ‐added SACC‐83 cells. dsDNA visualized using PicoGreen staining (green), while MitoTracker (red) and DAPI (blue) employed to label mitochondria and nuclei, respectively. Scale bar, 5 µm. More than 100 cells were analyzed per group. = 10, Mean ± SEM is shown. ***P < 0.001 using one‐way analysis of variance. M) The expression of cGAS‐STING pathway‐related proteins in SACC‐83 cells, treated under various experimental conditions, was assessed using western blotting.
Figure 9
Figure 9
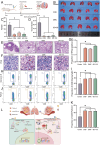
CXB, DMC, or SD‐133 treatment inhibited the lung metastasis of SACC in NOD‐SCID mice. A) Flow diagram of animal research procedures. B) The lungs of NOD‐SCID mice were examined macroscopically. C) Lung metastatic tumor nodules quantified in NOD‐SCID mice. = 5, Mean ± SEM is shown. *P < 0.05 using ANOVA. D) Quantification of the metastatic burden in NOD‐SCID mice. = 5, Mean ± SEM is shown. *P < 0.05 using one‐way ANOVA. E) Lung tissues of NOD‐SCID mice on hematoxylin and eosin staining. Scale bar, 100 µm. F,G) Representative immunohistochemical images and quantification of IFN‐β positive cells in lung metastasis sections from NOD‐SCID mice are presented. Scale bar, 20 µm. = 5, Mean ± SEM is shown. *P < 0.05 using one‐way ANOVA. H,I) The flow analysis diagram showed the change in proportions of Granzyme B+ cytotoxic T cells after drug stimulation. The experiments were performed three times for statistical analysis. = 3, Mean ± SEM is shown. *P < 0.05 using one‐way ANOVA. J,K) The flow analysis diagram showed the change in proportions of Perforin+ cytotoxic T cells after drug stimulation. The experiments were performed three times for statistical analysis. = 3, Mean ± SEM is shown. *P < 0.05 using one‐way ANOVA. L) Schematic diagram elucidating the activation of the cGAS‐STING pathway by celecoxib and its derivatives (By Figdraw, https://www.figdraw.com).

Similar articles

References

    1. Ho A. S., Ochoa A., Jayakumaran G., Zehir A., Valero Mayor C., Tepe J., Makarov V., Dalin M. G., He J., Bailey M., Montesion M., Ross J. S., Miller V. A., Chan L., Ganly I., Dogan S., Katabi N., Tsipouras P., Ha P., Agrawal N., Solit D. B., Futreal P. A., El Naggar A. K., Reis‐Filho J. S., Weigelt B., Ho A. L., Schultz N., Chan T. A., Morris L. G., J. Clin. Invest. 2019, 129, 4276. - PMC - PubMed
    1. Bjørndal K., Krogdahl A., Therkildsen M. H., Overgaard J., Johansen J., Kristensen C. A., Homøe P., Sørensen C. H., Andersen E., Bundgaard T., Primdahl H., Lambertsen K., Andersen L. J., Godballe C., Oral Oncol. 2011, 47, 677. - PubMed
    1. Vander Poorten V. L., Balm A. J., Hilgers F. J., Tan I. B., Loftus‐Coll B. M., Keus R. B., Hart A. A., Cancer 1999, 85, 2255. - PubMed
    1. Ciccolallo L., Licitra L., Cantú G., Gatta G., Oral Oncol. 2009, 45, 669. - PubMed
    1. Xu B., Drill E., Ho A., Ho A., Dunn L., Prieto‐Granada C. N., Chan T., Ganly I., Ghossein R., Katabi N., Am. J. Surg. Pathol. 2017, 41, 1422. - PMC - PubMed

MeSH terms

LinkOut - more resources