Oral administration of pioglitazone inhibits pulmonary hypertension by regulating the gut microbiome and plasma metabolome in male rats
- PMID: 39739369
- PMCID: PMC11685845
- DOI: 10.14814/phy2.70174
Oral administration of pioglitazone inhibits pulmonary hypertension by regulating the gut microbiome and plasma metabolome in male rats
Abstract
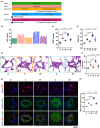
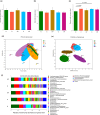
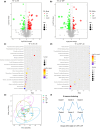
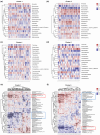
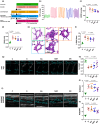
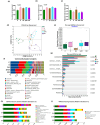
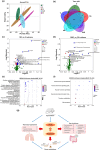
The oral administrated thiazolidinediones (TZDs) have been widely reported to alleviate experimental pulmonary hypertension (PH). However, previous studies mainly focused on their beneficial effects on the cardiopulmonary vascular system but failed to determine their potential roles on gut microenvironment. This study aims to investigate the effects of pioglitazone, an oral TZD drug, on gut microbiome in classic PH rat models induced by hypoxia (HPH) or SU5416/hypoxia (SuHx-PH) and evaluate the therapeutic potential of supplementation of selective probiotics for experimental PH. Pioglitazone remarkably inhibited the PH pathogenesis in both models and reshaped the gut microbiome and plasma metabolome. Correlation analyses represented strong and unique association between the protective metabolites and bacteria genera (Roseburia, Lactobacillus, and Streptococcus) that were positively stimulated by pioglitazone. Supplementation of selective probiotics Roseburia intestinalis (R. intestinalis) partially attenuated SuHx-PH and rebuilt a novel gut microbiome and host metabolome. This study reports for the first time that oral administration of pioglitazone protects PH by regulating the gut microbiome and host metabolome, providing novel insights for the TZD drugs. The data also supports that modulation of gut microbiota by supplementation of selective probiotics could be a novel effective therapeutic strategy for the treatment of PH.
Keywords: gut microbiome; peroxisome proliferator‐activated receptor gamma; pioglitazone; plasma metabolome; pulmonary hypertension.
© 2024 The Author(s). Physiological Reports published by Wiley Periodicals LLC on behalf of The Physiological Society and the American Physiological Society.
Conflict of interest statement
The authors declare none competing interests.
Figures
Similar articles
-
Lactobacillus helveticus R0052 alleviates liver injury by modulating gut microbiome and metabolome in D-galactosamine-treated rats.Appl Microbiol Biotechnol. 2019 Dec;103(23-24):9673-9686. doi: 10.1007/s00253-019-10211-8. Epub 2019 Nov 12. Appl Microbiol Biotechnol. 2019. PMID: 31713675
-
Microbiome and metabolome dysbiosis of the gut-lung axis in pulmonary hypertension.Microbiol Res. 2022 Dec;265:127205. doi: 10.1016/j.micres.2022.127205. Epub 2022 Sep 21. Microbiol Res. 2022. PMID: 36202007
-
Disease-associated gut microbiome and metabolome changes in rats with chronic hypoxia-induced pulmonary hypertension.Front Cell Dev Biol. 2024 Jul 12;12:1022181. doi: 10.3389/fcell.2024.1022181. eCollection 2024. Front Cell Dev Biol. 2024. PMID: 39071798 Free PMC article.
-
Oral iron supplementation: Potential implications for the gut microbiome and metabolome in patients with CKD.Hemodial Int. 2017 Jun;21 Suppl 1:S28-S36. doi: 10.1111/hdi.12553. Epub 2017 Mar 22. Hemodial Int. 2017. PMID: 28328083 Review.
-
Does the Gut Microbial Metabolome Really Matter? The Connection between GUT Metabolome and Neurological Disorders.Nutrients. 2022 Sep 24;14(19):3967. doi: 10.3390/nu14193967. Nutrients. 2022. PMID: 36235622 Free PMC article. Review.
References
-
- Bar, N. , Korem, T. , Weissbrod, O. , Zeevi, D. , Rothschild, D. , Leviatan, S. , Kosower, N. , Lotan‐Pompan, M. , Weinberger, A. , Le Roy, C. I. , Menni, C. , Visconti, A. , Falchi, M. , Spector, T. D. , Adamski, J. , Franks, P. W. , Pedersen, O. , & Segal, E. (2020). A reference map of potential determinants for the human serum metabolome. Nature, 588, 135–140. - PubMed
-
- Byndloss, M. X. , Olsan, E. E. , Rivera‐Chávez, F. , Tiffany, C. R. , Cevallos, S. A. , Lokken, K. L. , Torres, T. P. , Byndloss, A. J. , Faber, F. , Gao, Y. , Litvak, Y. , Lopez, C. A. , Xu, G. , Napoli, E. , Giulivi, C. , Tsolis, R. M. , Revzin, A. , Lebrilla, C. B. , & Bäumler, A. J. (2017). Microbiota‐activated PPAR‐γ signaling inhibits dysbiotic Enterobacteriaceae expansion. Science, 357, 570–575. - PMC - PubMed
-
- Chua, H. H. , Chou, H. C. , Tung, Y. L. , Chiang, B. L. , Liao, C. C. , Liu, H. H. , & Ni, Y. H. (2018). Intestinal dysbiosis featuring abundance of Ruminococcus gnavus associates with allergic diseases in infants. Gastroenterology, 154, 154–167. - PubMed
MeSH terms
Substances
Grants and funding
LinkOut - more resources
Full Text Sources
Medical
Molecular Biology Databases

