. 2024 Dec;132(12):127006.
doi: 10.1289/EHP15684. Epub 2024 Dec 31.

Two Hits of EDCs Three Generations Apart: Evaluating Multigenerational Anxiety-Like Behavioral Phenotypes in Male Rats Exposed to Aroclor 1221 and Vinclozolin

Affiliations

Two Hits of EDCs Three Generations Apart: Evaluating Multigenerational Anxiety-Like Behavioral Phenotypes in Male Rats Exposed to Aroclor 1221 and Vinclozolin

Emily N Hilz et al. Environ Health Perspect. 2024 Dec.

Abstract

Background: Increasing evidence supports an association of endocrine-disrupting chemical (EDC) exposures with adverse biological effects in humans and wildlife. Recent studies reveal that health consequences of environmental exposures may persist or emerge across generations. This creates a dual conundrum: that we are exposed to contemporary environmental chemicals overlaid upon the inheritance of our ancestors' exposure profiles. Even when legacy EDCs are phased out, they may remain relevant due to persistence in the environment together with intergenerational inheritance of their adverse biological effects. Thus, we all possess a body burden of legacy contaminants, and we are also increasingly exposed to new generations of EDCs.

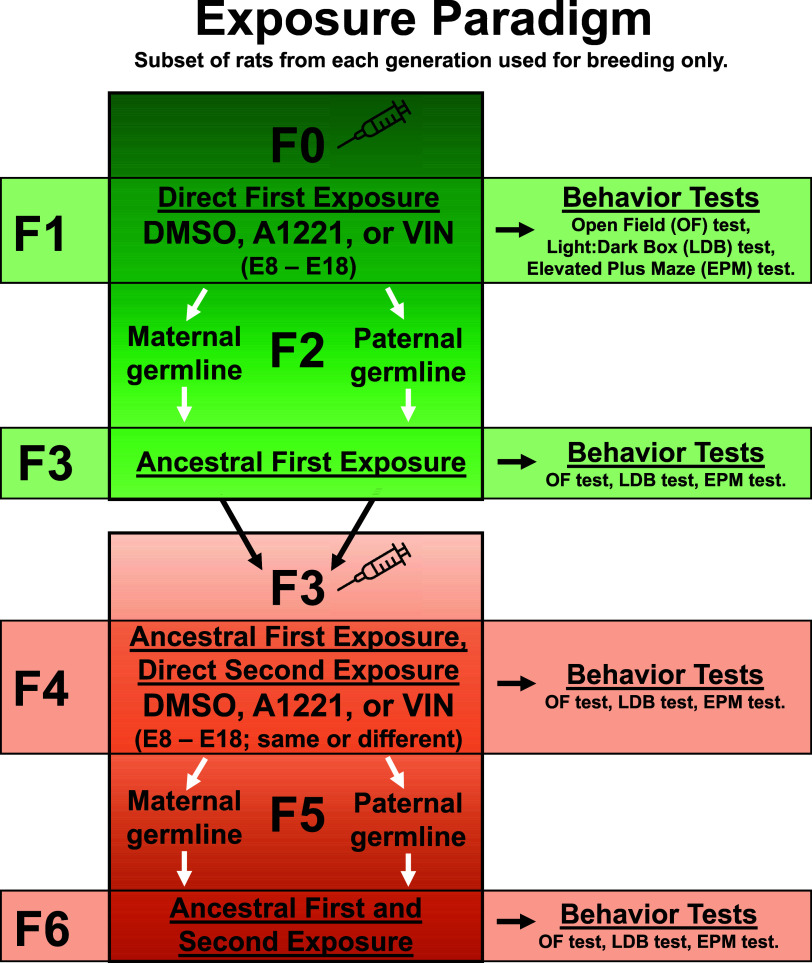
Objectives: We assessed the effects of direct and ancestral exposures to EDCs across six generations on anxiety-like behaviors in male rats using our "two hits, three generations apart" multigenerational EDC exposure experimental model. We investigated two classes of EDCs with distinct hormonal actions and historical use-the weakly estrogenic polychlorinated biphenyl (PCB) mixture Aroclor 1221 (A1221) and the anti-androgenic fungicide vinclozolin (VIN)-in both the maternal and paternal line. We also determined if a hormonal mechanism drives these effects across generations.

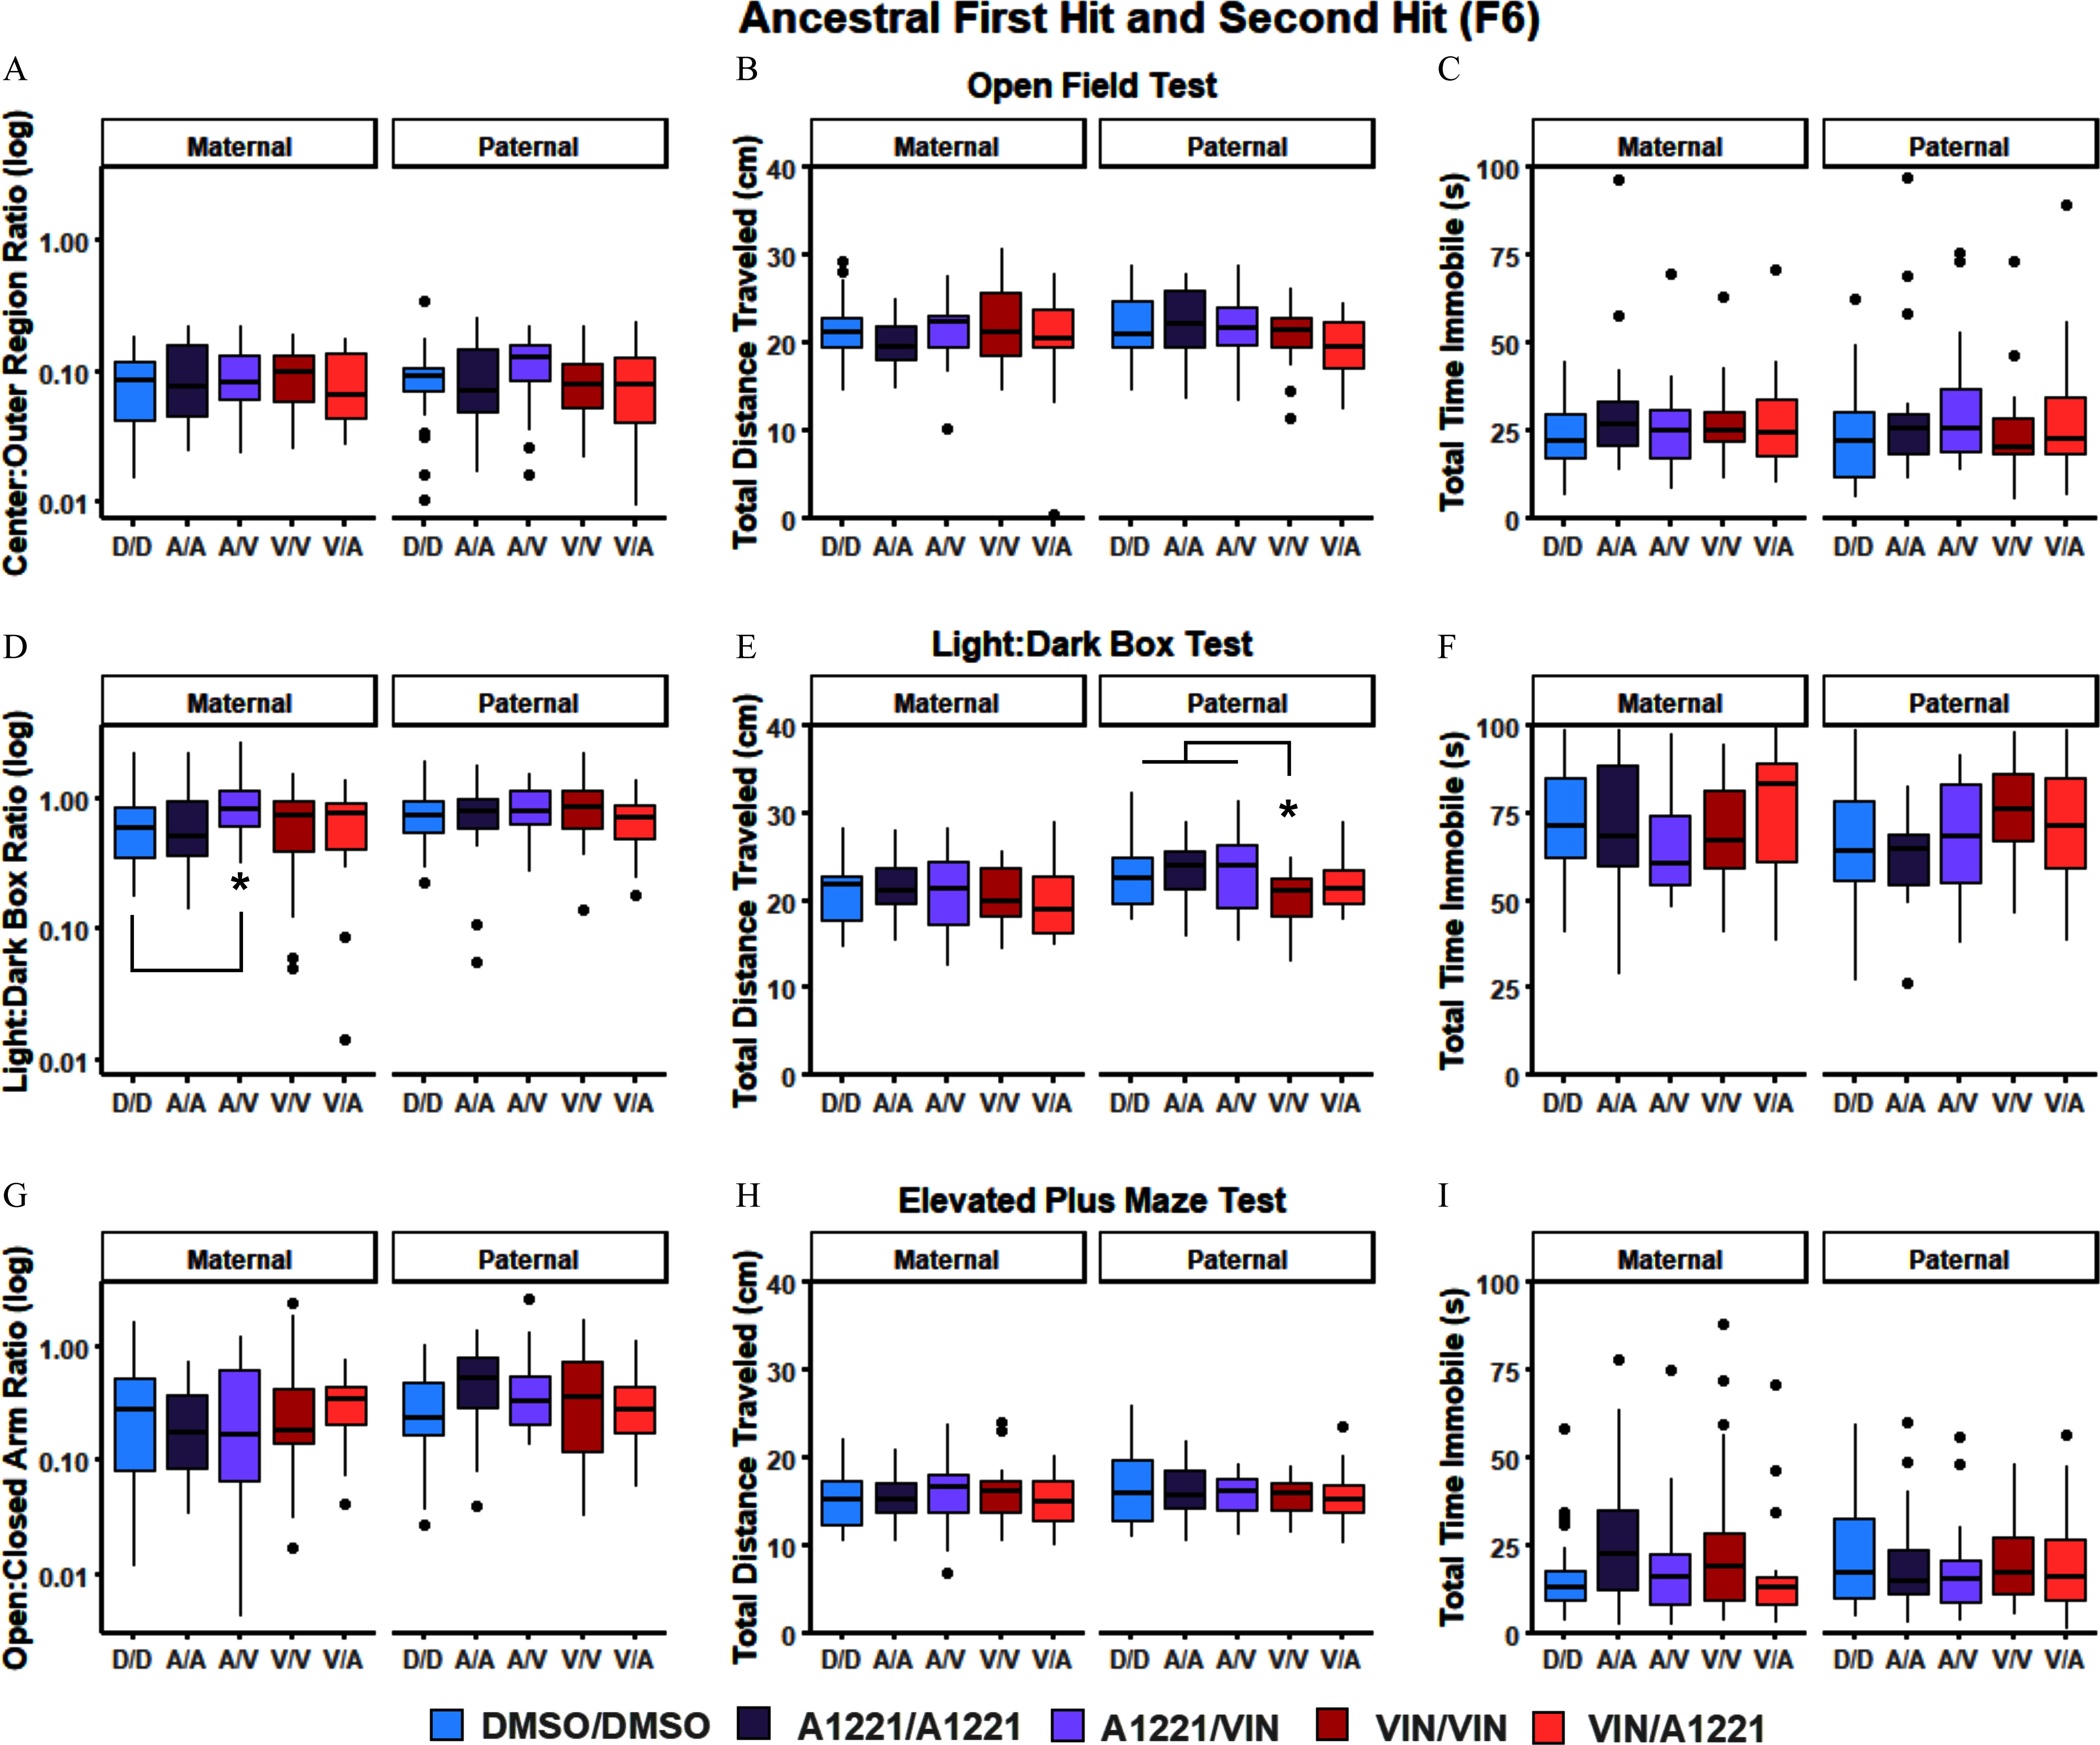
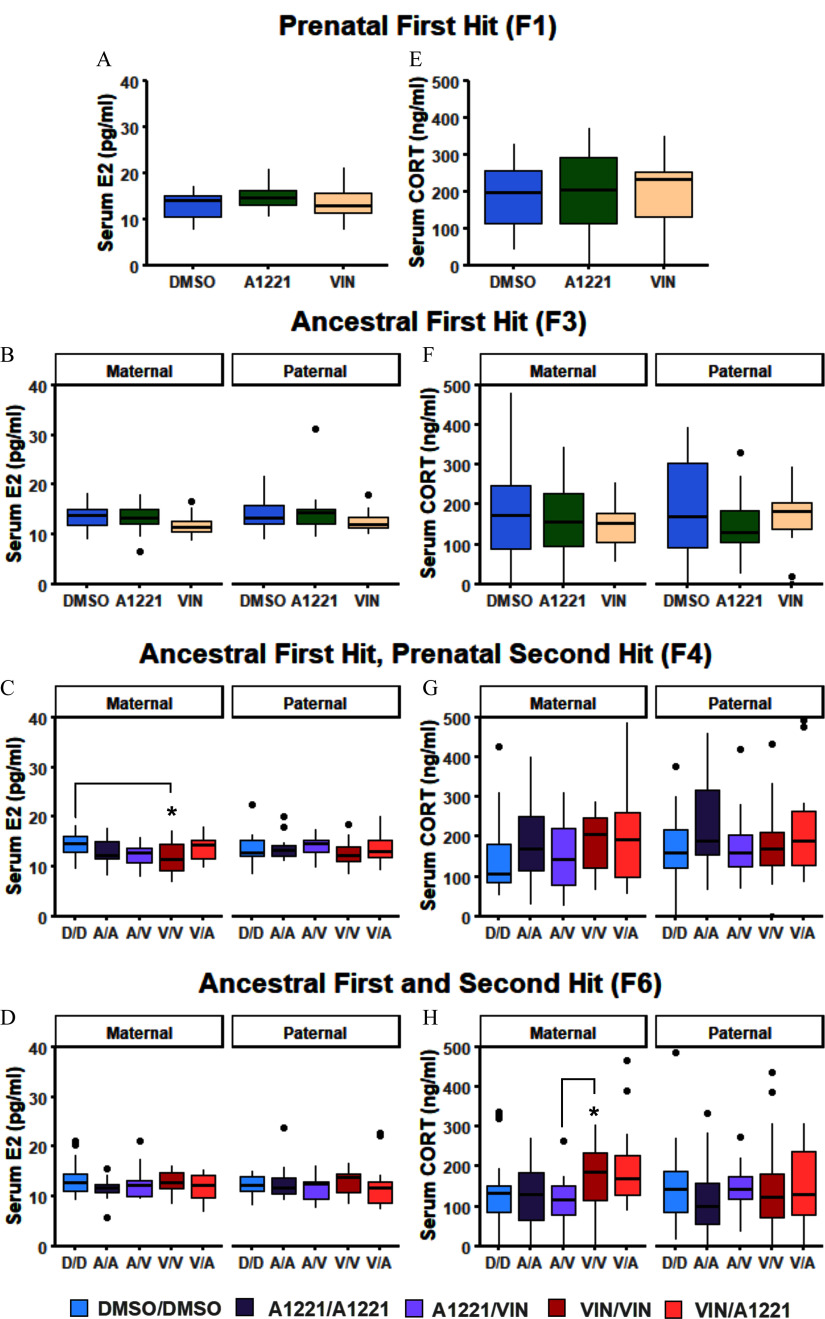
Methods: Rats were gestationally exposed to A1221, VIN, or vehicle [dimethyl sulfoxide (DMSO)] in the F1 generation. Three generations later, the F4 generation was given the same or a different exposure. Anxiety-like behavior was measured in the open field test, light:dark box, and elevated plus maze across generations. Serum was collected at the end of the experiment, and concentrations of estradiol and corticosterone were analyzed.

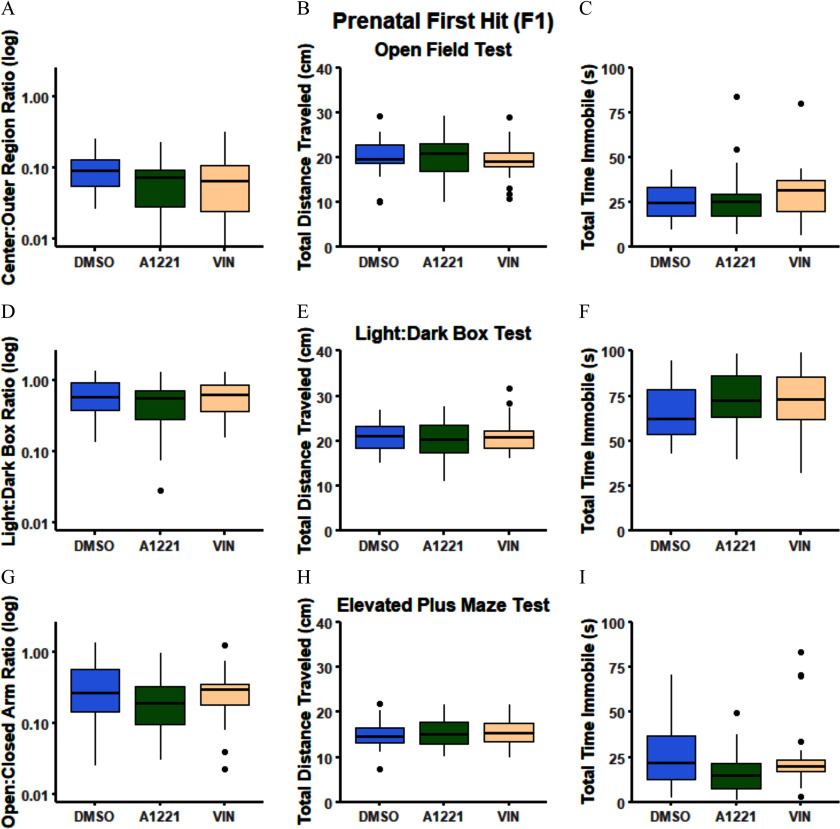
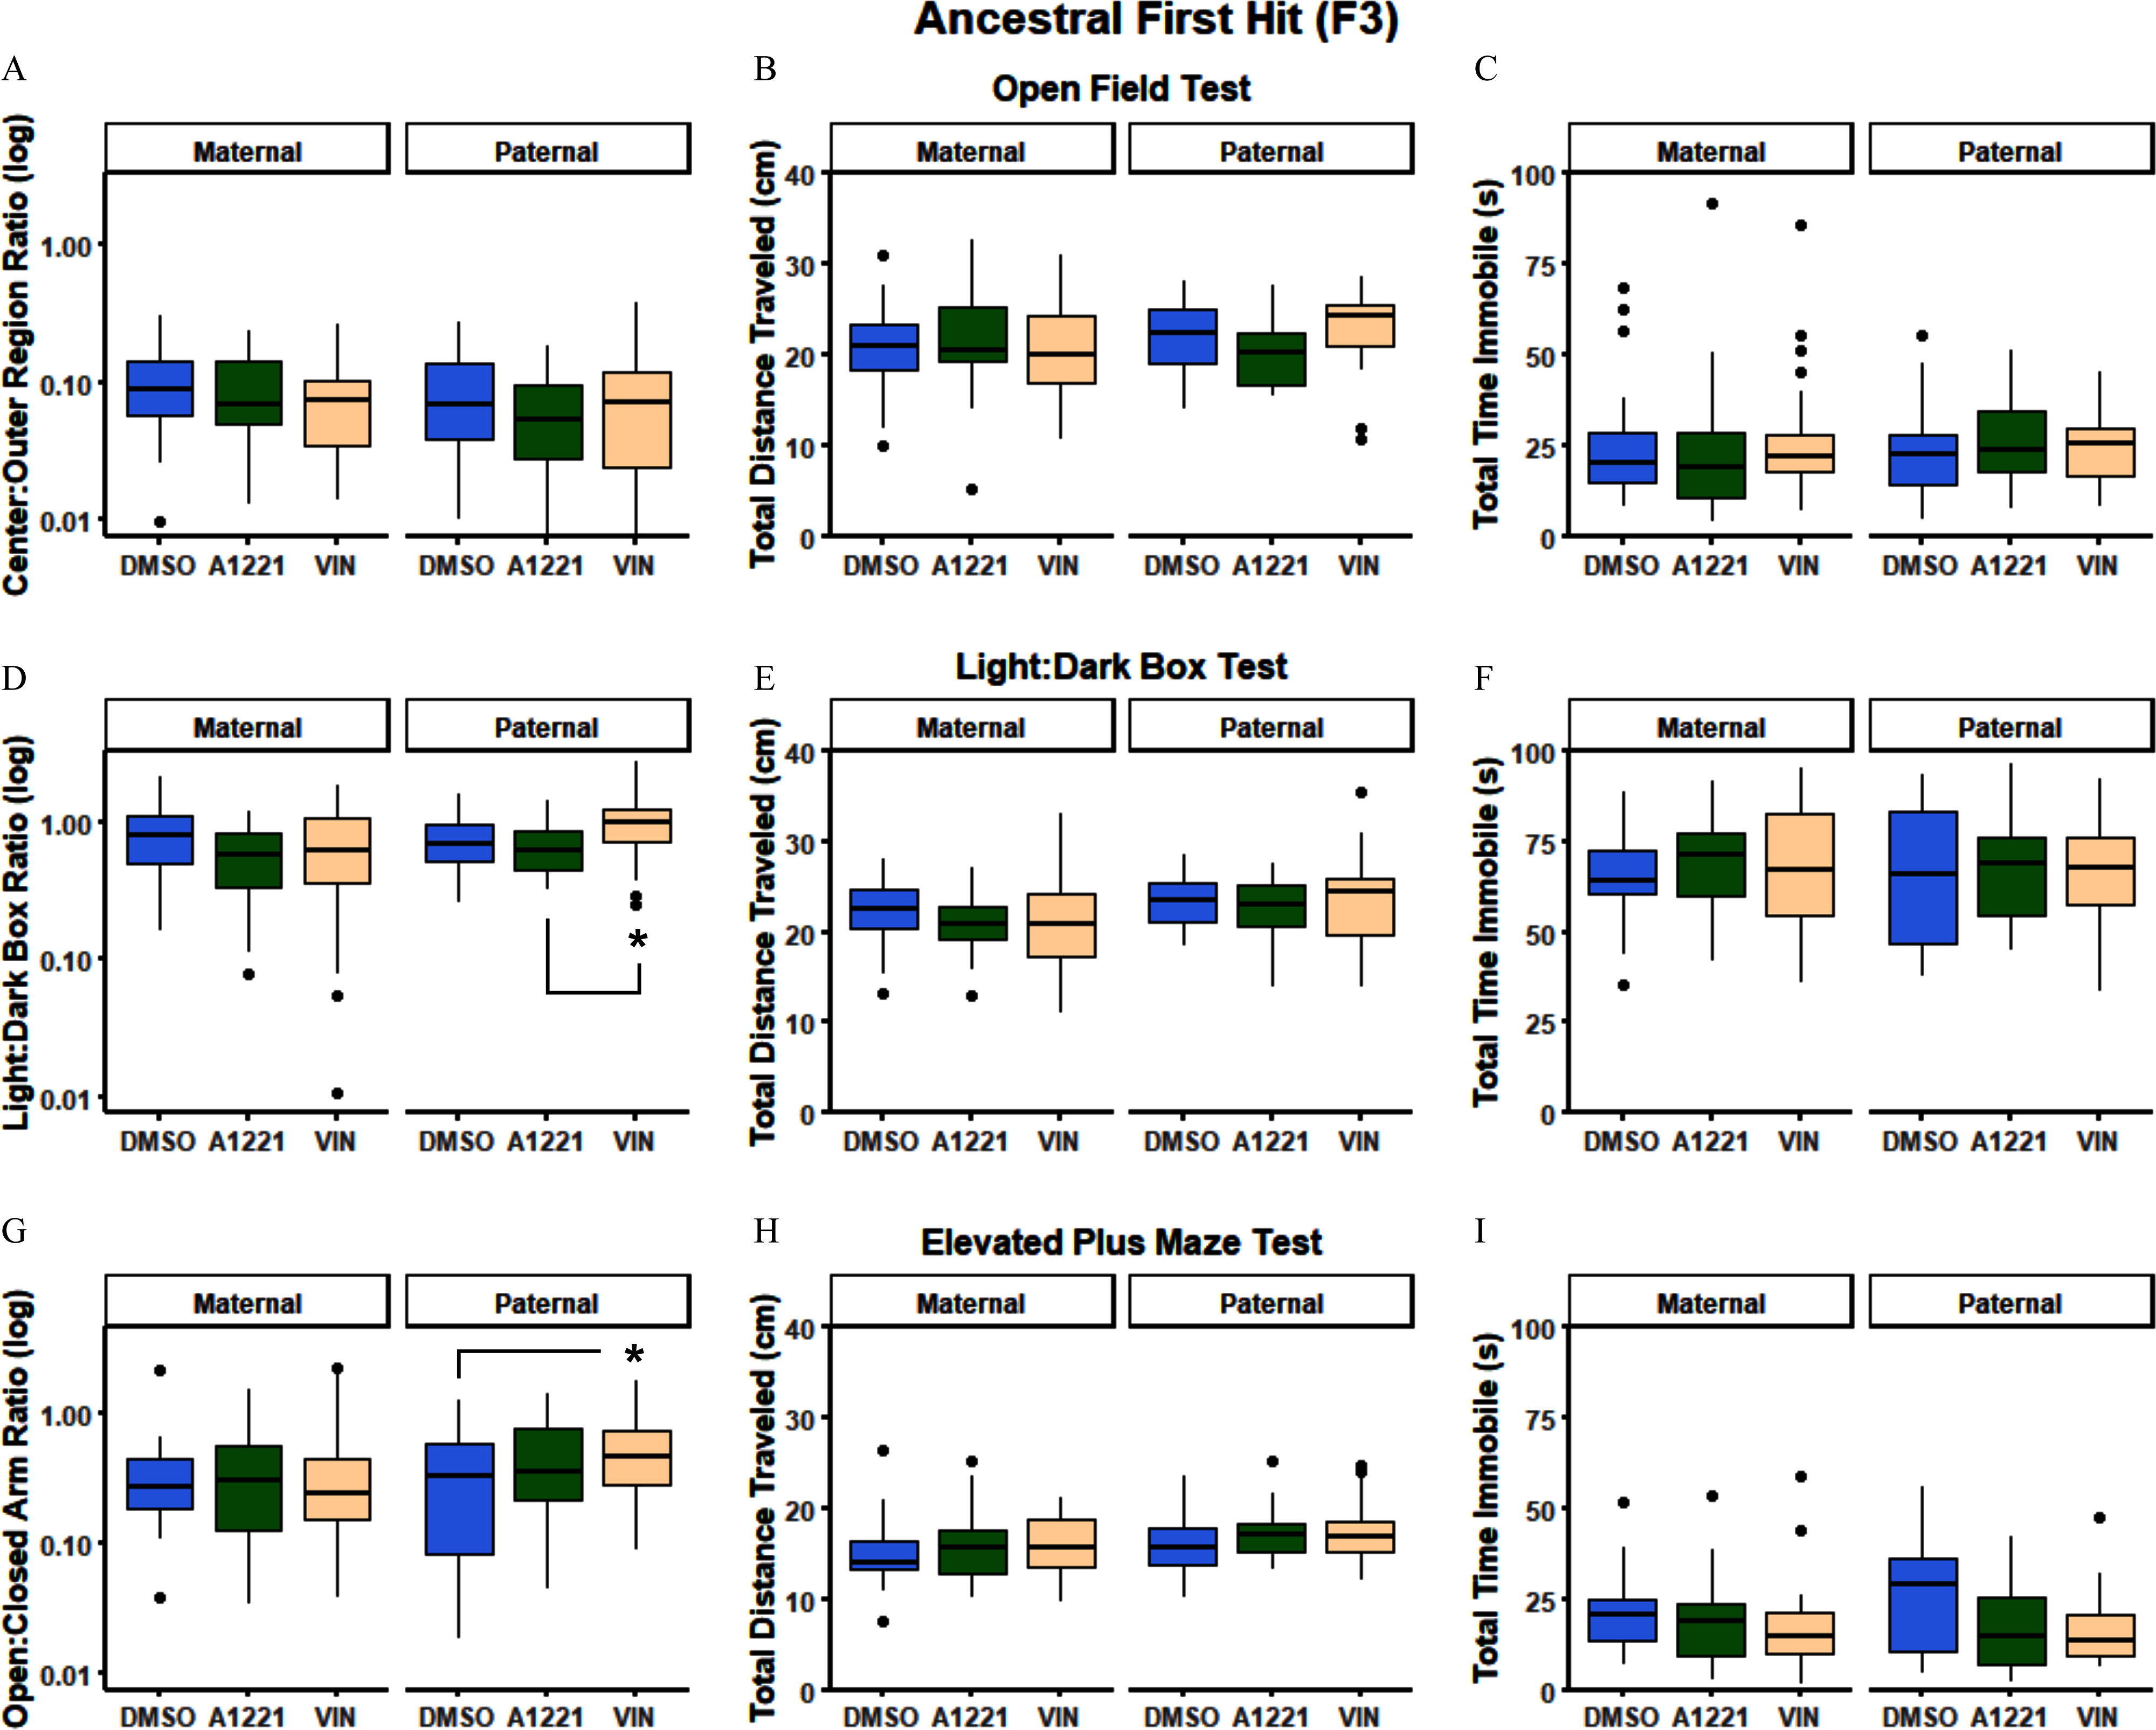
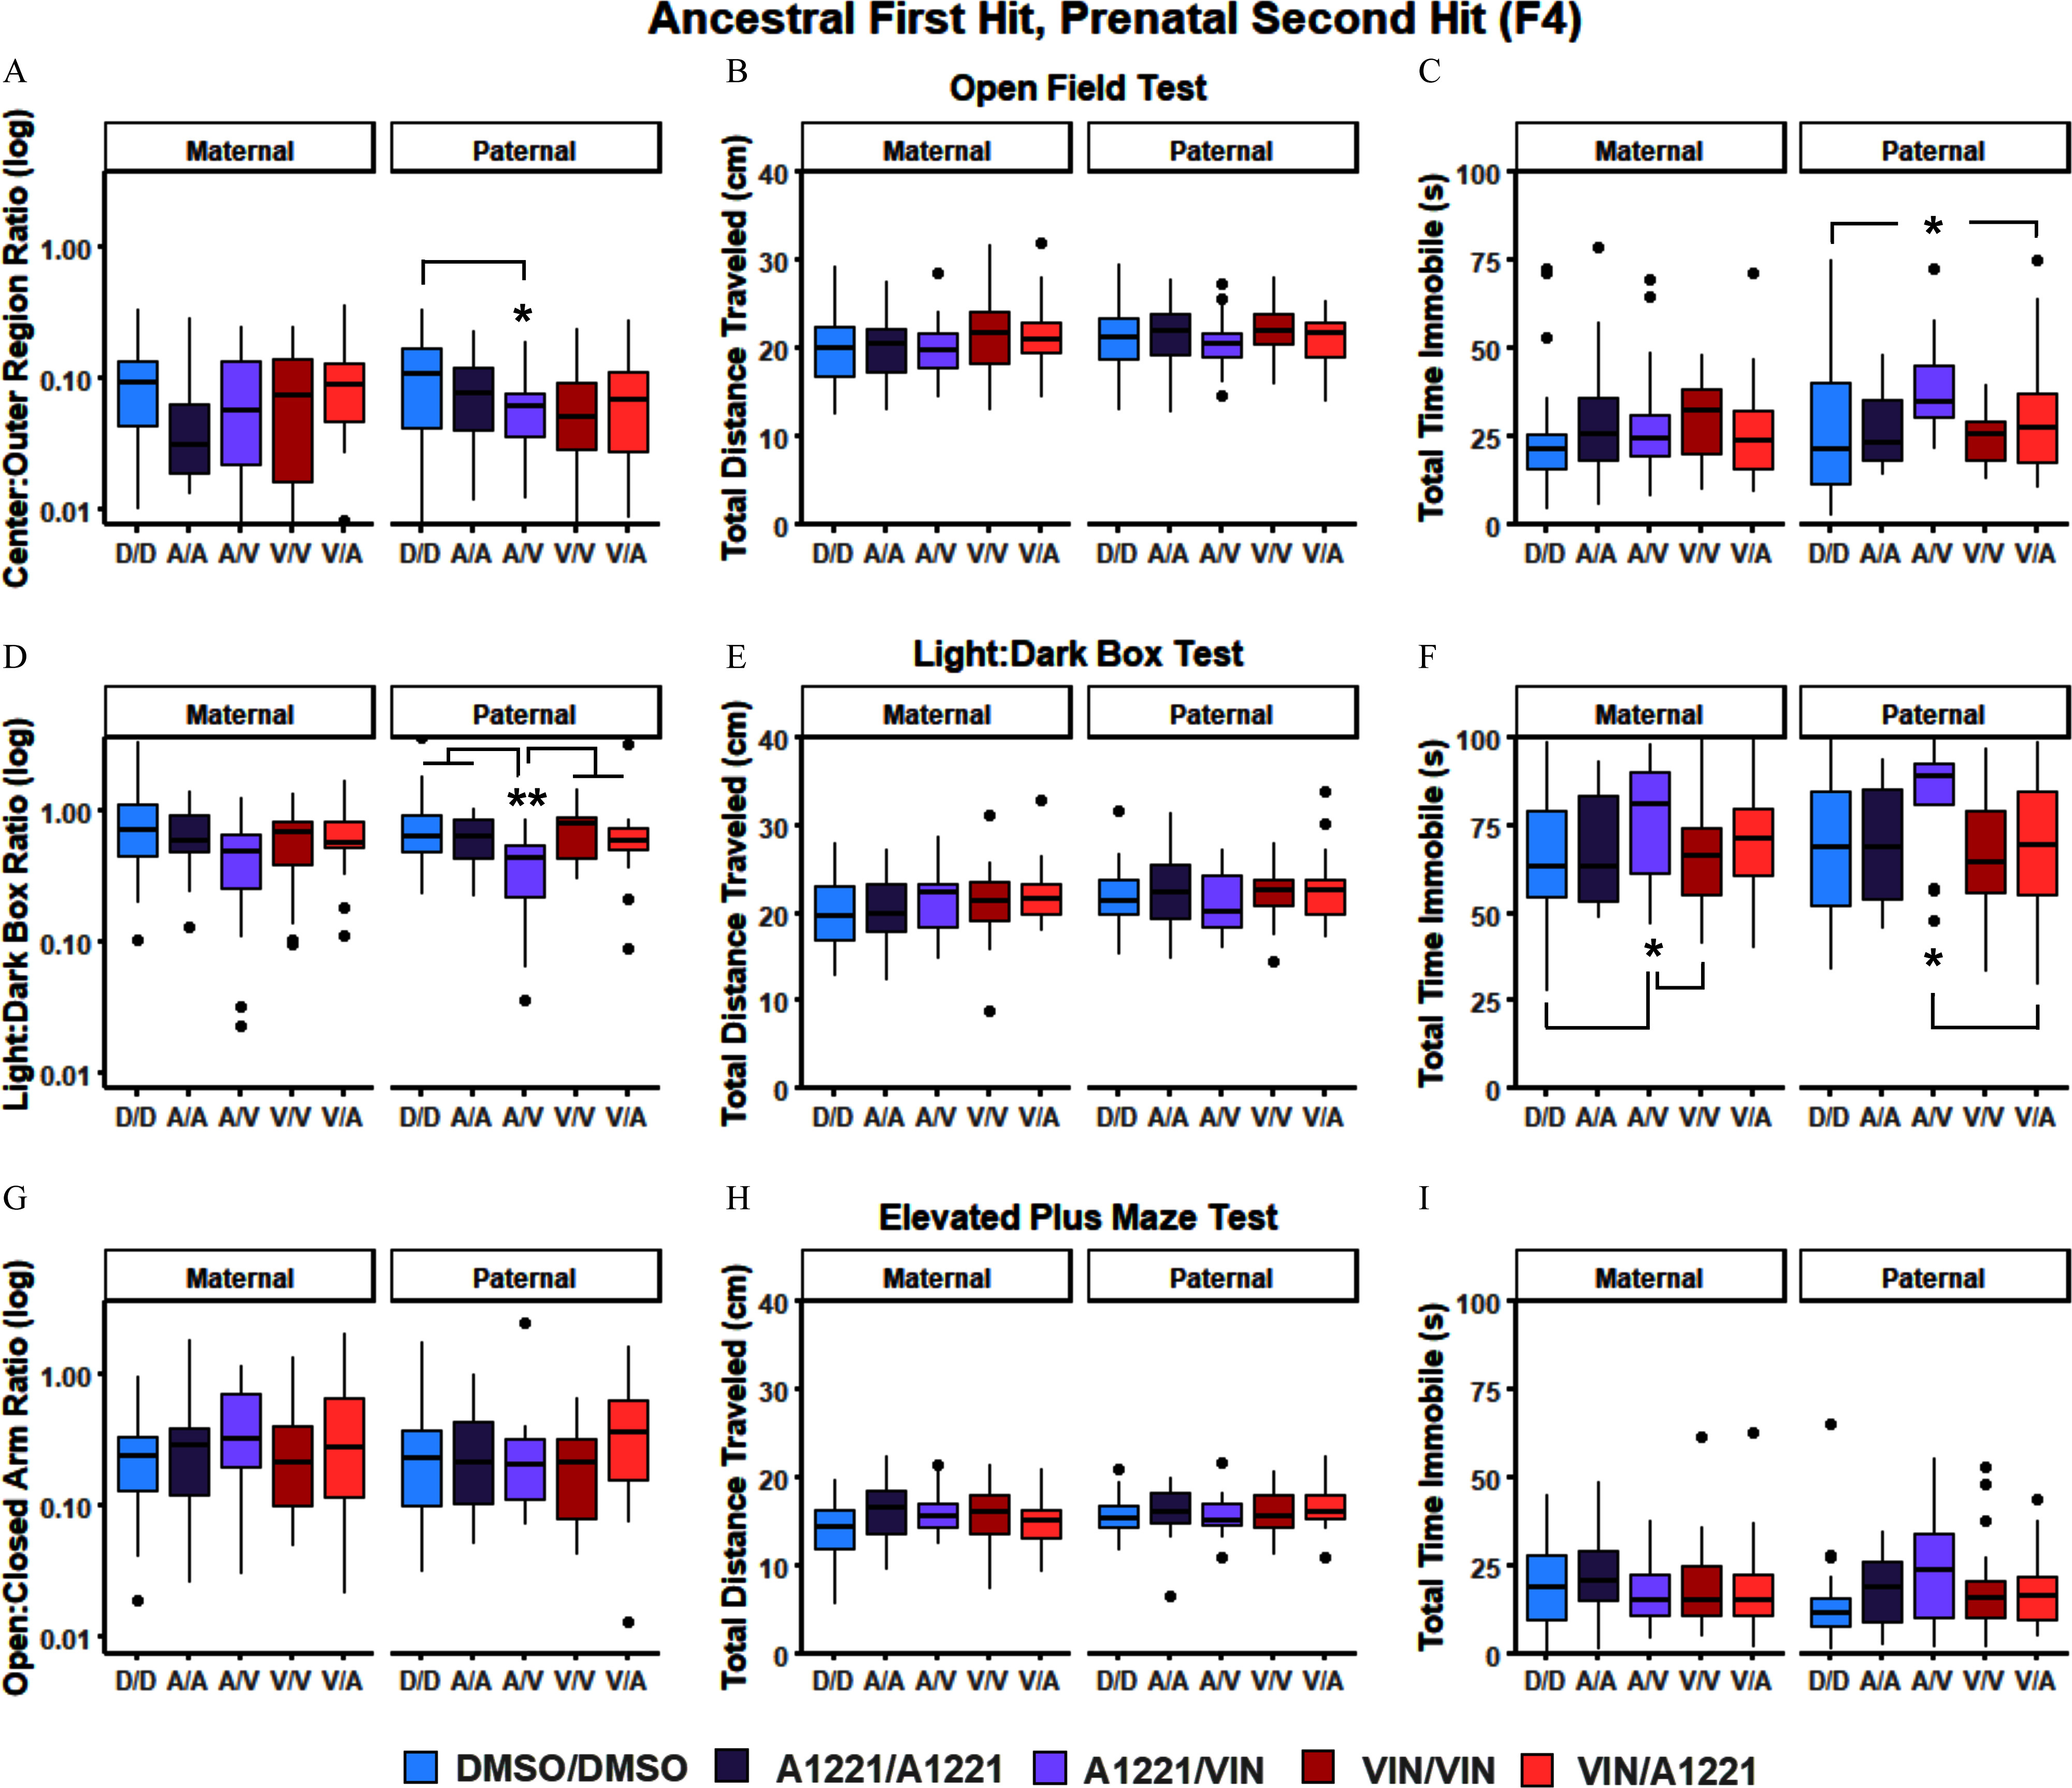
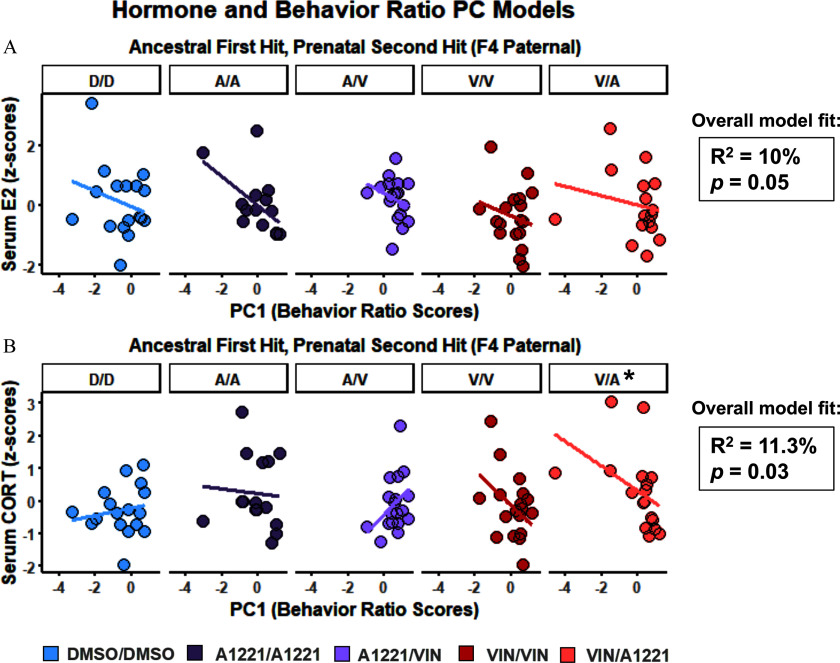
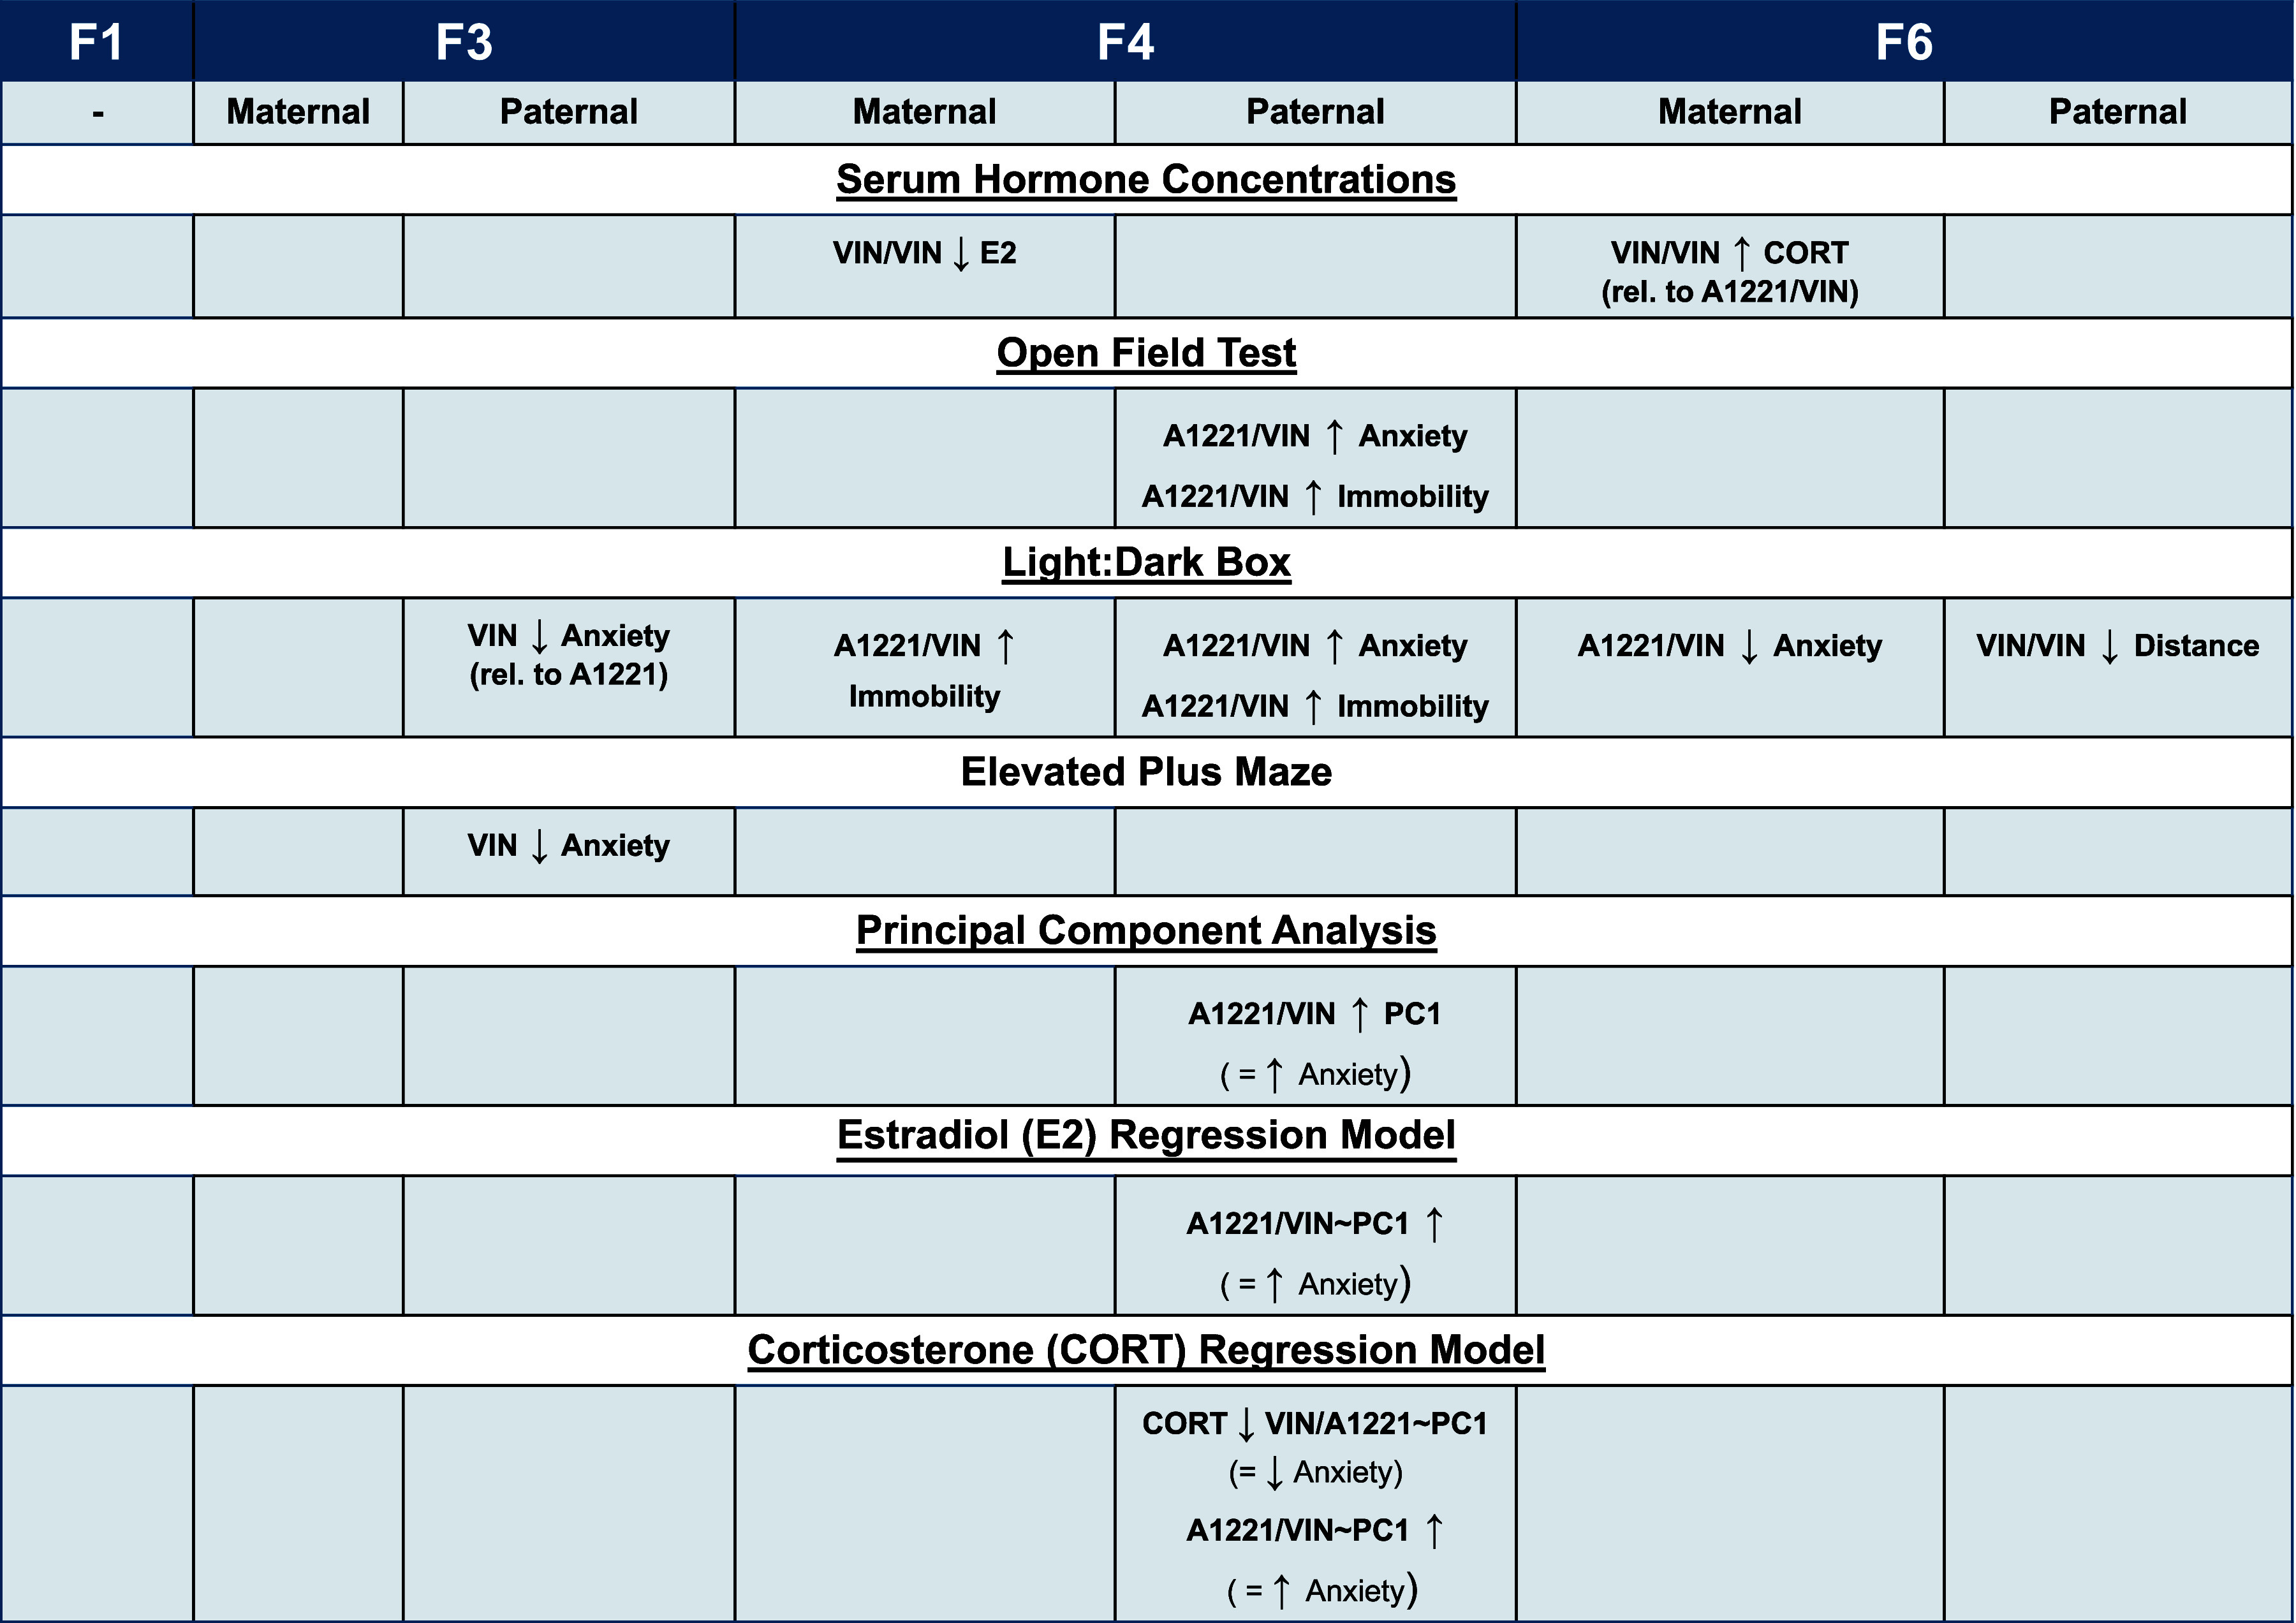
Results: Although direct exposure did not affect behavior in F1 males, ancestral exposure to VIN decreased anxiety-like behavior in the F3 paternal line compared to vehicle. In the F4 paternal line, ancestral A1221 followed by direct exposure to VIN increased anxiety-like behavior compared to controls. In the F6 maternal line, relative to vehicle, the double ancestral hits of A1221/VIN decreased anxiety-like behavior. Serum hormones weakly predicted behavioral changes in the F4 paternal line and were modestly affected in the F4 and F6 maternal lines.

Discussion: Our data suggest that anxiety-like behavioral phenotypes emerge transgenerationally in male rats in response to EDC exposure and that multiple hits of either the same or a different EDC can increase the impact in a lineage-specific manner. https://doi.org/10.1289/EHP15684.


Figures

Figure 1 is a flowchart titled Exposure Paradigm, subset of rats from each generation used for breeding that has seven steps. Step 1: F 0: the rats are exposed. Step 2: F 1: direct first exposure. Dimethyl sulfoxide, Aroclor 1221, or vinclozolin (E 8 to E 18). The behavior tests include the open field test, the light or dark box test, and the elevated plus maze test. Step 3: F 2: It includes maternal and paternal germline. Step 4: F 3: Ancestral first exposure. The behavior tests include the open field test, the light or dark box test, and the elevated plus maze test. Step 5: F 4: Ancestral first exposure, direct second exposure. Dimethyl sulfoxide, Aroclor 1221, or vinclozolin (E 8 to E 18; same or different). The behavior tests include the open field test, the light or dark box test, and the elevated plus maze test. Step 6: F 5: It includes maternal and paternal germline. Step 7: F 6: Ancestral first and second exposure. The behavior tests include the open field test, the light or dark box test, and the elevated plus maze test.
Figure 1.
EDC exposure timeline. Semitranslucent boxes indicate generations (F1, F3, F4, F6) in which behavior was assessed. Rats in the F1 generation were prenatally exposed to DMSO (vehicle), Aroclor 1221 (A1221), or vinclozolin (VIN) from embryonic day (E) 8–18. This exposure was carried on via the maternal or paternal germline to create the ancestrally exposed F3 generation. A subset of F3 females (to breed with control males) or control females (to breed with F3 males) were prenatally exposed to either the same or a different combination of DMSO, A1221, or VIN, and this was carried on via the maternal or paternal germline to create the double ancestrally exposed F6 generation. Note: DMSO, dimethyl sulfoxide.
Figures 2A to 2I are box and whisker plots titled Prenatal first hit (F 1). On the top, the three box and whiskers plots measure center: outer region ratio (log), ranging from 0.01 to 0.10 in increments 0.09 and 0.10 to 1.00 in increments of 0.9; total distance traveled (centimeters), ranging from 0 to 40 in increments of 10; and total time immobile (seconds), ranging from 0 to 100 in increments of 25 (y-axis) across Dimethyl sulfoxide, Aroclor 1221, and vinclozolin (x-axis) for open field test. At the center, the three box and whiskers plots measure Light: Dark box ratio (log), ranging from 0.01 to 0.10 in increments 0.09 and 0.10 to 1.00 in increments of 0.9; total distance traveled (centimeters), ranging from 0 to 40 in increments of 10; and total time immobile (seconds), ranging from 0 to 100 in increments of 25 (y-axis) across Dimethyl sulfoxide, Aroclor 1221, and vinclozolin (x-axis) for Light:Dark box test. At the bottom, the three box and whiskers plots measure open: closed arm ratio (log), ranging from 0.01 to 0.10 in increments 0.09 and 0.10 to 1.00 in increments of 0.9; total distance traveled (centimeters), ranging from 0 to 40 in increments of 10; and total time immobile (seconds), ranging from 0 to 100 in increments of 25 (y-axis) across Dimethyl sulfoxide, Aroclor 1221, and vinclozolin (x-axis) for elevated plus maze test.
Figure 2.
Boxplots of behavioral data from F1 male rats with maternal or paternal prenatal exposure to the vehicle control DMSO, A1221, or vinclozolin (VIN). Horizontal lines represent median score, boxes represent upper and lower quartiles, vertical whiskers represent the spread of datapoints outside of the upper and lower quartiles, and points are datapoints that fall 1.5× above or below the main distribution. Ratios of time spent in aversive compared to less aversive regions from each test (A,D,G) are shown on a logarithmic scale to maintain comparable y-axes across tests. There were no differences in behavioral metrics across EDC exposure groups compared to controls. Summary data can be found in Excel Table S1. Note: A1221, Aroclor 1221; DMSO, dimethyl sulfoxide.
Figures 3A to 3I are box and whisker plots titled Ancestral first hit (F 3). On the top, the three box and whiskers are titled open field test, plotting center: outer region ratio (log), ranging from 0.01 to 0.10 in increments 0.09 and 0.10 to 1.00 in increments of 0.9; total distance traveled (centimeters), ranging from 0 to 40 in increments of 10; and total time immobile (seconds), ranging from 0 to 100 in increments of 25 (y-axis) across Dimethyl sulfoxide, Aroclor 1221, and vinclozolin (x-axis) for maternal and paternal. At the center, the three box and whiskers are titled Light:Dark box test, plotting light: dark box ratio (log), ranging from 0.01 to 0.10 in increments 0.09 and 0.10 to 1.00 in increments of 0.9; total distance traveled (centimeters), ranging from 0 to 40 in increments of 10; and total time immobile (seconds), ranging from 0 to 100 in increments of 25 (y-axis) across Dimethyl sulfoxide, Aroclor 1221, and vinclozolin (x-axis) for maternal and paternal. At the bottom, the three box and whiskers are titled elevated plus maze test, plotting open: closed arm ratio (log), ranging from 0.01 to 0.10 in increments 0.09 and 0.10 to 1.00 in increments of 0.9; total distance traveled (centimeters), ranging from 0 to 40 in increments of 10; and total time immobile (seconds), ranging from 0 to 100 in increments of 25 (y-axis) across Dimethyl sulfoxide, Aroclor 1221, and vinclozolin (x-axis) for maternal and paternal.
Figure 3.
Boxplots of behavioral data from F3 male rats with maternal or paternal ancestral exposure to the vehicle control DMSO, A1221, or vinclozolin (VIN). Horizontal lines represent median score, boxes represent upper and lower quartiles, vertical whiskers represent the spread of datapoints outside of the upper and lower quartiles, and points are datapoints that fall 1.5× above or below the main distribution. Ratios of time spent in aversive compared to less aversive regions from each test (A,D,G) are shown on a logarithmic scale to maintain comparable y-axes across tests. In the light:dark box test, F3 paternal VIN-exposed rats spent a higher ratio of time in the light box compared to A1221-exposed rats [*, Tukey HSD, p=0.05 (D)]. In the elevated plus maze test, F3 paternal VIN-exposed rats spent a lower ratio of time in the open arms compared to DMSO controls [*, Tukey HSD, p=0.05 (G)]. Summary data can be found in Excel Table S2. Note: A1221, Aroclor 1221; DMSO, dimethyl sulfoxide.
Figures 4A to 4I are box and whisker plots titled Ancestral first hit, Prenatal second hit (F 4). On the top, the three box and whiskers are titled maternal and paternal under open field test, plotting center: outer region ratio (log), ranging from 0.01 to 0.10 in increments 0.09 and 0.10 to 1.00 in increments of 0.9; total distance traveled (centimeters), ranging from 0 to 40 in increments of 10; and total time immobile (second), ranging from 0 to 100 in increments of 25 (y-axis) across Dimethyl sulfoxide by Dimethyl sulfoxide, Aroclor 1221 by Aroclor 1221, Aroclor 1221 by vinclozolin, vinclozolin by vinclozolin, vinclozolin by Aroclor 1221 (x-axis) for Dimethyl sulfoxide by Dimethyl sulfoxide, Aroclor 1221 by Aroclor 1221, Aroclor 1221 by vinclozolin, vinclozolin by vinclozolin, vinclozolin by Aroclor 1221. At the center, the three box and whiskers are titled maternal and paternal under Light:Dark box test, plotting light: dark box ratio (log), ranging from 0.01 to 0.10 in increments 0.09 and 0.10 to 1.00 in increments of 0.9; total distance traveled (centimeters), ranging from 0 to 40 in increments of 10; and total time immobile (seconds), ranging from 0 to 100 in increments of 25 (y-axis) across Dimethyl sulfoxide by Dimethyl sulfoxide, Aroclor 1221 by Aroclor 1221, Aroclor 1221 by vinclozolin, vinclozolin by vinclozolin, vinclozolin by Aroclor 1221 (x-axis) for Dimethyl sulfoxide by Dimethyl sulfoxide, Aroclor 1221 by Aroclor 1221, Aroclor 1221 by vinclozolin, vinclozolin by vinclozolin, vinclozolin by Aroclor 1221. At the bottom, the three box and whiskers are titled maternal and paternal under elevated plus maze test, plotting open: closed arm ratio (log), ranging from 0.01 to 0.10 in increments 0.09 and 0.10 to 1.00 in increments of 0.9; total distance traveled (centimeters), ranging from 0 to 40 in increments of 10; and total time immobile (seconds), ranging from 0 to 100 in increments of 25 (y-axis) across Dimethyl sulfoxide by Dimethyl sulfoxide, Aroclor 1221 by Aroclor 1221, Aroclor 1221 by vinclozolin, vinclozolin by vinclozolin, vinclozolin by Aroclor 1221 (x-axis) for Dimethyl sulfoxide by Dimethyl sulfoxide, Aroclor 1221 by Aroclor 1221, Aroclor 1221 by vinclozolin, vinclozolin by vinclozolin, vinclozolin by Aroclor 1221.
Figure 4.
Boxplots of behavioral data from F4 male rats exposed to DMSO/DMSO (D/D), A1221/A1221 (A/A), A1221/VIN (A/V), VIN/VIN (V/V), or VIN/A1221 (V/A) (first exposure/second exposure) across generations (ancestral first hit, prenatal second hit). Horizontal lines represent median score, boxes represent upper and lower quartiles, vertical whiskers represent the spread of datapoints outside of the upper and lower quartiles, and points are datapoints that fall 1.5× above or below the main distribution. Ratios of time spent in aversive compared to less aversive regions from each test (A,D,G) are shown on a logarithmic scale to maintain comparable y-axes across tests. In the Open Field test, F4 paternal A1221/VIN rats spent a lower ratio of time in the center of the open field compared to DMSO/DMSO controls [*, Tukey HSD, p=0.02 (A)] and spent more total time immobile in the open field compared to DMSO/DMSO controls and VIN/A1221 rats [*, Tukey HSD, p=0.02 for both (C)]. In the light:dark box test, F4 paternal A1221/VIN-exposed rats spent a lower ratio of time in the light box compared to all other groups [**, Tukey HSD, p<0.01 all (D)] and spent more total time immobile compared to VIN/A1221 rats [*, Tukey HSD, p=0.05 (F)]. The F4 maternal A1221/VIN rats also spent more total time immobile compared to DMSO/DMSO controls and VIN/VIN rats [*, Tukey HSD, p=0.03 and p=0.05, respectively (F)]. Summary data can be found in Excel Table S3. Note: A1221, Aroclor 1221; DMSO, dimethyl sulfoxide; VIN, vinclozolin.
Figures 5A to 5I are box and whisker plots titled Ancestral first hit and second hit (F 6). On the top, the three box and whiskers are titled maternal and paternal under open field test, plotting center: outer region ratio (log), ranging from 0.01 to 0.10 in increments 0.09 and 0.10 to 1.00 in increments of 0.9; total distance traveled (centimeters), ranging from 0 to 40 in increments of 10; and total time immobile (seconds), ranging from 0 to 100 in increments of 25 (y-axis) across Dimethyl sulfoxide by Dimethyl sulfoxide, Aroclor 1221 by Aroclor 1221, Aroclor 1221 by vinclozolin, vinclozolin by vinclozolin, vinclozolin by Aroclor 1221 (x-axis) for Dimethyl sulfoxide by Dimethyl sulfoxide, Aroclor 1221 by Aroclor 1221, Aroclor 1221 by vinclozolin, vinclozolin by vinclozolin, vinclozolin by Aroclor 1221. At the center, the three box and whiskers are titled maternal and paternal under Light:Dark box test, plotting light: dark box ratio (log), ranging from 0.01 to 0.10 in increments 0.09 and 0.10 to 1.00 in increments of 0.9; total distance traveled (centimeters), ranging from 0 to 40 in increments of 10; and total time immobile (seconds), ranging from 0 to 100 in increments of 25 (y-axis) across Dimethyl sulfoxide by Dimethyl sulfoxide, Aroclor 1221 by Aroclor 1221, Aroclor 1221 by vinclozolin, vinclozolin by vinclozolin, vinclozolin by Aroclor 1221 (x-axis) for Dimethyl sulfoxide by Dimethyl sulfoxide, Aroclor 1221 by Aroclor 1221, Aroclor 1221 by vinclozolin, vinclozolin by vinclozolin, vinclozolin by Aroclor 1221. At the bottom, the three box and whiskers are titled maternal and paternal under elevated plus maze test, plotting open: closed arm ratio (log), ranging from 0.01 to 0.10 in increments 0.09 and 0.10 to 1.00 in increments of 0.9; total distance traveled (centimeters), ranging from 0 to 40 in increments of 10; and total time immobile (second), ranging from 0 to 100 in increments of 25 (y-axis) across Dimethyl sulfoxide by Dimethyl sulfoxide, Aroclor 1221 by Aroclor 1221, Aroclor 1221 by vinclozolin, vinclozolin by vinclozolin, vinclozolin by Aroclor 1221 (x-axis) for Dimethyl sulfoxide by Dimethyl sulfoxide, Aroclor 1221 by Aroclor 1221, Aroclor 1221 by vinclozolin, vinclozolin by vinclozolin, vinclozolin by Aroclor 1221.
Figure 5.
Boxplots for behavioral data from F6 rats exposed to DMSO/DMSO (D/D), A1221/A1221 (A/A), A1221/VIN (A/V), VIN/VIN (V/V), or VIN/A1221 (V/A) (first exposure/second exposure) across generations (ancestral first and second hits). Horizontal lines represent median score, boxes represent upper and lower quartiles, vertical whiskers represent the spread of datapoints outside of the upper and lower quartiles, and points are datapoints that fall 1.5× above or below the main distribution. Ratios of time spent in aversive compared to less aversive regions from each test (A,D,G) are shown on a logarithmic scale to maintain comparable y-axes across tests. In the light:dark box test, F6 maternal A1221/VIN rats spent a higher ratio of time in the light box compared to DMSO/DMSO controls [*, Tukey HSD, p=0.05 (D)] and F6 paternal VIN/VIN rats traveled less total distance compared to A1221/A1221, A1221/VIN, and DMSO/DMSO controls [*, Tukey HSD, p=0.05 (E)]. Summary data can be found in Excel Table S4. Note: A1221, Aroclor 1221; DMSO, dimethyl sulfoxide; VIN, vinclozolin.
Figures 6 is a set of eight box and whiskers plot. In the first row, plots titled Prenatal first hit (F 1), plotting serum E 2 (picograms per milliliter), ranging from 0 to 40 in increments of 10 and serum corticosterone (nanograms per milliliter), ranging from 0 to 500 in increments of 100 (y-axis) across Dimethyl sulfoxide, Aroclor 1221, and vinclozolin (x-axis). In the second row, plots are titled maternal and paternal under Ancestral first hit (F 3), plotting serum E 2 (picograms per milliliter), ranging from 0 to 40 in increments of 10 and serum corticosterone (nanograms per milliliter), ranging from 0 to 500 in increments of 100 (y-axis) across Dimethyl sulfoxide, Aroclor 1221, and vinclozolin (x-axis). In the third row, plots are titled maternal and paternal under Ancestral first hit, Prenatal second hit (F 4), plotting serum E 2 (picograms per milliliter), ranging from 0 to 40 in increments of 10 and serum corticosterone (nanograms per milliliter), ranging from 0 to 500 in increments of 100 (y-axis) across Dimethyl sulfoxide by Dimethyl sulfoxide, Aroclor 1221 by Aroclor 1221, Aroclor 1221 by vinclozolin, vinclozolin by vinclozolin, vinclozolin by Aroclor 1221 (x-axis) for Dimethyl sulfoxide by Dimethyl sulfoxide, Aroclor 1221 by Aroclor 1221, Aroclor 1221 by vinclozolin, vinclozolin by vinclozolin, vinclozolin by Aroclor 1221. In the fourth row, plots are titled maternal and paternal under Ancestral first and second hit (F 6), plotting serum E 2 (picograms per milliliter), ranging from 0 to 40 in increments of 10 and serum corticosterone (nanograms per milliliter), ranging from 0 to 500 in increments of 100 (y-axis) across Dimethyl sulfoxide by Dimethyl sulfoxide, Aroclor 1221 by Aroclor 1221, Aroclor 1221 by vinclozolin, vinclozolin by vinclozolin, vinclozolin by Aroclor 1221 (x-axis) for Dimethyl sulfoxide by Dimethyl sulfoxide, Aroclor 1221 by Aroclor 1221, Aroclor 1221 by vinclozolin, vinclozolin by vinclozolin, vinclozolin by Aroclor 1221.
Figure 6.
Boxplots of serum hormone concentrations from a subset (n=20/group) of behaviorally characterized male rats (F1, F3, F4, and F6). Horizontal lines represent median concentration, boxes represent upper and lower quartiles, vertical whiskers represent the spread of datapoints outside of the upper and lower quartiles, and points are datapoints that fall 1.5× above or below the main distribution. Serum estradiol (E2) was lower in F4 maternal VIN/VIN male rats compared to controls (C). Serum corticosterone (CORT) was higher in F6 maternal VIN/VIN male rats compared to A1221/VIN rats (H). Serum hormones were not significantly affected by EDC exposure in other generation and lineage combinations (A,B,D,E,F,G). Summary data can be found in Excel Table S5. Note: The legend shows first exposure/second exposure (D/D, DMSO/DMSO; A/A, A1221/A1221; A/V, A1221/VIN; V/V, VIN/VIN; V/A, VIN/A1221). A1221, Aroclor 1221; DMSO, dimethyl sulfoxide; EDC, endocrine-disrupting chemical; VIN, vinclozolin.
Figure 7 is set of two scatterplots titled Hormone and Behavior Ratio P C models. Figure 7A is titled Dimethyl sulfoxide by Dimethyl sulfoxide, Aroclor 1221 by Aroclor 1221, Aroclor 1221 by vinclozolin, vinclozolin by vinclozolin, vinclozolin by Aroclor 1221 under ancestral first hit, prenatal second hit (F 4 paternal), plotting serum E2 (lowercase z scores), ranging from negative 2 to 2 in increments of 2 (y-axis) across P C 1 (Behavior Ratio scores), ranging from negative 4 to 0 in increments of negative 2 (x-axis). The overall model fit: uppercase r squared equals 10 percent and lowercase italic p equals 0.05. Figure 7B is titled Dimethyl sulfoxide by Dimethyl sulfoxide, Aroclor 1221 by Aroclor 1221, Aroclor 1221 by vinclozolin, vinclozolin by vinclozolin, vinclozolin by Aroclor 1221 begin superscript asterisk end superscript under ancestral first hit, prenatal second hit (F 4 paternal), plotting serum corticosterone (lowercase z scores), ranging from negative 2 to 3 in unit increments across P C 1 (Behavior Ratio scores), ranging from negative 4 to 0 in increments of negative 2 (x-axis) for Dimethyl sulfoxide by Dimethyl sulfoxide, Aroclor 1221 by Aroclor 1221, Aroclor 1221 by vinclozolin, vinclozolin by vinclozolin, vinclozolin by Aroclor 1221. The overall model fit: uppercase r squared equals 11.3 percent and lowercase italic p less than 0.03.
Figure 7.
Scatterplots with linear regression lines showing predictive relationships between serum hormone levels (standardized to z-scores) and behavioral ratio scores captured by principal component (PC) 1. Points represent individual animals, and regression lines indicate trends within treatment groups. Each treatment group is shown on a separate panel for ease of interpretability, but the data were analyzed in an omnibus multiple linear regression model with treatment included as a factor. Serum estradiol (E2) explained 10% of the variation (adjusted R2) in the PC1 scores of the F4 paternal line rats (A), and serum corticosterone (CORT) explained 11.3% of the variation in the PC1 scores of the F4 paternal line rats with a significant and negative interaction between CORT and PC1 among the VIN/A1221-exposed rats [*, p=0.05 (B)]. Summary data can be found in Excel Table S6. Note: The legend shows first exposure/second exposure (D/D, DMSO/DMSO; A/A, A1221/A1221; A/V, A1221/VIN; V/V, VIN/VIN; V/A, VIN/A1221). A1221, Aroclor 1221; DMSO, dimethyl sulfoxide; VIN, vinclozolin.
Figure 8 is a tabular representation with four main columns, namely, F 1, F 3, F 4, and F 6. The F 3, F 4, and F 6 columns, each are sub divided into two columns, namely, Maternal and Paternal. The table displays the following details: serum hormone concentrations, open field test, light:dark box, elevated plus maze, principal component analysis, estradiol (E 2) regression model, and corticosterone (C O R T) regression model.
Figure 8.
Summary of behavioral and hormonal effects, as well as their interaction, on male rats exposed to EDCs over generations. “Anxiety” refers to ratio of time spent in the region considered aversive for each test. ↓ Anxiety represents a higher ratio of time in the aversive region; ↑ Anxiety represents a lower ratio of time spent in the aversive region. Effects are relative (rel.) to DMSO (F3 generation) or DMSO/DMSO (F4, F6 generation) controls unless otherwise specified. Note: A1221, Aroclor 1221; DMSO, dimethyl sulfoxide; EDC, endocrine-disrupting chemical; VIN, vinclozolin.

Similar articles

References

    1. Darbre PD. 2019. The history of endocrine-disrupting chemicals. Curr Opin Endocr Metab Res 7:26–33, 10.1016/j.coemr.2019.06.007. - DOI
    1. Zoeller RT, Brown TR, Doan LL, Gore AC, Skakkebaek NE, Soto AM, et al. . 2012. Endocrine-disrupting chemicals and public health protection: a statement of principles from the endocrine society. Endocrinology 153(9):4097–4110, PMID: 22733974, 10.1210/en.2012-1422. - DOI - PMC - PubMed
    1. Trasande L. 2016. Updating the toxic substances control act to protect human health. JAMA 315(15):1565–1566, PMID: 26974705, 10.1001/jama.2016.2037. - DOI - PubMed
    1. Hilz EN, Gore AC. 2023. Endocrine-disrupting chemicals: science and policy. Policy Insights Behav Brain Sci 10(2):142–150, 10.1177/23727322231196794. - DOI
    1. Borja J, Taleon DM, Auresenia J, Gallardo S. 2005. Polychlorinated biphenyls and their biodegradation. Process Biochem 40(6):1999–2013, 10.1016/j.procbio.2004.08.006. - DOI