. 2024 Dec 31;10(3):e173071.
doi: 10.1172/jci.insight.173071.

Mindin regulates fibroblast subpopulations through distinct Src family kinases during fibrogenesis

Affiliations

Mindin regulates fibroblast subpopulations through distinct Src family kinases during fibrogenesis

Sunny Kataria et al. JCI Insight. .

Abstract

Fibrosis results from excessive extracellular matrix (ECM) deposition, which causes tissue stiffening and organ dysfunction. Activated fibroblasts, central to fibrosis, exhibit increased migration, proliferation, contraction, and ECM production. However, it remains unclear if the same fibroblast performs all of the processes that fall under the umbrella term of "activation." Owing to fibroblast heterogeneity in connective tissues, subpopulations with specific functions may operate under distinct regulatory controls. Using a transgenic mouse model of skin fibrosis, we found that Mindin (also known as spondin-2), secreted by Snail-transgenic keratinocytes, differentially regulates fibroblast subpopulations. Mindin promotes migration and inflammatory gene expression in SCA1+ dermal fibroblasts via Fyn kinase. In contrast, it enhances contractility and collagen production in papillary CD26+ fibroblasts through c-Src signaling. Moreover, in the context of the fibrotic microenvironment of the tumor stroma, we found that differential responses of resident fibroblast subpopulations to Mindin extend to the generation of functionally heterogeneous cancer-associated fibroblasts. This study identifies Mindin as a key orchestrator of dermal fibroblast heterogeneity, reshaping cellular dynamics and signaling diversity in the complex landscapes of skin fibrosis and cancer.

Keywords: Autoimmune diseases; Dermatology; Fibrosis; Inflammation; Signal transduction.


Conflict of interest statement

Conflict of interest: The authors have declared that no conflict of interest exists.

Figures

Figure 1
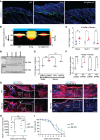
Figure 1. SCA1+ fibroblast localization is perturbed in the dermis of Snail-transgenic mice.
Representative contour plot showing quadrants for (A) α-SMA+SCA1+/CD26VIMhi, α-SMA+SCA1-/CD26VIMhi, α-SMA-SCA1+/CD26VIMhi and α-SMASCA1/CD26VIMhi and (B) α-SMA+CD26+/SCA1VIMhi, α-SMA+CD26/SCA1VIMhi, α-SMACD26+/SCA1VIMhi and α-SMACD26/SCA1VIMhi cells from P9 WT (left) and Snail-transgenic (SnTg) (right) mice. Individual value plots (mean ± SEM) of (C) the percentage of α-SMA+SCA1+/CD26VIMhi and (D) the percentage α-SMA+CD26+/SCA1VIMhi cells (n = 6; P values were calculated by Welch’s t test; *P < 0.05, ***P < 0.001). (E) SCA1+ fibroblasts (green) and nuclear staining with DAPI (blue) in WT and SnTg skin sections in P3, P5, P7, and P9 pups. The white boxes mark the insets shown in Supplemental Figure 1J. Note that the green stain at the bottom of the skin section is the autofluorescence of the paper used to keep the tissue uncurled during the embedding process. (F) Heatmap showing the probability of SCA1+ cells at a given distance below the epidermis in WT (top) and SnTg (bottom) mice. P3 (n =3 WT and Snail Tg), P5 (n = 2 WT and n = 4 Snail Tg), P7 (n = 3 WT and n = 4 Snail Tg), and P9 (n = 6 WT and n = 8 Snail Tg). (G) CD26+ fibroblasts (red) and nuclear staining with DAPI (blue) in WT and SnTg skin sections from P3, P5, P7, and P9 pups. The white boxes mark the insets shown in Supplemental Figure 1L as magnified areas. The boxed areas are shown at higher magnification in Supplemental Figure 1L. Note that the red stain at the bottom of the skin section is the autofluorescence of the paper used to keep the tissue uncurled during the embedding process. (H) Heatmap showing the probability of CD26+ cells at a given distance below the epidermis in WT (top) and SnTg (bottom) at P3 (n = 2 WT and n = 3 Snail Tg), P5 (n = 2 WT and n = 3 Snail Tg), P7 (n = 3 WT and n = 3 Snail Tg), and P9 (n = 4 WT and n = 6 Snail Tg).
Figure 2
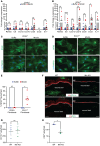
Figure 2. Mindin induces migration of SCA1+ fibroblasts via Fyn kinase.
(A) IF staining for SCA1 in P9 WT, SnTg, and SnTg/Mindin-KO (SnTg/Min-KO) skin (scale bar: 50 μm). (B) Heatmap showing the probability of SCA1+ cells at a given distance below the epidermis in WT (n = 6), SnTg (n = 8), and SnTg/Min-KO (n = 4) skin. Data for WT and SnTg are the same as in Figure 1F. (C) Transwell assay to measure migration of mixed, SCA1+, and CD26+ fibroblasts with either buffer or Mindin as a potential chemoattractant (n ≥ 4). (D) Amount of phosphorylated SRC (pSRC) and total SRC (tSRC) proteins in fibroblasts treated with either buffer or Mindin for 15 minutes. (E) Transwell assay with SCA1+ fibroblasts stimulated with buffer or Mindin in the presence of DMSO, PP2 (10 μM), or KbSrc4 (10 μM) (n = 3). (F) Transwell assay with SCA1+ fibroblasts transduced with nontargeting (NT), Src, Fyn, or Yes shRNA with buffer or Mindin as a chemoattractant (n = 3). (G) IF for SCA1 in WT and Min-KO day 7 and day 9 skin wounds. (The images were stitched using FIJI ImageJ stitching tool, ref. ; scale bar: 50 μm.) White boxes denote regions shown at higher magnification on the right-hand side of each image. (H) Quantification of SCA1+ cells in the wound beds day 7 and day 9 after wounding of WT and Min-KO mice (n = 3 mice) (I) Percentage wound closure in WT and Min-KO mice with regard to wound size on day 1 (n = 3 mice, 2 wounds per mice). Data represent the mean ± SEM. P values were calculated by Welch’s t test (C and I), 1-way ANOVA followed by Tukey’s post hoc analysis (E), and 2-way ANOVA followed by post hoc Šídák’s multiple comparisons test (F and H). *P < 0.05, **P < 0.01, ***P < 0.001, ****P < 0.0001; NS, P > 0.05.
Figure 3
Figure 3. Mindin stimulates inflammatory cytokine production in SCA1+ fibroblasts.
qPCR for expression of inflammatory cytokines from (A) CD26+ fibroblasts or (B) SCA1+ fibroblasts treated with either buffer or Mindin (n ≥ 4). Staining for NF-κB (green) and DAPI (blue) in (C) CD26+ fibroblasts or (D) SCA1+ fibroblasts treated for 1 hour with either buffer or Mindin (scale bar: 50 μm) and (E) the percentage of cells with NF-κB+ nuclei per field in CD26+ (n = 3) or SCA1+ (n = 5) fibroblast treated with either buffer or Mindin. (F) IF staining for K5 (red) and CD11b (top; green; macrophages) and CD3 (bottom; green; T cells) in WT and Min-KO skin sections after wounded day 7 (scale bar: 50 μm) and quantification of (G) CD11b+ and (H) CD3+ cells found in the wound bed (n = 3 mice). Data represent the mean ± SEM. P values were calculated by ratio paired t test (A and B) and Welch’s t test (E, G, and H). *P < 0.05, **P < 0.01, ****P < 0.0001; NS, P > 0.05. nd, not detected.
Figure 4
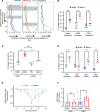
Figure 4. Mindin induces fibroblast contraction and collagen production in CD26+ fibroblasts.
(A) Measurement of intracellular distance between 2 nearest CD26+ nuclei (x axis) as a function of distance below the epidermis (y axis, bin number below the epidermis; bin size = 5 μm) in WT, SnTg, and SnTg/Min-KO skin (n = 3). (The number of CD26+ cells counted >80 in each section. The region shaded in gray marks the bins where P < 0.05, calculated using Welch’s t test.) (B) Collagen contraction assay, showing percentage of contraction of collagen gels seeded with mixed, CD26+, or SCA1+ fibroblasts and treated with either buffer control or Mindin (n ≥ 4). (C) Effect of SFK inhibition on Mindin-induced collagen contraction. CD26+ fibroblasts were treated with either buffer control or Mindin along with DMSO, PP2, or KbSrc4 (n ≥ 3). (D) Effect of nontargeting (NT), Src, Fyn, or Yes shRNA on collagen contraction with CD26+ fibroblasts treated with either buffer control or Mindin (n ≥ 3). (E) Measurement of the rate of closure (slope) in WT and Min-KO mice. The slope was calculated as the percentage of closure of a given day – the percentage of closure on the previous day (n = 3 mice, 2 wounds per mouse). (F) Quantification of COL1 in buffer control or Mindin-treated CD26+ and SCA1+ fibroblasts, normalized to Lamin B1 (LAM) (n = 4). Data represent the mean ± SEM. P values were calculated by Welch’s t test (B and E), ratio-paired t test (F), 1-way ANOVA followed by Tukey’s post hoc analysis (C), and 2-way ANOVA followed by post hoc Šídák’s multiple comparisons test (D). *P < 0.05, **P < 0.01, ***P < 0.001, ****P < 0.0001; NS, P > 0.05.
Figure 5
Figure 5. Mindin promotes CD26+ fibroblasts to adopt a CAF phenotype.
qPCR for expression of signature genes of myCAFs in (A) CD26+ fibroblasts or (B) SCA1+ fibroblasts treated with either buffer or Mindin (n ≥ 4). Expression of genes that are associated with stem cell renewing CAFs in (C) CD26+ (n = 6) and (D) SCA1+ (n = 4) fibroblasts treated with either buffer or Mindin measured by qPCR. (E) Colony formation assay of primary mouse keratinocytes (mKT) cocultured with CD26+ or SCA1+ fibroblasts pretreated with either buffer of Mindin for 24 hours (n = 3). (F) Colony formation assay of primary mouse keratinocytes cultured with conditioned media (CM) collected from CD26+ fibroblasts treated with either buffer or Mindin (n = 4). Data represent the mean ± SEM. P values were calculated by ratio paired t test (AD) and Welch’s t test (E and F). *P < 0.05, **P < 0.01; NS, P > 0.05. (G) Model of differential effects of Mindin on distinct subpopulations of dermal fibroblasts.

Similar articles

References

    1. Wynn TA. Cellular and molecular mechanisms of fibrosis. J Pathol. 2008;214(2):199–210. doi: 10.1002/path.2277. - DOI - PMC - PubMed
    1. Thannickal VJ, et al. Mechanisms of pulmonary fibrosis. Annu Rev Med. 2004;55(1):395–417. doi: 10.1146/annurev.med.55.091902.103810. - DOI - PubMed
    1. Kendall RT, Feghali-Bostwick CA. Fibroblasts in fibrosis: novel roles and mediators. Front Pharmacol. 2014;5:123. doi: 10.3389/fphar.2014.00123. - DOI - PMC - PubMed
    1. Thiruvoth FM, et al. Current concepts in the physiology of adult wound healing. Plast Aesthet Res. 2015;2:250–256. doi: 10.4103/2347-9264.158851. - DOI
    1. Bainbridge P. Wound healing and the role of fibroblasts. J Wound Care. 2013;22(8):407–8, 410. doi: 10.12968/jowc.2013.22.8.407. - DOI - PubMed

Substances