. 2024 Dec 31;135(5):e173493.
doi: 10.1172/JCI173493.

Disrupted callosal connectivity underlies long-lasting sensory-motor deficits in an NMDA receptor antibody encephalitis mouse model

Affiliations

Disrupted callosal connectivity underlies long-lasting sensory-motor deficits in an NMDA receptor antibody encephalitis mouse model

Jing Zhou et al. J Clin Invest. .

Abstract

N-methyl-d-aspartate (NMDA) receptor-mediated autoimmune encephalitis (NMDAR-AE) frequently results in persistent sensory-motor deficits, especially in children, yet the underlying mechanisms remain unclear. This study investigated the long-term effects of exposure to a patient-derived GluN1-specific mAb during a critical developmental period (from postnatal day 3 to day 12) in mice. We observed long-lasting sensory-motor deficits characteristic of NMDAR-AE, along with permanent changes in callosal axons within the primary somatosensory cortex (S1) in adulthood, including increased terminal branch complexity. This complexity was associated with paroxysmal recruitment of neurons in S1 in response to callosal stimulation. Particularly during complex motor tasks, mAb3-treated mice exhibited significantly reduced interhemispheric functional connectivity between S1 regions, consistent with pronounced sensory-motor behavioral deficits. These findings suggest that transient exposure to anti-GluN1 mAb during a critical developmental window may lead to irreversible morphological and functional changes in callosal axons, which could significantly impair sensory-motor integration and contribute to long-lasting sensory-motor deficits. Our study establishes a new model of NMDAR-AE and identifies novel cellular and network-level mechanisms underlying persistent sensory-motor deficits in this context. These insights lay the foundation for future research into molecular mechanisms and the development of targeted therapeutic interventions.

Keywords: Autoimmunity; Mouse models; Neurological disorders; Neuroscience.


Figures

Figure 1
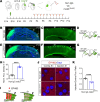
Figure 1. Generation and validation of patient-derived monoclonal anti-NMDAR antibodies.
(A) Diagram of generation of patient-derived monoclonal anti-NMDAR antibodies. (B) Western blot demonstrating the immunoprecipitation of GluN1 from P40 mouse brain homogenates using CSF from an anti-NMDAR encephalitis patient, mAb1, and mAb3, which were cloned from the patient’s CSF. Immunoprecipitations with human IgG and CSF from patient without anti-NMDAR encephalitis served as negative controls. Although mAb2 and mAb4 were cloned from the same anti-NMDAR encephalitis patient, they did not immunoprecipitate with GluN1. (CF) Immunostaining with CSF of negative control patient (C), CSF of anti-NMDAR encephalitis patient (D), mAb1 (E) and mAb3 (F) on sagittal sections of P40 mouse brains. The staining of control patient CSF served as a negative control. (G) Immunostaining pattern of mAb1 and mAb3 across various brain regions. The dashed line is the borderline between the cortex and CC. (HL) mAb1 and mAb3 recognized extracellular epitopes of NMDAR. (H) We crossed Emx1cre/+; Grin1fl/fl mice with Cre-reporter Rosa26fs-tdTomato mice to produce NMDAR knockout cells labeled with red fluorescence. Hippocampal neurons were cultured from Emx1cre/+; Grin1fl/fl; Rosa26fs-tdTomato mice. Hippocampal cultures of Emx1cre/+; Grin1wt/wt; Rosa26fs-tdTomato mice served as controls. (I and J) mAb1 and mAb3 showed punctate membrane staining in live staining of cultured hippocampal neurons. The staining was gone in red cells of Emx1cre/+; Grin1fl/fl; Rosa26fs-tdTomato cultures (J) but not red cells of Emx1cre/+; Grin1wt/wt; Rosa26fs-tdTomato cultures (I), comfirming mAb specificity for NMDAR. Arrows indicate dendritic fragments, with zoomed-in views provided below each panel. (K and L) Quantification of fluorescence intensity on dendritic fragments shows significant reduction in mAb1 and mAb3 staining in NMDAR knockout neurons compared with controls. ****P < 0.0001. n = 12 for mAb1, n = 16 for mAb3. Scale bars: 500 mm (CF); 10 mm (G, I and J). R26tdT: Rosa26fs-tdTomato. OB, olfactory bulb; Ctx, cortex; Hi, hippocampus; CP, Caudoputamen; TH, thalamus; MB, midbrain; CB, cerebellum; P, pons; Med, medulla.
Figure 2
Figure 2. mAb3 specifically binds the GluN1 subunit and significantly decreases NMDAR synaptic currents.
(AC) We generated Emx1cre/+; Grin1fl/fl; Rosa26fs-tdTomato mice to produce NMDAR knockout cells labeled with red fluorescence. Emx1cre/+; Grin1wt/wt; Rosa26fs-tdTomato mice served as control. Arrowheads point to cells with Cre recombination, while arrow points to cells without Cre recombination. mAb3 signals were only detected on non-Cre recombination cells but absent on Cre recombination cells lacking NMDAR (B). (C) Quantification of mAb3 immunostaining fluorescence (Fluo.) intensity (P < 0.0001, n = 20 to 21 per group). (DF) We generated Emx1cre/+; Grin2afl/fl mice to conditional knockout GluN2A-containing NMDAR in excitatory neurons. The same littermates, Grin2afl/fl mice, served as controls. No differences were detected (P = 0.79, n = 9–10 per group). (GI) We generated Emx1cre/+; Grin2bfl/fl; Rosa26fs-tdTomato mice to produce GluN2B knockout cells. Littermates, Emx1cre/+; Grin2bWT/WT; Rosa26fs-tdTomato mice, served as controls. No differences were detected (P = 0.16, n = 22–24 per group). Scale bar: 10 mm. (J and K) mAb3 decreases NMDAR EPSCs in hippocampus slice cultures. (J) Representative AMPAR and NMDAR EPSCs from slices treated with (mAb3) and without (control) 2 μg mAb3. (K) AMPAR/NMDAR ratios significantly increased following mAb3 treatment (P ≤ 0.0001, n = 24–27 cells). (LN) mAb3 blocks NMDAR-mEPSCs in hippocampal neurons. (L) Representative traces of NMDAR-mEPSCs recorded in 0 Mg²+ ACSF containing NBQX, TTX, and PTX, followed by 3 mM Mg²+ or 50 μM APV. (M) NMDAR-mEPSC amplitude (P < 0.01, n = 9 cells per group). (N) Charge transfer (P < 0.001, n = 9 cells per group). Error bars represent SEM. The above statistics were based on Student’s t test. **P < 0.01; ***P < 0.001; ****P < 0.0001.
Figure 3
Figure 3. Disrupted callosal projections in primary somatosensory cortex (S1) after intraventricular injection of mAb3[GluN1] from P3 to P12.
(A) Diagram of the experimental procedure. EGFP plasmid was injected into the lateral ventricle of the embryo at E15.5 and an electrical pulse was given to enable the plasmid to enter cortical progenitor cells of layer II/III in the ventricular zone. mAb3[GluN1] was injected into the lateral ventricle from P3 to P12 in contralateral cortex. Human IgG served as control. Compared with control (BD), mAb3[GluN1] injection mice showed dramatically increased callosal projections (EG) in S1 at P14. Asterisks pointed to the callosal axons in S1. (H) Quantification of the fluorescence density. Human IgG VS mAb3[GluN1]: P < 0.0001. n = 4 to 5 per group. (I) Diagram of EPHB2 expression in S1. (J) Expression of EPHB2 in S1 of injecting side and contralateral noninjecting side for the 2 treatments. (K) Quantification of fluorescence intensity ratio of injecting side to contralateral noninjecting side. Human IgG VS mAb3[GluN1]: P < 0.0001. n = 9 for each group. Scale bar: 500 mm (C, D, F, G); 5 mm (J). Above statistics were based on Mann-Whitney U test. ****P < 0.0001.
Figure 4
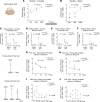
Figure 4. Unaffected gross movements in mAb3[GluN1]-treated mice.
(A and B) Locomotor activity in OFT. There was no difference in total movements between human IgG and mAb3[GluN1]-treated female (A) and male (B) mice. (C and D) Digging and kicking activity in burrowing test. There was no difference in burrowing performance between the 2 groups in female (C) and male (D) mice. (E and F) Motor coordination in rotarod. There was no difference in rotarod performance between the 2 groups in female (E) and male (F) mice. n = 6 to 8 per group. P value on each figure graph represents the statistical difference between the 2 groups over trials by using 2-way ANOVA and Geisser-GreenHouse correction.
Figure 5
Figure 5. Persistent impaired fine movements in mAb3[GluN1]-treated mice.
(A and B) Nest building. There was significantly impaired nest building at 2 hours (human IgG VS mAb3[GluN1]: P = 0.02) and 6 hours (human IgG VS mAb3[GluN1]: P = 0.03) in mAb3[GluN1]-treated male (B) mice. (CF) Balance beam. There was no difference in latency of beam crossing for female (C) and male (E) mice. However, there was a significantly increased balance check in mAb3[GluN1]-treated female mice (D) at trial 4 (Human IgG VS mAb3[GluN1]: P = 0.009). (G and H) Facing down pole test. A significant difference was observed between mAb3[GluN1]-treated and human IgG-treated male mice over all 3 trials (H). However, there was no difference in descent latency in each trial for female (G) and male (H) mice. (I and J) Facing upward pole test. There was significantly increased descent latency in mAb3[GluN1]-treated female mice (I) at trial 2 (human IgG VS mAb3[GluN1]: P = 0.01), and mAb3[GluN1]-treated male (J) at trial 3 (human IgG VS mAb3[GluN1]: P = 0.04), trial 4 (human IgG VS mAb3[GluN1]: P = 0.04), and trial 5 (human IgG VS mAb3[GluN1]: P = 0.03). n = 6 to 8 per group. P value on each figure graph represents the statistical difference between the 2 groups over all trials by using 2-way ANOVA and Geisser-GreenHouse correction. The P value in figure legends represents the statistical difference between 2 treatments for 1 trial by using Dunn’s multiple comparisons test. *P < 0.05.
Figure 6
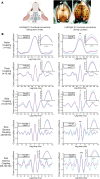
Figure 6. Disrupted interhemispheric functional connectivity in S1 of mAb3[GluN1]-treated male mice.
(A) Schematic representation of the 30-channel EEG array and the process of its implantation on the mouse skull (Adapted from Jonak, et al., 2018, ref. 59). As previously described, mAb3[GluN1] was injected into the right hemisphere of mice from P3 to P12, with EEG surgery and recording carried out when the mice were between 2 and 3 months old. We recorded EEG signals while mice performed the facing down and facing upward pole tests. (B) The cross-correlation coefficient curve for left-right S1 functional connectivity during the pole test in both facing down and facing up trials. In the graph, human (Hum) IgG-treated male mice (n = 3) served as control for mAb3[GluN1]-treated male mice (n = 3). The control group demonstrated significantly higher left-right S1 functional connectivity compared with the antibody group during facing up trials. This difference was not observed during facing down trials. The frequency bands where differences were observed include α, β, slow γ, and fast γ. Differences in functional connectivity between treatment groups and conditions were assessed using 2-way ANOVA followed by Šídák’s multiple comparisons test. Data are presented as mean ± SEM. Statistical significance was set at P < 0.05. The waveform in the figure was plotted using MATLAB, with shaded areas representing SEM.
Figure 7
Figure 7. Permanent morphological alterations of S1 callosal axons in mAb3[GluN1]-treated mice.
(A) Represented morphology of individual callosal axon terminals in S1 at 4 months. (B) Sholl analysis of callosal axon branches in female and male mice. Concentric circles from the start point are used to count the number of axon intersections. Start point was defined at 10 mm before the first branch intersection along the main axon trunk (magenta point in the diagram). Axon branch orientation angle in female (C) and male (D) mice. The angle forms between the extending line connecting the distal axon branch segment to the x axis of each image within the XY plane. The x axis is parallel to the cortical surface. The angle is from –180 to 180 degrees and is used to quantify the extending direction of the axon branch to the cortical surface. A positive angle (0–180) means the axon branch is extending toward the cortical surface, while a negative angle (–180–0) means the axon branch is extending away from the cortical surface. (E and F) Morphological features of axon branch terminals in mAb3[GluN1]-treated female (E) and male (F) mice. *P < 0.05; **P < 0.05; ***P < 0.01. n = 14 to 18 per group (BF). For the human IgG-treated group, 5 female mice (15 terminals) and 4 male mice (18 terminals) were analyzed. For the mAb3[GluN1]-treated group, 4 female mice (14 terminals) and 6 male mice (14 terminals) were analyzed. Each mouse had 3–4 terminals analyzed. The above statistics were based on Mann-Whitney U test. The plots in C and D were made in R using ggplot2 package.
Figure 8
Figure 8. The primary somatosensory cortex is hyperexcitable in mAb3[GluN1]-treated male mice at 6 months.
(A) Schematic of the experimental design of ex vivo recordings showing the location of the stimulating electrode in the white matter and the extracellular recording array spanning all the layers in the S1 cortex (blue). (B and C) Ex vivo recordings of putative extracellular spikes in response to a 500 μA electrical pulse stimulation (arrowhead) from a brain slice of a control human IgG-treated mouse (B) and a brain slice from mAb3[GluN1]-treated mouse (C). In each case, a single trace and an overlay of 9 traces are presented from the same slice. Evoked spikes were counted during the time window indicated by the horizontal orange line. (D) Mean frequency of spikes for channels located in layers 1–5. Data: mean ± SEM; n = 9 slices from 4 human IgG-treated mice and n = 10 slices from 4 mAb3[GluN1]-treated mice. P values are from the Mann-Whitney rank sum test comparing human IgG versus mAb3[GluN1] for each channel. Note that only channels 5 and 7 (both located in layer 4) show significant differences between control and mAb3[GluN1] groups. Using Kruskal-Wallis ANOVA with multiple comparisons (Dunn’s method) with 19 degrees of freedom P < 0.001 between groups. (E) Traces from the slices in (B and C) showing evoked spikes from channel 7 located in layer 4 (L4). (F) Same quantification as in E but with channels grouped for layers 2/3 (averaged across channels 2–4), layer 4 (averaged across channels 5–7), and layer 5 (averaged across channels 8–10). Note that although layers 2/3 and 5 show tendency for higher spiking rate in human IgG vs mAb3[GluN1] groups, only layer 4 shows a significant different between groups. Data: mean ± SEM; n = 9 slices from 4 control human IgG-treated mice and n = 10 slices from 4 mAb3[GluN1]-treated mice. P value is from the Mann-Whitney rank sum test comparing human IgG vs mAb3[GluN1] for each channel. Kruskal-Wallis ANOVA with multiple comparisons (Dunn’s method) with 5 degrees of freedom: P < 0.001 and using this method only layer 4 shows significant difference between human IgG and mAb3[GluN1] groups (P < 0.05 with multiple comparisons, 5 degrees of freedom). **P < 0.01.

Comment in

  • Reinvigorating drug development around NGF signaling for pain doi: 10.1172/JCI188251

References

    1. Dalmau J, et al. Clinical experience and laboratory investigations in patients with anti-NMDAR encephalitis. Lancet Neurol. 2011;10(1):63–74. doi: 10.1016/S1474-4422(10)70253-2. - DOI - PMC - PubMed
    1. Dalmau J, et al. Paraneoplastic anti-N-methyl-D-aspartate receptor encephalitis associated with ovarian teratoma. Ann Neurol. 2007;61(1):25–36. doi: 10.1002/ana.21050. - DOI - PMC - PubMed
    1. Baizabal-Carvallo JF, et al. The spectrum of movement disorders in children with anti-NMDA receptor encephalitis. Mov Disord. 2013;28(4):543–547. doi: 10.1002/mds.25354. - DOI - PubMed
    1. Goldberg EM, et al. Anti-N-methyl-D-aspartate receptor-mediated encephalitis in infants and toddlers: case report and review of the literature. Pediatr Neurol. 2014;50(2):181–184. doi: 10.1016/j.pediatrneurol.2013.10.002. - DOI - PubMed
    1. Hacohen Y, et al. N-methyl-D-aspartate receptor antibody-associated movement disorder without encephalopathy. Dev Med Child Neurol. 2014;56(2):190–193. doi: 10.1111/dmcn.12321. - DOI - PubMed

MeSH terms