. 2024 Dec 31;135(4):e183671.
doi: 10.1172/JCI183671.

Apex1 safeguards genomic stability to ensure a cytopathic T cell fate in autoimmune disease models

Affiliations

Apex1 safeguards genomic stability to ensure a cytopathic T cell fate in autoimmune disease models

Xiang Xiao et al. J Clin Invest. .

Abstract

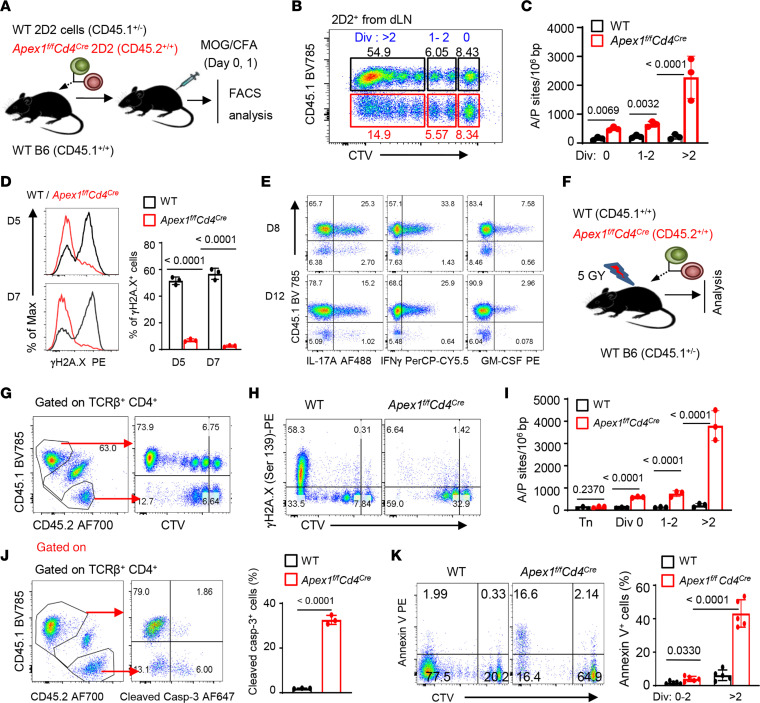
T cells have a remarkable capacity to clonally expand, a process that is intricately linked to their effector activities. As vigorously proliferating T cell also incur substantial DNA lesions, how the dividing T cells safeguard their genomic integrity to allow the generation of T effector cells remains largely unknown. Here we report the identification of the apurinic/apyrimidinic endonuclease-1 (Apex1) as an indispensable molecule for the induction of cytopathic T effectors in mouse models. We demonstrate that conditional deletion of Apex1 in T cells resulted in a remarkable accumulation of baseless DNA sites in the genome of proliferating T cells, which further led to genomic instability and apoptotic cell death. Consequently, Apex1-deleted T cells failed to acquire any effector features after activation and failed to mediate autoimmune diseases and allergic tissue damages. Detailed mutational analyses pinpointed the importance of its endonuclease domain in the generation of T effector cells. We provide further evidence that inhibiting the base repair activities of Apex1 with chemical inhibitors similarly abrogated the induction of autoimmune diseases. Collectively, our study suggests that Apex1 serves as a gatekeeper for the generation of cytopathic T cells and that therapeutically targeting Apex1 may have important clinical implications in the treatment of autoimmune diseases.

Keywords: Autoimmune diseases; Autoimmunity; Immunology; T cells.


Figures

Figure 1
Figure 1. DNA damage repair activities in T cells and the generation of conditionally Apex1-deleted mice.
(AC) WT CD4+ T cells were activated with anti-CD3/anti-CD28 for 24 (D1) and 48 (D2) hours in vitro. (A) Flow cytometry plots of γH2A.X in both naive (Tn) and activated CD4+ T cells (n = 3 independent replicates). (B) Volcano plot of RNA-seq data illustrating gene expression profiles between naive and activated CD4+ T cells 48 hours after activation, highlighting genes involved in DNA replication and base repair pathways (n = 3 biologically independent replicates). (C) Flow cytometry plots showing Apex1 expression in naive and activated CD4+ T cells (n = 5 biologically independent replicates). (D) Schematic rendering of targeted and deleted Apex1 allele. The Cre-mediated recombination results in the deletion of exons 2 and 3, which disrupts Apex1 gene expression in targeted mice. (E) Immunoblot analysis comparing Apex1 expression in CD4+ T cells from WT B6 and Apex1fl/flCd4Cre mice following in vitro activation, with naive WT CD4+ T cells serving as an additional control. (F) Flow cytometry plots of thymocytes of WT control and Apex1fl/flCd4Cre mice, showing 4 different cell subsets based on CD4 and CD8 staining (n = 5 mice per group). (G) Spleen cells from WT control and Apex1fl/flCd4Cre mice were analyzed by flow cytometry, showing comparable CD4+, CD8+, and Foxp3+ subsets (n = 6 mice per group). DP, double positive; DN, double negative. For both F and G, the percentages and absolute cell numbers of the indicated subsets between WT control and Apex1fl/flCd4Cre mice are presented in the bar graphs on the right. Data are presented as mean ± SD. Results are pooled from 2 or 3 independent experiments (AC, F, and G). The P values were calculated from 1-way ANOVA with Šidák’s post hoc test (A and C) and 2-tailed, unpaired Student’s t test (F and G).
Figure 2
Figure 2. Conditional deletion of Apex1 protects mice from immune-mediated tissue damage.
(A) Incidence and clinical scores of EAE in control (n = 7) and Apex1fl/flCd4Cre mice (n = 10). (B) Representative H&E (upper) and Luxol fast blue (bottom) staining of spinal cords on day 18 after EAE induction. Scale bars: 100 μm. (C) Flow cytometry plots showing IFN-γ+, IL-17A+, or GM-CSF+ cells among CD4+ cells from the spinal cords on day 18. (D) A cartoon rendering of the induction of allergic airway inflammation in mice. (E) Representative periodic acid–Schiff (PAS) staining of lung sections. Arrowheads indicate hyperplasia of mucin-producing cells in airway epithelia and stars indicate tissue inflammation. Scale bars: 100 μm. (F) The bar graphs show the lung histological scores (left) and frequency of PAS+ mucin-producing cells (right) in indicated mice (n = 6 per group). (G) Representative flow cytometry plots and bar graphs (n = 5 per group) showing frequency of IL-4+, IL-13+, or IL-5+ cells among CD4+ T cells from the bronchoalveolar lavage (BAL) of the indicated mice. Data are presented as mean ± SD. The P values are from a 2-way ANOVA (A) and 2-tailed, unpaired Student’s t test (F and G).
Figure 3
Figure 3. Failure of A/P site repairs results in genomic instability and apoptotic T cell death.
(AE) WT CD4+ 2D2 (CD45.1+/–) and Apex1fl/flCd4Cre 2D2 (CD45.2+) T cells were mixed at a 1:1 ratio (2 million each), labeled with CTV, and co-transferred into CD45.1+/+ WT B6 mice 1 day before EAE induction. The transferred 2D2 cells were tracked and analyzed at the indicated time point after EAE induction. (A) A cartoon rendering of experimental designs. (B) Flow cytometry plot showing frequencies of cell division cycles (0, 1–2, and >2) among the transferred 2D2 cells in the draining lymph nodes (dLNs) 4 days after EAE induction (n = 4 mice). (C) Bar graphs showing the number of A/P sites in divided 2D2 cells in (B) (n = 3 mice). (D) Representative flow cytometry plots (left) and bar graph (right) showing γH2A.X expression in the transferred 2D2 cells from dLNs on day 5 (D5) and D7 (n = 3 mice per group). (E) Flow cytometry plots showing the frequencies of effector 2D2 cells from the dLNs on day 8 and day 12 (n = 3 mice per group). (FK) Analyses of CTV-labeled WT CD45.1+/+ and Apex1fl/flCd4Cre (CD45.2+) CD4+ T cells co-transferred into irradiated CD45.1+/– syngeneic B6 mice at a 1:1 ratio (1 million each). (F) A cartoon rendering of experimental designs. (G and H) Representative flow cytometry plots showing cell divisions in vivo (G) and γH2A.X expression (H) of CTV-labeled CD4+ cells in the lymph nodes on day 9 (n = 3 mice). (I) Bar graphs showing the number of A/P sites among divided CD4+ cells on day 5 (n = 3 mice). (J) Flow cytometry plots showing the frequencies of transferred CD4+ T cells and their expression cleaved caspase-3 on day 5 (n = 3 mice). (K) Flow cytometry plots and bar graphs showing annexin V expression (n = 5 mice) among divided CD4+ cells on day 5. Data are presented as mean ± SD. The P values are from a 2-tailed, paired (C, D, J, and H) and unpaired (I) Student’s t test.
Figure 4
Figure 4. Dependence of Apex1 DNA base repair domain for T cell proliferation and effector functions.
(A) A diagram illustrating the domain structure of Apex1 and sites of point mutations. (BD) Apex1-deleted CD4+ T cells were activated and spin infected with retroviral vectors containing the full length (FL) or mutants of Apex1 or GFP-ctrl, labeled with CTV, and then transferred into Rag1–/– mice for analysis. (B) A schematic representation of experimental designs. (C and D) Representative histograms and bar graphs showing the percentage of cell division (C; n = 5 mice) and numbers of A/P sites (D; n = 3 mice) among the CD4+GFP+ cells on day 7 after transfer. (EI) Bone marrow (BM) stem cells from Apex1fl/flCd4Cre mice were transduced with retroviral vectors containing various Apex1 mutants and used to constitute the lethally irradiated Rag1–/– mice, the reconstituted mice were used as hosts for EAE induction 8 weeks later. (E) A diagram showing BM reconstitution and EAE induction. (F) Incidence and clinical scores of EAE in BM-reconstituted mice (n = 5 mice). (G) Tissue pathology of spinal cord sections 22 days after EAE induction (n = 3 mice). Arrowheads indicate inflammatory cell infiltration. Scale bars: 100 μm. (H and I) Flow cytometry plots (H) and bar graphs (I) showing frequencies of cytokine-producing CD4+ T cells in the CNS of host mice on day 22 (n = 3 mice). Data are presented as mean ± SD. The P values are calculated from 1-way ANOVA with Šidák’s post hoc test (C, D, and I) and 2-way ANOVA with Dunnett’s post hoc test (F).
Figure 5
Figure 5. Inhibition of Apex1 base repair activities, but not redox functions, prevents the induction of EAE.
(A) A diagram showing the workflow for EAE induction and treatment protocols. WT B6 mice were immunized with MOG/complete Freund’s adjuvant on days 0 and 1 and subsequently treated i.p. with vehicle control (n = 5), Apex1 inhibitor APX3330 (100 mg/kg, twice daily) (n = 5), starting on day 0 for 28 days, or methoxamine hydrochloride (MH, 75 mg/kg, every other day) starting on day 1 for 14 days (n = 7) or delayed MH treatment starting on day 7 for 11 days (n = 7). (B) Incidence and clinical scores of EAE in treated mice. (C) Representative tissue pathology of spinal cord sections on day 22 (n = 3 mice per group). Arrowheads indicate inflammatory cell infiltrates. Scale bars: 100 μm. (D and E) Representative flow cytometry plots (D) and bar graphs (E) showing effector phenotypes and inflammatory cytokine expression by CD4+ T cells obtained from CNS of treated mice 22 days after EAE induction (n = 3 mice per group). Data are presented as mean ± SD. The P values are from 2-way ANOVA with Dunnett’s post hoc test (B) and 1-way ANOVA with Šidák’s post hoc test (E).
Figure 6
Figure 6. Inhibition of Apex1 base repair activities suppresses EAE progression and promotes disease recovery.
(A) A diagram outlining EAE induction and MH treatment protocols when the disease was well established. (B) Incidence of EAE and clinical scores of control (saline) and MH-treated mice (n = 6 in each group). (C and E) Representative flow cytometry plots showing phenotypes and cytokine expression profiles of CD4+ T cells from the CNS (C) and draining lymph nodes (dLNs) (E) 32 days after EAE induction, and the bar graphs (D and F) depict the relative percentage of cytokine-producing CD4+ T cells in control and MH-treated mice. (GI) In vivo tracking of CTV-labeled 2D2 cells (0.25 million per mouse) in MOG-immunized WT B6 mice with or without MH treatment. (G) Workflow of EAE induction, 2D2 cell transfer, MH treatment protocol, and analysis. (H) Flow cytometry plots showing vigorous proliferation of 2D2 cells in the spleen and dLNs of MOG-immunized mice on day 7 prior to MH treatment. (I) Flow plots showing the state of 2D2 cells in the host spleen, dLNs, and CNS on day 22 in control and MH-treated mice (n = 3 mice in each group). Data are representative of 1 of 2 independent experiments (D and E). The P values were calculated from 2-way ANOVA (B) and 2-tailed, unpaired Student’s t test (C and D).

Similar articles

Cited by

References

    1. Soerens AG, et al. Functional T cells are capable of supernumerary cell division and longevity. Nature. 2023;614(7949):762–766. doi: 10.1038/s41586-022-05626-9. - DOI - PMC - PubMed
    1. Jackson SP, Bartek J. The DNA-damage response in human biology and disease. Nature. 2009;461(7267):1071–1078. doi: 10.1038/nature08467. - DOI - PMC - PubMed
    1. Makowski L, et al. Immunometabolism: from basic mechanisms to translation. Immunol Rev. 2020;295(1):5–14. doi: 10.1111/imr.12858. - DOI - PMC - PubMed
    1. Yang Y, et al. Reactive oxygen species in the immune system. Int Rev Immunol. 2013;32(3):249–270. doi: 10.3109/08830185.2012.755176. - DOI - PubMed
    1. Chou KM, Cheng YC. An exonucleolytic activity of human apurinic/apyrimidinic endonuclease on 3′ mispaired DNA. Nature. 2002;415(6872):655–659. doi: 10.1038/415655a. - DOI - PubMed

Substances