. 2025 Jan 28;44(1):115138.
doi: 10.1016/j.celrep.2024.115138. Epub 2024 Dec 30.

mRNA decay pre-complex assembly drives timely cell-state transitions during differentiation

Affiliations

mRNA decay pre-complex assembly drives timely cell-state transitions during differentiation

Hideyuki Komori et al. Cell Rep. .

Abstract

Complexes that control mRNA stability and translation promote timely cell-state transitions during differentiation by ensuring appropriate expression patterns of key developmental regulators. The Drosophila RNA-binding protein brain tumor (Brat) promotes the degradation of target transcripts during the maternal-to-zygotic transition in syncytial embryos and uncommitted intermediate neural progenitors (immature INPs). We identify ubiquitin-specific protease 5 (Usp5) as a candidate Brat interactor essential for the degradation of Brat target mRNAs. Usp5 promotes the formation of the Brat-deadenylase pre-complex in mitotic neural stem cells (neuroblasts) by facilitating Brat interactions with the scaffolding components of deadenylase complexes. The adaptor protein Miranda binds the RNA-binding domain of Brat, limiting its ability to bind target mRNAs in mitotic neuroblasts. Cortical displacement of Miranda activates Brat-deadenylase complex activity in immature INPs. We propose that the assembly of an enzymatically inactive and RNA-binding-deficient pre-complex poises mRNA degradation machineries for rapid activation, driving timely developmental transitions.

Keywords: Brat; CP: Developmental biology; CP: Molecular biology; Drosophila; Usp5; cell state transitions; deadenylase complexes; differentiation; mRNA decay; maternal mRNAs; neuroblast.


Conflict of interest statement

Declaration of interests The authors declare no competing interests.

Figures

Figure 1.
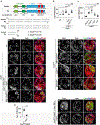
Figure 1.. Usp5, a newly identified Brat interactor, promotes the timely clearance of Brat target mRNAs during MZT
(A) Top: a schematic showing timing of the clearance of maternally deposited Brat target mRNAs during the MZT. y axis: Brat target mRNA levels. x axis: hours after the egg was laid. Bottom: the IP-MS strategy to identify Brat-interacting proteins using 0- to 3-h-old embryo extract. (B) The localization pattern of zygotically transcribed tll mRNAs serves as a marker for staging embryos. A 625 μm2 area anterior to tll mRNAs from low-magnification images was chosen to be re-imaged at high magnification for quantifying mRNA foci. (C–K) The clearance of CycE mRNAs appears indistinguishable between luciferase (luc), brat, or usp5 maternal-mutant embryos from NC12–NC14. 100 μm2 areas marked by solid lines in (C′), (F′), and (I′) were chosen from the 625 μm2 area marked by dashed lines from low-magnification images of NC12 embryos shown in (C), (F), and (I). An identical strategy was used to choose 100 μm2 areas in NC13 or NC14 embryos (low-magnification images not shown). (L) Quantification of CycE mRNA foci in a 100 μm2 area from luc, brat, or usp5 maternal-mutant embryos at NC12–NC14. n = 8–10 embryos. (M–U) The clearance of stg mRNAs is delayed in NC12–NC14 brat or usp5 maternal-mutant embryos relative to luc maternal-mutant embryos. 100 μm2 areas marked by solid lines in (M′), (P′), and (S′) were chosen following an identical strategy used in (C)–(K). (V) Quantification of stg mRNA foci in a 100 μm2 area from luc, brat, or usp5 maternal-mutant embryos at NC12–NC14. n = 10 embryos. Scale bars in low-magnification images: 50 μm. Graphs show mean number ± standard deviation. *p < 0.05, **p < 0.01, ***p < 0.001, ****p < 0.0001. “ns” indicates not significant.
Figure 2.
Figure 2.. Brat regulates basal localization and segregation of Usp5 during asymmetric neuroblast division
(A) A schematic showing the localization pattern of Mira (pink) and Brat (blue) during asymmetric neuroblast division. Dashed line indicates cortically displaced Mira in the newborn immature INP. (B–E) Brat is required for asymmetric localization and segregation of Usp5 in mitotic neuroblasts. The dashed line outlines the basal cortex of all prometaphase or telophase neuroblasts shown in this figure. (F–I) Brat asymmetrically localizes and segregates in mitotic usp5−/− neuroblasts. (J–M) Cysteine 341 of Usp5 is required for its asymmetric localization and segregation in mitotic neuroblasts. Larval brains overexpressing FLAG-tagged wild-type Usp5 or mutant Usp5 carrying an amino acid substitution at cysteine 341 were stained with antibodies against FLAG, Mira, and Phh3. Scale bars, 5 μm. n = 10 neuroblasts. wt, wild type; brat−/−, brat11/Df(2L)Exel8040; usp5−/−, usp5leon1/leon1.
Figure 3.
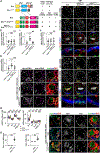
Figure 3.. Usp5 functions together with Brat to promote differentiation in immature INPs
(A) Key functional domains in Usp5 include two zinc-finger ubiquitin-binding domains (ZnF-UBPs), ubiquitin carboxyl-terminal hydrolase (UCH), and two ubiquitin-associated domains (UBAs). Molecular lesions associated with the usp5leon1 and usp5leon2 alleles occur at conserved amino acid residues in the C-terminal ZnF-UBP (cZnF-UBP). (B–F) Usp5 is required for cell viability and differentiation. Wild-type or usp5−/− brains that overexpress apoptotic inhibitor p35 alone or with a usp5 transgene were co-stained with antibodies against Dpn, Ase, and phalloidin (Phall). (G) Quantification of total type II neuroblasts per brain lobe of the indicated genotype. n = 10 brains per genotype. (H–K) Reducing usp5 function enhances the supernumerary neuroblast phenotype in brathypo brains. (L) Quantification of total type II neuroblasts per brain lobe of the indicated genotype. n = 4–10 brains per genotype. (M and N) Restoring usp5 function in immature INPs suppresses the supernumerary type II neuroblast phenotype in brat,usp5 double-mutant brains. The UAS-usp5 transgene driven by an immature INP-Gal4 (imm INP>). (O) Quantification of total type II neuroblasts per brain lobe of the indicated genotype. n = 10 brains per genotype. “−” indicates no transgene. Scale bars, 20 μm. The white dotted line separates the optic lobe from the central brain. White arrows: type II neuroblasts (Dpn+Ase; ≧ 9 μm in diameter). White asterisk: Ase immature INPs aberrantly expressing Dpn (≦5 μm in diameter). wt, wild type; brathypo, bratDG19310/11; usp5−/−, usp5leon1leon1; usp5hypo, usp5leon1/leon2; usp5RNAi, TRiP.JF02163; NB>, Wor-Gal4; type II NB>, Wor-Gal4,Ase-Gal80; Imm INP>, erm9D11-Gal4(II). Graphs show mean ± standard deviation. ***p < 0.001 and ****p < 0.0001. “ns” indicates not significant.
Figure 4.
Figure 4.. Usp5 promotes the downregulation of Brat target gene expression in immature INPs
(A and B) Newborn immature INPs generated by brat−/− neuroblasts display high levels of dpn mRNAs. Larval brains containing GFP-marked wild-type or brat−/− type II neuroblast mosaic clones were aged for 24 h following clone induction and were co-hybridized with dpn and opa smFISH probe sets. These brains were subsequently counterstained with an antibody against GFP. Ase+ immature INPs are excluded based on the presence of opa mRNAs. n = 8–10 clones. Scale bars, 5 μm. (C) Quantification of Brat target mRNAs or control RNAs in newborn immature INP in wild-type or brat−/− 24 h mosaic clones. (D) Newborn immature INPs generated by usp5−/− neuroblasts display high levels of dpn mRNAs. Clone induction, sample preparation, and data analyses were performed by following an identical protocol to that for the brains shown in (A) and (B). n = 8–10 clones. Scale bars, 5 μm. (E) Quantification of Brat target mRNAs or control RNAs in newborn immature INPs in 96 h wild-type or usp5−/− neuroblast clones. (F and G) The dpn3UTR reporter becomes aberrantly activated in usp5−/− newborn immature INPs. Wild-type or usp5−/− larval brains carrying a V5-dpn3UTR reporter transgene were stained with antibodies against V5, Dpn, DAPI, and Phall. Scale bars, 5 μm. (H) Quantification of relative reporter expression levels in wild-type vs. usp5−/− newborn immature INPs. The relative reporter expression levels were determined by calculating the ratio of V5 to DAPI. n = 10 brains. (I and J) usp5−/− newborn immature INPs aberrantly express Dpn. Larval brains containing GFP-marked wild-type or usp5−/− type II neuroblast mosaic clones aged for 96 h following induction were stained with antibodies against Dpn, Ase, and GFP. Scale bars, 5 μm. (K) Quantification of Dpn-expressing immature INPs per wild-type vs. usp5−/− clone. n = 10 clones. (L and M) 50% reduction in dpn gene dosage suppresses the supernumerary type II neuroblast phenotype in usp5−/− larval brains. Scale bars, 20 μm. (N) Quantification of total type II neuroblasts per brain lobe in usp5−/− larval brains alone or heterozygous for the dpn gene. n = 10 brain lobes. type II NB>, Wor-Gal4,Ase-Gal80. White dotted lines outline type II neuroblast clones. Magenta dotted lines outline the cell boundary. White arrows: type II neuroblasts. White arrowheads: newborn immature INPs. Yellow arrows: Ase+ INPs. Yellow arrowheads: INPs. wt, wild type; brat−/−, brat11/11; usp5−/−, usp5leon1/leon1. Graphs show mean ± standard deviation. *p < 0.05, **p < 0.01, ***p < 0.001, and ****p < 0.0001. “ns” indicates not significant.
Figure 5.
Figure 5.. Usp5 promotes assembly of the Brat-deadenylase pre-complex in mitotic neuroblasts
(A–D) The scaffolding components of the CCR4-Not1 and Pan2-Pan3 deadenylase complexes localize in the basal cortex of mitotic neuroblasts. Wild-type larval brains alone or overexpressing an UAS transgene were stained with antibodies against the indicated proteins. A dashed line outlines the basal cortex of mitotic neuroblasts. n = 10 neuroblasts. (E–G) Brat and Usp5 are required for asymmetric segregation of the scaffolding components of deadenylase complexes in mitotic neuroblasts. brat−/− brains, brat−/− brains overexpressing a UAS-pan3::V5 transgene, or usp5−/− brains were stained with antibodies against the indicated proteins. A dashed line outlines the basal cortex of mitotic neuroblasts. n = 10 neuroblasts. (H–J) Knocking down activity of the decapping protein complex enhances the supernumerary type II neuroblast phenotype in brathypo brains. White dotted lines separate the optic lobe from the central brain. Scale bars, 20 μm. (K) Quantification of total type II neuroblasts per brathypo brain lobe that overexpressed the indicated UAS-RNAi transgene. “−” indicates no transgene. n = 10–16 brain lobe. (L–N) Components of the decapping protein complex do not localize in the basal cortex of mitotic neuroblasts. Wild-type larval brains alone or carrying a pac::GFP(BAC) transgene were stained with antibodies against the indicated proteins. n = 10 neuroblasts. White dotted lines mark the basal cortex of mitotic neuroblasts. wt, wild type; brat−/−, brat11/Df(2L)Exel8040; brathypo, bratDG19310/11; usp5−/−, usp5leon1/leon1. Graphs show mean number ± standard deviation. ****p < 0.0001.
Figure 6.
Figure 6.. Mira regulates activation of the Brat-deadenylase complex in newborn immature INPs
(A) A schematic showing V5-tagged Mira and Myc-tagged Brat transgenic proteins. The two solid lines indicate domains that mediate Mira-Brat interactions. The table summarizes functions and localization patterns of the transgenic proteins. B1, B box 1; B2, B box 2; CC, coiled coil; CLD, cortical localization domain; CRD, cargo release domain; Y, yes; N, no. (B–D) dpn mRNAs are not enriched in the apical cortex of mitotic neuroblasts overexpressing wild-type or mutant transgenic Brat. aPKC localized in an apical crescent in metaphase neuroblasts. Enlarged images of the apical cortex marked by the thin dashed rectangle are shown on the bottom. Yellow arrows indicate dpn transcripts observed in the apical cortex. Thick dashed lines outline the cortex of neuroblasts. Scale bars, 1 μm. (E) The apical enrichment score for dpn mRNAs in mitotic neuroblasts overexpressing indicates transgenes. n = 10 neuroblasts. (F–H) dpn mRNAs become enriched in the basal cortex of mitotic neuroblasts overexpressing basally tethered mutant Brat. Myc-tagged Brat transgenic proteins localize in a basal crescent in metaphase neuroblasts. Enlarged images of the basal cortex marked by the thin dashed rectangle are shown on the bottom. (I) The basal enrichment score for dpn mRNAs in mitotic neuroblasts overexpressing indicated transgenes. n = 10 neuroblasts. (J and K) The enrichment score for klu mRNAs in the apical or basal cortex of mitotic neuroblasts overexpressing indicated transgenes. n = 10 neuroblasts. (L–N) dpn transcripts aberrantly persist in immature INPs that overexpressed mutant Mira transgenic protein tethered to the cell cortex. (O) Quantification of total mRNA foci in type II neuroblasts vs. newborn immature INPs in larval brains overexpressing the indicated transgene in the type II neuroblast lineage. n = 10 cells. (P–R) Dpn is aberrantly expressed in immature INPs that overexpressed mutant Mira transgenic protein unable to become displaced from the cortex. Scale bars, 20 μm in low-magnification images. The white dashed line separates the optic lobe from the central brain. (S) Quantification of immature INPs that aberrantly expressed Dpn per brain lobe of the indicated genotypes (left). Quantification of total type II neuroblasts per brain lobe of the indicated genotypes (right). Scale bars, 5 μm in all images except for 1 mm in the enlarged images shown in (B)–(D) and (F)–(H). NB>, Wor-Gal4; type II NB>, Wor-Gal4,Ase-Gal80. Magenta dotted lines outline the boundary of cells. White arrows: type II neuroblasts. White arrowheads: newborn immature INPs. Yellow arrows: Ase+ immature INPs. Graphs show mean ± standard deviation. ****p < 0.0001. “ns” indicates not significant.
Figure 7.
Figure 7.. Model for the regulation of Brat-mediated mRNA decay during MZT and asymmetric neuroblast division
The Brat-deadenylase pre-complex is enzymatically inactive and RNA-binding deficient in mitotic neuroblasts partly due to Mira binding. Cortical displacement of Mira in newborn immature INPs leads to activation of Brat-deadenylase complex activity. It is unclear whether similar spatiotemporal control of assembly and activation of the Brat-deadenylase complex occurs during MZT. Blue highlights components of the Brat-deadenylase complex, whereas cyan highlights components of a sub-complex that depends on Brat for asymmetric localization and segregation in mitotic neuroblasts.

Update of

Similar articles

References

    1. Connacher RP, and Goldstrohm AC (2021). Molecular and biological functions of TRIM-NHL RNA-binding proteins. Wiley. Interdiscip. Rev. RNA 12, e1620. - PMC - PubMed
    1. Vastenhouw NL, Cao WX, and Lipshitz HD (2019). The maternal-tozygotic transition revisited. Development 146, dev161471. - PubMed
    1. Despic V, and Neugebauer KM (2018). RNA tales - how embryos read and discard messages from mom. J. Cell Sci. 131, jcs201996. - PubMed
    1. Rissland OS (2017). The organization and regulation of mRNA-protein complexes. Wiley. Interdiscip. Rev. RNA 8, e1369. - PMC - PubMed
    1. Jukam D, Shariati SAM, and Skotheim JM (2017). Zygotic Genome Activation in Vertebrates. Dev. Cell 42, 316–332. - PMC - PubMed

Publication types

MeSH terms

LinkOut - more resources