. 2025 Feb;12(7):e2411538.
doi: 10.1002/advs.202411538. Epub 2024 Dec 30.

Novel Naphthyridones Targeting Pannexin 1 for Colitis Management

Affiliations

Novel Naphthyridones Targeting Pannexin 1 for Colitis Management

Wen-Yun Hsueh et al. Adv Sci (Weinh). 2025 Feb.

Abstract

Pannexin 1 (PANX1) forms cell-surface channels capable of releasing signaling metabolites for diverse patho-physiological processes. While inhibiting dysregulated PANX1 has been proposed as a therapeutic strategy for many pathological conditions, including inflammatory bowel disease (IBD), low efficacy, or poor specificity of classical PANX1 inhibitors introduces uncertainty for their applications in basic and translational research. Here, hit-to-lead optimization is performed and a naphthyridone, compound 12, is identified as a new PANX1 inhibitor with an IC50 of 0.73 µm that does not affect pannexin-homologous LRRC8/SWELL1 channels. Using structure-activity relationship analysis, mutagenesis, cell thermal shift assays, and molecular docking, it is revealed that compound 12 directly engages PANX1 Trp74 residue. Using a dextran sodium sulfate mouse model of IBD, it is found that compound 12 markedly reduced colitis severity, highlighting new PANX1 inhibitors as a proof-of-concept treatment for IBD. These data describe the mechanism of action for a new PANX1 inhibitor, uncover the binding site for future drug design, and present a targeted strategy for treating IBD.

Keywords: LRRC8; Pannexin; colitis; inflammatory bowel disease; naphthyridone; structure–activity relationship; trovafloxacin.


Conflict of interest statement

The authors declare no conflict of interest.

Figures

Figure 1
Figure 1
Identification of new PANX1 inhibitors from the newly synthesized naphthyridone analogues. A) Twenty‐seven naphthyridone analogues were synthesized by substituting 2,4‐difluorophenyl group at N1 position, carboxylic acid at C3 position, and cyclopropylamine‐fused pyrrolidine at C7 position of Trovan using varying R 1, R 2, or R 3 groups. B) A general synthesis scheme for naphthyridone analogues. Ethyl 3‐oxo‐3‐(pyridin‐3‐yl)propanoate I was reacted with triethyl orthoformate in the presence of acetic anhydride to form ethyl α‐(ethoxymethylene)‐propanoate. Amines or anilines listed as R 2 (from A) were sequentially added for condensation to generate enamine intermediates. Addition of K2CO3 to the intermediates led to the core naphthyridone structure II through nucleophilic aromatic substitution (SNAr). Various amines specified as R 1 (from A) were then reacted with the chloro group at the C7 position to produce compounds III. Finally, we modified the ester group of III at the C3 position to yield compounds IV. C) Exemplary flow cytometry analyses of To‐Pro‐3 uptake in HEK293T cells expressing EGFP‐tagged, full‐length (FL) or C‐terminally‐truncated (CT) human PANX1 (hPANX1). The green dashed lines demarcate cells with high EGFP signal intensity (EGFPHigh) used for dye uptake analysis. D) Representative histograms showing the To‐Pro‐3 uptake obtained from the EGFPHigh cells expressing hPANX1‐FL‐EGFP or hPANX1‐CT‐EGFP, including after treatment with carbenoxolone (CBX, 50 µm), Trovan (20 µm), or two naphthyridone analogues, compounds 12 and 20 (20 µm). E) Bar graph showing the mean fluorescence intensity (MFI) of To‐Pro‐3 uptake obtained from EGFPHigh cells expressing hPANX1‐FL‐EGFP or hPANX1‐CT‐EGFP, with or without application of CBX (50 µm), Trovan (20 µm), or naphthyridone analogues (20 µm). Cyan shaded area indicates 95% confidence interval of Trovan‐mediated effects on To‐Pro‐3 MFI.
Figure 2
Figure 2
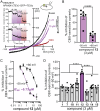
Compound 12 demonstrated a dose‐dependent inhibition on PANX1 currents. A) Exemplar whole‐cell current–voltage (I‐V) relationships obtained from a HEK293T cell expressing hPANX1(TEV)‐EGFP and TEV protease (TEVp). The basal current (black) was reduced by bath application of compound 12 (3 or 10 µm) or CBX (50 µm). Inset: Corresponding time course of whole‐cell current amplitudes obtained at either +80 mV (upper) or −50 mV (lower). No CBX‐sensitive current was detected in HEK293T cells only expressing hPANX1(TEV)‐EGFP. B) Compound 12 showed a voltage‐dependent inhibition on the PANX1 currents, where the percent inhibition of PANX1 currents at −50 mV is significantly greater than that at +80 mV. n = 6 individual cells. p = 0.0002 by two‐tailed, unpaired t‐test. C) IC50 of compound 12 is ≈0.73 µm based on whole‐cell recordings at −50 mV (n = 5–6 cells). D) At 3 µm, compound 12 showed a significantly higher percent inhibition of PANX1 currents at −50 mV than other compounds n = 5–11 cells per group. ****: p ≤ 0.0001 using one‐way ANOVA with Bonferroni test. All data are shown as means ± SEM.
Figure 3
Figure 3
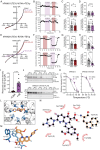
Trp74 is a critical residue for PANX1‐compound 12 interactions. A) Representative whole‐cell I‐V relationships of HEK293T cells coexpressing hPANX1(TEV)‐W74A and TEVp, under basal conditions and in the presence of CBX (50 µm) or compound 12 (20 µm). B) Corresponding time series (from A) of whole‐cell current amplitudes at +80 mV (upper) and −50 mV (lower). C,D) Summary results (n = 8 cells) of whole‐cell current density before or after application of CBX C) or compound 12 D). P values derived from two‐tailed, unpaired t‐test are indicated (n = 8 cells). ns: not significant. E) Representative whole‐cell IV relationships of a HEK293T cell coexpressing hPANX1(TEV)‐R75A and TEVp, with or without the presence of CBX (50 µm), compound 12 (20 µm). F) Corresponding time series (from E) of whole‐cell current amplitudes at +80 mV (upper) and −50 mV (lower). G,H) Summary results (n = 8 cells) of whole‐cell current density before or after application of CBX G) or compound 12 H). I) Inhibition of TEVp‐activated hPANX1(TEV)‐R75A by compound 12 was greater than by CBX. Data are presented as means ± SEM. P values derived from two‐tailed, unpaired t‐tests are as indicated (n = 8 cells). ns: not significant. J) Representative immunoblots of cell thermal shift assays (CETSA) obtained from HEK293T cells expressing either hPANX1‐FLAG (upper) or hPANX1‐W74A‐FLAG (lower), with or without compound 12 (50 µm), at indicated temperatures. Αnti‐α‐tubulin was used as a loading control. K) Grouped results showing the intensity of immunoreactive signals from hPANX1 (left) or hPANX1‐W74A (right) at different temperatures, relative to that at 63.3 °C. ***: p ≤ 0.001 using two‐way ANOVA with Bonferroni's test (n = 3 biologically independent experiments). Curves represent the fitted results using a sigmoidal model. L) Diagram presents the extracellular view of a top‐ranked PANX1‐compound 12 docking model proposed by using PyRx program. Trp74 residues from 7 PANX1 subunits A–G are highlighted in blue. M) Three hydrogen bonds (blue dashed lines) and 2 π‐stacking (green dashed lines) are predicted by using Protein–Ligand Interaction Profiler (PLIP). N) Schematics show one hydrogen bond (blue dashed lines) and several hydrophobic interactions (eyebrow‐like icons) between PANX1 and compound 12 predicted by using LigPlot+.
Figure 4
Figure 4
Compound 12 does not inhibit LRRC8/SWELL1 channels or human topoisomerase II. A–C) Hypotonic (125 mOsm)‐induced sulfo‐Cy5 uptake was assessed in wild‐type A), Cas9‐expressing B), or PANX1‐deleted C) HEK293T cells and was reduced by treatments of CBX (50 µm) or dicoumarol (Dic; 20 µm), but not Trovan or compound 12 (20 µm). *: p ≤ 0.05, **: p ≤ 0.01, ***: p ≤ 0.001, ns: not significant by one‐way ANOVA followed by Bonferroni's test (n = 3–6 independent experiments). D) Averaged YFP signal intensity of HEK293T cells expressing YFP‐H148Q/I152L in isotonic (Iso; 310 mOsm) or hypotonic (Hypo; 125 mOsm) solutions in response to NaI (10 mm), with or without a preincubation with dicoumarol (Dic), CBX, Trovan, or compound 12. P values derived from two‐way ANOVA with Dunnett's test are shown (n = 4 biologically independent experiments). E) Normalized intensity of decatenated DNA showing that a topoisomerase inhibitor, VP16 (0.1 mm), but neither Trovan nor compound 12 (20 or 200 µm), reduced signal intensity of decatenated DNA as an indication of inhibition on human topoisomerase II. P values derived from one‐way ANOVA with Dunnett's test (n = 3–5 independent experiments) were indicated. Inset: Exemplar results of topoisomerase II assay. Arrowhead: catenated DNA. Arrows: decatenated DNA.
Figure 5
Figure 5
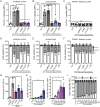
Compound 12 inhibits the activity of native PANX1 channels in the apoptotic Jurkat cells. A–C) Flow cytometry analyses showing the averaged MFI of Yo‐Pro‐1 uptake in live or UV‐induced (100 mJ cm−2) apoptotic wildtype A), Cas9‐expressing B), or PANX1‐deleted C) Jurkat cells, with or without treatements of vehicle (DMSO), CBX (50 µm), Trovan (20 µm), or compound 12 (20 µm) (n = 2–4 independent experiments). **: p ≤ 0.01, ***: p ≤ 0.001, ****: p ≤ 0.0001, ns: not statistically significant by using one‐way ANOVA with Bonferroni post hoc test. D–F) Percentage of viable (Annexin V/7‐AAD), apoptotic (Annexin V+/7‐AAD), and necrotic (7‐AAD+) cells obtained from the flow cytometry analyses of wildtype D), Cas9‐expressing E), or PANX1‐deleted F) Jurkat cells with or without UV‐irradiation, DMSO, CBX, Trovan or compound 12 as shown in (A–C) (n = 2–4 independent experiments). G) Averaged results of extracellular ATP levels (relative light unit; RLU) obtained from wildtype Jurkat cells in the presence or absence of BH3‐mimetic ABT‐737 (5 µm)/S63845 (10 µm), with or without applying CBX (500 µm), Trovan (20 µm), or compound 12 (20 µm) for 2 h. *: p ≤ 0.05, ***: p ≤ 0.001, ns: not significant by one‐way ANOVA followed by Bonferroni's test (n = 3 independent experiments). H) Formation of apoptotic body (ApoBD) observed from UV‐irradiated (150 mJ cm−2) Jurkat cells in the presence or absence of Trovan (2.5–20 µm; left) or compound 12 (2.5–20 µm; right). *: p ≤ 0.05, **: p ≤ 0.01 using one‐way ANOVA followed by Dunnett's test (n = 3 independent experiments). I) Percentages of viable, apoptotic, and necrotic cells, as determined based on Annexin V‐FITC/To‐Pro‐3 staining using a previously described electronic gating strategy,[ 62 ] were obtained from the flow cytometry analyses of wildtype Jurkat cells exposed to UV as shown in (H) (n = 3 independent experiments). Each dot represents data from a biological replicate of experiments. All histograms are preseted as means ± SEM.
Figure 6
Figure 6
Compound 12 mitigated colitis symptoms and pathology in DSS‐treated mice. A) Schematic diagram illustrates the experimental design of DSS‐induced colitis mice. C57BL/6 mice were fed with regular drinking water (control) or 3% DSS‐containing water for 14 days before intraperitoneal injections of compound 12 or Trovan for an additional of 5 consecutive days. Mice were sacrificed on the 7th day after drug administration for macroscopic, biochemical or histological analyses. B) Averaged body weights of control or DSS‐fed mice, with or without treatments of DMSO (vehicle control), Trovan (15 or 30 mg kg−1) or compound 12 (10 or 15 mg kg−1). C) Grouped data showing the disease activity index (DAI) of control and DSS‐induced colitis mice, with or without Trovan or compound 12 treatments. D) Grouped results of colon lengths from control or colitis mice treated with DMSO, Trovan, or compound 12 as indicated. Each dot represents an individual colon sample. E) Grouped results of the colitis scores from mice of the indicated treatments. Each dot represents the colitis score of an individual mouse. F) Extracellular concentration of ATP measured from ex vivo mouse colon samples of the indicated treatments. Each dot represents the data from an individual mouse. G) Groups results showing the averaged numbers of TUNEL+ cells within each high‐power field (HPF) of colon samples from mice of the indicated treatments. Each dot represents the data of an individual HPF. Averaged results are shown as means ± SEM from ≈10 to 25 mice per group. *: p ≤ 0.05, **: p ≤ 0.01, ***: p ≤ 0.001, ****: p ≤ 0.0001, ns: not significant using one‐way D–G) or two‐way B,C) ANOVA followed by Bonferroni's test between the indicated groups.

Similar articles

References

    1. Zhang Q., Raoof M., Chen Y., Sumi Y., Sursal T., Junger W., Brohi K., Itagaki K., Hauser C. J., Nature 2010, 464, 104. - PMC - PubMed
    1. Di Virgilio F., Dal Ben D., Sarti A. C., Giuliani A. L., Falzoni S., Immunity 2017, 47, 15. - PubMed
    1. Verkhratsky A., Burnstock G., BioEssays 2014, 36, 697. - PubMed
    1. Penuela S., Bhalla R., Gong X. Q., Cowan K. N., Celetti S. J., Cowan B. J., Bai D., Shao Q., Laird D. W., J. Cell Sci. 2007, 120, 3772. - PubMed
    1. a) Medina C. B., Mehrotra P., Arandjelovic S., Perry J. S. A., Guo Y., Morioka S., Barron B., Walk S. F., Ghesquiere B., Krupnick A. S., Lorenz U., Ravichandran K. S., Nature 2020, 580, 130; - PMC - PubMed
    2. b) Narahari A. K., Kreutzberger A. J., Gaete P. S., Chiu Y. H., Leonhardt S. A., Medina C. B., Jin X., Oleniacz P. W., Kiessling V., Barrett P. Q., Ravichandran K. S., Yeager M., Contreras J. E., Tamm L. K., Bayliss D. A., Elife 2021, 10, 64787. - PMC - PubMed

LinkOut - more resources