. 2025 Feb;12(8):e2413674.
doi: 10.1002/advs.202413674. Epub 2024 Dec 30.

TRIM21 Promotes Tumor Growth and Gemcitabine Resistance in Pancreatic Cancer by Inhibiting EPHX1-Mediated Arachidonic Acid Metabolism

Affiliations

TRIM21 Promotes Tumor Growth and Gemcitabine Resistance in Pancreatic Cancer by Inhibiting EPHX1-Mediated Arachidonic Acid Metabolism

Xiaona Fan et al. Adv Sci (Weinh). 2025 Feb.

Abstract

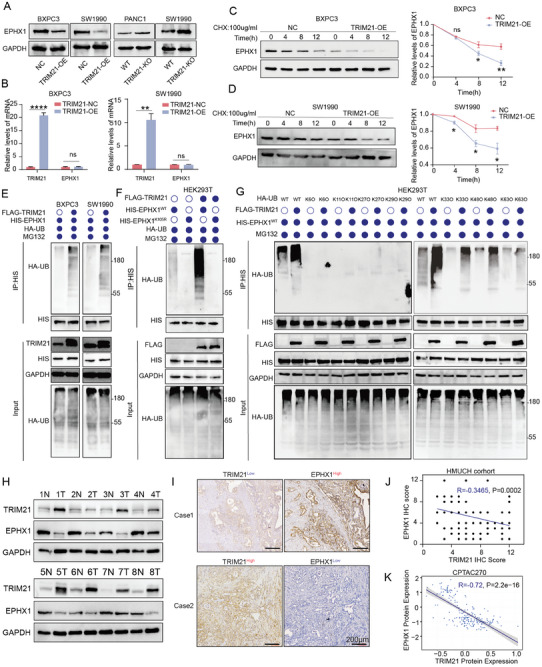
Pancreatic cancer (PC) progresses rapidly, and gemcitabine-based chemotherapy has brought only limited efficacy. Identifying key drivers and therapeutic targets holds significant clinical value. In this study, through comprehensive analysis of multiple PC databases, this work identifies TRIM21 as a promising driver mediator. This work further performs loss- and gain-of-function assays for TRIM21, revealing that TRIM21 knockout inhibits tumor proliferation and gemcitabine resistance both in vitro and vivo. Lipidomics reveal that silencing TRIM21 reduce the arachidonic acid production, and inhibit ferroptosis. Mechanically, through proteomics, ubiquitomics, and liquid chromatography-tandem mass spectrometry analysis, the key metabolic enzyme of arachidonic acid -EPHX1 is identified as a downstream substrate of TRIM21. TRIM21 interacts with EPHX1 through its SPRY domain and promotes ubiquitin-mediated degradation of EPHX1 via K33- and K48-linked ubiquitination at the K105 site. Given the targeting potential, this work screens Bezafibrate to block the interaction between TRIM21 and EPHX1 and validates its sensitizing effect. In summary, TRIM21 promotes tumour growth and gemcitabine resistance in PC by inhibiting EPHX1-mediated arachidonic acid metabolism. This provides a novel and promising target for clinical treatment of PC.

Keywords: EPHX1; TRIM21; arachidonic acid metabolism; pancreatic cancer; ubiquitination.


Conflict of interest statement

The authors declare no conflict of interest.

Figures

Figure 1
Figure 1
TRIM21 is upregulated in pancreatic cancer (PC) and is associated with poor response to gemcitabine treatment. A) Schematic diagram illustrating the process of identifying TRIM21 as a prognostic gene in PC and a gene associated with gemcitabine resistance. B,C) Western blot analysis showing TRIM21 protein level in fresh PC and adjacent non‐cancerous tissues. D) TRIM21 mRNA expression in fresh PC and adjacent non‐cancerous tissues (n = 25) using RT‐qPCR analysis. E) mRNA and Western blot analysis of TRIM21 expression in normal pancreatic ductal epithelial cell line HPDE6‐C7 and six PC cell lines. F) Immunohistochemistry (IHC) analysis confirming that TRIM21 expression were higher in tumor tissues compared to adjacent non‐cancerous tissues. Scale bars, 800 µm (exterior), 60 µm (interior). G) Statistical analysis of TRIM21 IHC staining intensity between tumor and adjacent tissues in the Harbin Medical University Cancer Hospital (HMUCH) cohort (n = 60). H) IHC staining intensity of TRIM21 was scored as 1 (+, weak), 2 (++, moderate), or 3 (+++, strong). I) Kaplan‐Meier survival analysis of PC patients in the HMUCH cohort (n = 116) correlating TRIM21 expression with survival probability. The log‐rank test: p < 0.0001. J) Kaplan‐Meier survival analysis in the CPTAC248 cohort correlating TRIM21 expression with survival probability. Statistical analysis was performed using the log‐rank test: p = 0.005. K) Correlation between TRIM21 expression and the therapeutic efficacy of gemcitabine in PC patients (n = 40). L) Statistical analysis of the correlation between TRIM21 expression and the therapeutic efficacy of gemcitabine in PC patients (n = 40) using the chi‐square test: p = 0.023. M. TRIM21 expression(left) in representative patients responding or not responding to gemcitabine and imaging changes before and after treatment (right). Statistical significance in the figures is indicated as follows: ns>0.05; ** for 0.001 ≤ p < 0.01; *** for 0.0001 ≤ p < 0.001; **** for p < 0.0001.
Figure 2
Figure 2
TRIM21 promotes the proliferation of pancreatic cancer in vivo and vitro. A–E) Effects of TRIM21 overexpression on the proliferation ability of the BXPC3 and SW1990 cell lines was measured using colony formation (A), CCK8 (B, C), and EdU (D, E). F–J) Effects of TRIM21 knockout on the proliferation ability of the SW1990 and PANC1 cell line was measured using colony formation (F), CCK8 (G, H), and EdU (I, J). K) Pan02 cells infected with pLV‐TRIM21‐luc virus or pLV‐control‐luc virus were used to establish C57BL/6 pancreatic cancer orthotopic mouse model(n = 6). Orthotopic mouses were performed in vivo imaging of mice on days 14, 21, and 28. L) Images of Orthotopic xenograft tumor in Pan02‐NC and Pan02‐TRIM21‐OE. M) Quantification of fluorescence values from in vivo imaging of the orthotopic mouse model(n = 6). N) Weight analysis of the two groups with orthotopic xenograft tumors(n = 6). Statistical analysis was performed using a two‐tailed unpaired t‐test in (A, D, E, F, I, J, M, N) and statistical analysis was performed using Two‐Way ANOVA in (B, C, G, H) Data are presented as mean ± SEM. Statistical significance in the figures is indicated as follows: ns > 0.05; * for p < 0.05; ** for 0.001 ≤ p < 0.01; and *** for 0.0001 ≤ p < 0.001, **** for p < 0.0001.
Figure 3
Figure 3
TRIM21 enhances gemcitabine resistance in pancreatic cancer. A) Western blot was performed to assess the expression of TRIM21 in the gemcitabine‐resistant or gemcitabine‐sensitive cell lines (BXPC3‐GR/GS and SW1990‐GR/GS). B) Colony formation assays were conducted following gemcitabine treatment in NC and TRIM21‐knockout BXPC3‐GR and SW1990‐GR cell lines. C) The changes in IC50 values were determined after TRIM21 knockout in BXPC3‐GR and SW1990‐GR cells. D,E) Annexin‐V/PI analysis was performed on NC and TRIM21‐knockout BXPC3‐GR (D) and SW1990‐GR (E) cell lines following gemcitabine treatment. F,G) In PDX models, tumor volume and growth curves were monitored in PDX#1, PDX#2 (F), PDX#3, and PDX#4 (G) following treatment with gemcitabine (50 mg kg−1 weekly) or an equal volume of saline (Control group) (n = 4). H) Tumor weights were measured and statistically analyzed between the gemcitabine and Control groups in PDX#1, PDX#2, PDX#3, and PDX#4 (n = 4). I) Tumor growth inhibition index (TGI) was calculated for PDX#1, PDX#2, PDX#3, and PDX#4 following gemcitabine treatment (n = 4), Data are presented as mean ± SD. J) Representative immunohistochemistry staining of TRIM21, PCNA, and KI67 from tumors of PDX models. Scale bars, 200 µm. K, L) Quantitative analysis of PCNA(K) and KI67(L). Statistical analysis was performed using a two‐tailed unpaired t‐test in (B, D, E, H, I, K, L), and statistical analysis was performed using Two‐Way ANOVA in (F, G), Data are presented as mean ± SEM. Statistical significance in the figures is indicated as follows: ns > 0.05; * for p < 0.05; ** for 0.001 ≤ p < 0.01; *** for 0.0001 ≤ p < 0.001; and **** for p < 0.0001.
Figure 4
Figure 4
TRIM21 promotes tumors through interacting with and enhancing degradation EPHX1. A,B) Volcano plots display the differentially expressed proteins (A) and ubiquitin modification sites (B) between PANC1‐WT and PANC1‐TRIM21‐knockout cell (|Fold change| > 1.5, p < 0.05). C) A nine‐quadrant plot illustrates the integrated analysis of proteomics and ubiquitinomics, with each quadrant showing the differentially expressed proteins and ubiquitin modification sites with a threshold of |Fold change| > 1.5 and p < 0.05. D) The Venn diagram represents the intersection of proteins that were upregulated in PANC1‐TRIM21‐KO and protein with decreased ubiquitination sites, following LC–MS/MS analysis of PANC1 overexpressing TRIM21. E) Immunoprecipitation was performed in BXPC3 and SW1990 cells after overexpressing FLAG‐TRIM21, with WT used as a negative control. Immunoprecipitation was performed using FLAG‐magnetic beads. F) Immunoprecipitation was performed in BXPC3 and SW1990 cells after overexpressing HIS‐EPHX1, with WT used as a negative control. Immunoprecipitation was performed using HIS‐magnetic beads. G) Laser confocal microscopy images show the co‐localization of FLAG‐TRIM21 and EPHX1 in BXPC3 and SW1990 cells. The scale bars represent 50 (upper) and 10 µm (lower). H) The strategy for constructing truncated TRIM21 plasmids. I) HEK293T cells were transfected with HIS‐EPHX1 and indicated full‐length or truncated mutants of FLAG‐TRIM21. Co‐immunoprecipitation was used to detect the interaction between EPHX1 and the truncated regions of TRIM21.
Figure 5
Figure 5
TRIM21 via promoting K33‐and K48‐linked poly‐ubiquitinates EPHX1 at lysine 105. A) Detecting EPHX1 protein expression following TRIM21 overexpression and knockout. B) RT‐qPCR was used to measure EPHX1 mRNA expression after TRIM21 overexpression. C,D) Western blot analysis was conducted on BXPC3 and SW1990 cells overexpressing TRIM21, which were treated with cycloheximide (CHX), to assess the remaining EPHX1 protein levels at specific time points. E) Co‐IP followed by western blotting was used to detect the polyubiquitination levels of EPHX1 in BXPC3 (left) and SW1990 (right) cells transfected with HIS‐EPHX1, FLAG‐TRIM21, and HA‐UB. F) Co‐IP followed by western blotting was used to detect the polyubiquitination levels of EPHX1 in HEK293T cells were transfected with HA‐UB and either HIS‐EPHX1 or HIS‐EPHX1K105R (lysine 105 to arginine 105 mutant), with or without FLAG‐TRIM21. G) HEK293T cells were transfected with HIS‐EPHX1, FLAG‐TRIM21, and HA‐ubiquitin mutants at different sites, followed by Co‐IP and Western blot analysis. H) Western blot analysis was performed to detect TRIM21 and EPHX1 protein levels in fresh pancreatic cancer tissues and adjacent non‐tumor tissues(n = 8). I) Representative immunohistochemistry images showing the protein expression of EPHX1 and TRIM21. Scale bars, 200 µm. J) Immunohistochemistry analysis was used to evaluate the correlation between EPHX1 and TRIM21 protein expression (n = 112, Pearson correlation test). K) Pearson correlation analysis of EPHX1 and TRIM21 protein levels in a public proteomics dataset (CPTAC270). All Co‐IP experiments for ubiquitination detection were conducted 48 h post‐transfection, followed by a 4‐h treatment with MG132. Data are presented as mean ± SEM. Statistical analysis used two‐tailed unpaired t‐tests for (B, C, D) significance in the figures is indicated as follows: ns > 0.05; * for p < 0.05; ** for 0.001 ≤ p < 0.01; *** for 0.0001 ≤ p < 0.001; and **** for p < 0.0001.
Figure 6
Figure 6
EPHX1 mediates ferroptosis induced by arachidonic acid (AA) to inhibit PC proliferation A) Heatmap illustrated the top five most altered class I lipid metabolites in the PANC1‐knockout (KO) group (n = 6, p < 0.05), with LIPID‐N‐0098 (arachidonic acid, AA) highlighted in red. B) ELISA was conducted to assess changes in AA after interfering with EPHX1 in BXPC3 and SW1990 cell lines. C) Flow cytometry measured changes in ROS fluorescence intensity after treating BXPC3 and SW1990 cell lines with different concentrations of AA for 72 h. D) Flow cytometry assessed the percentage of C11‐BODIPY‐+ (%) following treatment with Erastin. E) Flow cytometry compared the percentage of C11‐BODIPY+ (%), between the WT group and the EPHX1‐KO group, with or without AA (100 µM, 72 h). F) Transmission electron microscopy images of the EPHX1‐OE group exhibit mitochondrial morphological alterations characteristic of ferroptosis. G) Western blotting analyzed GPX4 expression levels in BXPC3 and SW1990 cell lines, after EPHX1 overexpression or knockout. H, I, J) Tumor size, tumor weight, and tumor growth curves were compared between the SW1990‐WT and SW1990‐EPHX1‐knockout (KO) groups in a subcutaneous xenograft BALB/c‐nude mice model. Data are presented as mean ± SEM. Statistical analysis used two‐tailed unpaired t‐tests for (B, C, D, E, F, J), and two‐way ANOVA for I) Statistical significance in the figures is indicated as follows: ns > 0.05; * for p < 0.05; ** for 0.001 ≤ p < 0.01; *** for 0.0001 ≤ p < 0.001; and **** for p < 0.0001.
Figure 7
Figure 7
Bezafibrate sensitizes gemcitabine by preventing the interaction between TRIM21 and EPHX1. A, B) The proliferation of WT group, TRIM21‐OE group, and TRIM21 and EPHX1 co‐overexpression group in BXPC3 and SW1990. C) ELISA results show the AA levels in WT group, TRIM21‐OE group, and TRIM21 and EPHX1 co‐overexpression group in BXPC3 and SW1990. D–F) Tumor images, tumor volume, and tumor growth curves of subcutaneous xenograft experiments were assessed in SW1990 for the WT group, TRIM21‐OE, and TRIM21 and EPHX1 co‐overexpression groups. G) The molecular docking between Bezafibrate and the TRIM21‐SPRY domain was performed using AutoDock Vina software and visualized with PyMOL software. H) The AlphaFold2 approach revealed that the binding site of TRIM21 to Bezafibrate is a critical site for its interaction with EPHX1. I) Western blot analysis of EPHX1 protein levels in BXPC3 and SW1990 cells after 48 h of treatment with varying concentrations of Bezafibrate. J) Co‐immunoprecipitation (Co‐IP) were conducted after 48 h of treatment with different concentrations of Bezafibrate following the transfection of FLAG‐TRIM21 and HIS‐EPHX1 into BXPC3 and SW1990 cells. K, L) Subcutaneous xenograft experiments using SW1990‐GR cells were conducted, and tumor volume, growth curves, and tumor weight were assessed following treatments with saline, gemcitabine, and gemcitabine + Bezafibrate (n = 5). M) Tumor weights of SW1990‐GR subcutaneous xenografts after different treatment methods. N) The schematic illustrates that TRIM21 reduces the production of AA and inhibits ferroptosis by down‐regulating the expression of EPHX1, thereby promoting tumor growth and gemcitabine resistance. A, B, E, L) were analyzed using one‐way ANOVA followed by Tukey's multiple comparisons test, and C, F, M) were analyzed using two‐tailed unpaired t‐tests. Data are presented as mean ± SEM. Statistical significance in the figures is indicated as follows: ns > 0.05; * for p < 0.05; ** for 0.001 ≤ p < 0.01; *** for 0.0001 ≤ p < 0.001; and **** for p < 0.0001.

References

    1. Siegel R. L., Miller K. D., Wagle N. S., Jemal A., Ca‐Cancer J. Clin. 2023, 73, 17. - PubMed
    1. Rahib L., Smith B. D., Aizenberg R., Rosenzweig A. B., Fleshman J. M., Matrisian L. M., Cancer Res. 2014, 74, 2913. - PubMed
    1. Bray F., Ferlay J., Soerjomataram I., Siegel R. L., Torre L. A., Jemal A., Cancer J. Clin. 2018, 68, 394. - PubMed
    1. Yu X., Holist. Integr. Oncol. 2024, 3, 35.
    1. Von Hoff D. D., Ervin T., Arena F. P., Chiorean E. G., Infante J., Moore M., Seay T., Tjulandin S. A., Ma W. W., Saleh M. N., Harris M., Reni M., Dowden S., Laheru D., Bahary N., Ramanathan R. K., Tabernero J., Hidalgo M., Goldstein D., Van Cutsem E., Wei X., Iglesias J., Renschler M. F., N. Engl. J. Med. 2013, 369, 1691. - PMC - PubMed

MeSH terms

LinkOut - more resources