. 2025 Mar;12(10):e2410747.
doi: 10.1002/advs.202410747. Epub 2024 Dec 30.

Effects of Graphene Quantum Dots on Renal Fibrosis Through Alleviating Oxidative Stress and Restoring Mitochondrial Membrane Potential

Affiliations

Effects of Graphene Quantum Dots on Renal Fibrosis Through Alleviating Oxidative Stress and Restoring Mitochondrial Membrane Potential

Kyu Hong Kim et al. Adv Sci (Weinh). 2025 Mar.

Abstract

Podocyte injury and proteinuria in glomerular disease are critical indicators of acute kidney injury progression to chronic kidney disease. Renal mitochondrial dysfunction, mediated by intracellular calcium levels and oxidative stress, is a major contributor to podocyte complications. Despite various strategies targeting mitochondria to improve kidney function, effective treatments remain lacking. This study investigates the potential of graphene quantum dots (GQDs) in mitigating renal fibrosis and elucidates their underlying mechanisms. In animal models of Adriamycin-induced nephropathy and 5/6 subtotal nephrectomy, GQDs treatment exhibits anti-inflammatory, anti-fibrotic, and anti-apoptotic effects by restoring podocyte actin structure. These therapeutic benefits are associated with the downregulation of transient receptor potential channel 5 (TRPC5) activity, which is related to kidney fibrosis and mitochondrial dysfunction. In vitro, GQDs suppress TRPC5, enhancing anti-fibrotic and anti-apoptotic effects by lowering calcium levels under oxidative stress and mechanical pressure. Anti-oxidative and anti-senescent effects are also confirmed. Most significantly, transcriptomics and electron microscopy analyses reveal that GQD treatment enhances mitochondrial respiration-related gene profiles and improves mitochondrial cristae morphology. These findings suggest that GQDs are a promising therapeutic nanomaterial for renal cell damage, capable of modulating calcium-dependent apoptosis associated with mitochondrial injury, potentially slowing fibrosis progression.

Keywords: TRPC5; graphene quantum dots; mitochondrial membrane potential; oxidative stress; renal fibrosis.


Conflict of interest statement

The authors declare that they have no competing interests.

Figures
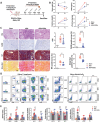
Figure 1
Figure 1
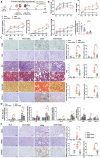
Ameliorating effect of GQDs on renal injury in an ADN mouse model. A) A schematic of the ADN+GQDs mouse model, AD (11.5 mg kg−1, I.V) and GQDs (10 or 20 mg kg−1, I.P.) were injected into BALB/c (Male, 8 W) mice (n = 8). B) The body weights, BUN, creatinine level, and urine protein/Cr ratio of mice after AD administration (n = 8 per group) are shown. C) Immunohistochemistry images and the quantification results of kidney sections from AD+GQDs treated mice at 7 days. GSI, glomerulosclerosis index. Sham (n = 6), ADN (n = 8), and ADN+GQDs (n = 8). Scale bars, 250 µm (40×) and 100 µm (100×). D) Kidney‐resident immune cell types in the ADN mouse model, representing 2 populations [kidney T‐cells, CD3e+CD8e+CD4+CD25+CD44+; kidney myeloid cells, CD11b+GR‐1+CD206+], were determined by flow cytometry. E) Band intensity of western blot results was determined by densitometric quantification and normalized to GAPDH (n = 6 per group). Experiments were repeated at least 3 times, and the data are shown as the mean ± standard error of the mean. *p < 0.05, **p < 0.01, ***p < 0.001.
Figure 2
Figure 2
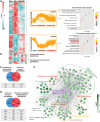
A) A global heatmap of DEGs shows the number of genes, orientated by their Z‐scores (p < 0.05). Two clusters based on DEG patterning are identified, and dot plots constructed from GO enrichment analysis are presented. Dot plots are displayed with ‐log 10 (p.adjust) values and the number of genes involved. Sham (n = 2), ADN (n = 3), and ADN+GQDs (n = 4). B) A heatmap represents podocyte differentiation and Monoatomic ion channel. C, D) Common genes between monoatomic ion channel activity and Ca2+ ion transport (C) and between Ca2+ ion transport and regulation of apoptotic signaling pathway (D), respectively. E) A protein interaction network analysis highlighting strong interactions and intricate connections among genes, clustered by biological process description from GO analysis. Experiments were repeated at least 3 times, and the data are shown as the mean ± standard error of the mean. *p < 0.05, **p < 0.01, ***p < 0.001.
Figure 3
Figure 3
A) Representative images and quantification of NGAL, TRPC5, and 8‐OHdG. Sham (n = 8), ADN (n = 8), and ADN+GQDs (n = 8). B, C) Immunofluorescence imaging for human podocytes after exposure to AD (10 ng mL−1) and GQDs (0.25 or 0.5 µg mL−1). Scale bar, 100 µm. (CTL = Control) D) Relative fluorescence of albumin‐rhodamine diffusion (left) and mRNA profiles (right) of human podocytes are shown. Scale bar, 100 µm. AD (10 ng mL−1) and GQDs (0.25 or 0.5 µg mL−1). Control (CTL) (n = 4), ADN (n = 4), ADN+GQDs 0.25 (n = 4), ADN+GQDs 0.5 (n = 4). Experiments were repeated at least 3 times, and the data are shown as the mean ± standard error of the mean. *p < 0.05, **p < 0.01, ***p < 0.001.
Figure 4
Figure 4
GQDs attenuated kidney fibrosis and contributed to kidney function recovery in the 5/6Nx model (pre‐treatment group). A) A schematic of the 5/6Nx+GQDs rat model B) Body weights, kidney function indicators, blood pressure, and Cr clearance in the GQDs pre‐treated group after 5/6Nx. Sham (n = 6), Sham+GQDs (n = 3), 5/6Nx (n = 9), and 5/6Nx+GQDs (n = 9). Cr clearance; Sham (n = 10), Sham+GQDs (n = 10), 5/6Nx (n = 13), and 5/6Nx+GQDs (n = 13). C) Representative images from immunohistochemical staining (right) and corresponding measurements (left) in the GQDs pre‐treated group. Sham (n = 7), Sham+GQDs (n = 7), 5/6Nx (n = 13), and 5/6Nx+GQDs (n = 13). Scale bar, 100 µm. D) Immunoblot analysis of samples from 5/6Nx rats that received GQDs. Band intensities are determined by densitometric quantification and normalized to β‐actin (n = 6 per group). E) Scanned images of kidney sections show NGAL, TRPC5, and 8‐OHdG, along with their corresponding measurements. Sham (n = 7), Sham+GQDs (n = 7), 5/6Nx (n = 13), and 5/6Nx+GQDs (n = 13). Scale bar, 100 µm. Experiments are repeated at least 3 times, and the data are shown as the mean ± standard error of the mean. *p < 0.05, **p < 0.01, ***p < 0.001.
Figure 5
Figure 5
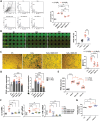
GQDs inhibited podocyte apoptosis in vitro. A) Cell cycle analysis in podocytes after incubation with H2O2 (0.5 mM) and GQDs (0.125, 0.25, or 0.5 µg mL−1). Representative flow cytometry plots and quantitative data are shown (n = 3 per group). B) Representative live and dead cell images (left) and quantitative data (right) show podocyte death under recombinant transforming growth factor (rTGF‐β) (2 ng mL−1) and H2O2 (1 mM)‐induced kidney injury with GQDs (0.5 µg mL−1) treatment (n = 5 per group). C) The β‐galactosidase assay shows the anti‐senescence effect on human podocytes after incubation with H2O2 (1 mM) and GQDs (0.25 or 0.5 µg mL−1) (n = 5 per group). Scale bar, 250 µm. D) Western blot analysis shows the level of β‐Gal and CCN1 in different groups (n = 6 per group). H2O2 (1 mM) and GQDs (0.125, 0.25, or 0.5 µg mL−1). E) Quantitative colorimetric ROS assay shows decreased ROS production of podocytes after incubation with H2O2 (1 mM) and GQDs (0.25 or 0.5 µg mL−1) (n = 4 per group). F) The mRNA expression of proinflammatory cytokine and kinase activity (n = 6 per group). H2O2 (1 mM) and GQDs (0.125, 0.25, or 0.5 µg mL−1) (G) Wound healing assay shows maximum improvement of injury in H2O2‐induced oxidative stress condition. Cells are pre‐treated with GQDs (0.25 or 0.5 µg mL−1) for 2 h before removing cells (n = 5 per group). Figures show the individual data from the different groups, with each experiment repeated at least 3 times. Data are shown as the mean ± standard error of the mean. *p < 0.05, **p < 0.01, ***p < 0.001.
Figure 6
Figure 6
GQDs targeted mitochondria in renal injuries. A and B) Representative immunohistochemistry images and quantitative data of cytochrome C, PGC‐1α, and Sod‐1. (A), ADN model (n = 8 per group); (B), 5/6Nx model, Sham (n = 7), Sham+GQDs (n = 7), 5/6Nx (n = 13), and 5/6Nx+GQDs (n = 13). Scale bar, 100 µm. C) The plots illustrate IHC markers with kidney function measurements from the indicated study showing different hierarchical ranks based on –log(FDR) and log(fold‐change) values. FDR is calculated using the formula: FDR = p‐value (one‐sample t‐test) × (number of categories/rank). Three independent experiments with similar results were performed. Data are shown as the mean ± standard error of the mean. *p < 0.05, **p < 0.01, ***p < 0.001.
Figure 7
Figure 7
A) Representative images of podocytes labeled with MitoTracker Deep Red (mito T) and DAPI after 24 h of incubation with H2O2 (1 mM) and GQDs. Scale bar, 100 µm (n = 6 per group). B and C) Representative images of human podocytes loaded with MitoTracker (green) and MitoSOX (red) (B) or TMRM (red) C). (n = 6 per group). Scale bars, 50 µm and 500 µm. D) Intracellular Ca2+ responses measured by Fura‐2 AM radiometric fluorescence to ionomycin (5 mM) and GQDs (0.5 µg mL−1) (n = 3 per group). E) Cellular respiration and glycolysis in podocytes after exposure to H2O2 (1 mM) and GQDs (0.25 or 0.5 µg mL−1). OCR, oxygen consumption rate; ECAR, extracellular acidification rate; PER, proton efflux rate (n = 8 per group). F) Measurements of basal, proton leak, maximal respiration, spare respiratory capacity, and ATP production in each group (n = 8 per group). G) Mitochondrial membrane potential by JC‐1 dye staining and density plot. Dead (n = 9), Live (n = 9). H) The mRNA expression of TRPC5 and IL‐8 cytokine concentration (pg/mL) measured in response to H2O2‐induced mitochondrial dysfunction (n = 5 per group). Three independent experiments with similar results were performed. Data are shown as the mean ± standard error of the mean. *p < 0.05, **p < 0.01, ***p < 0.001.
Figure 8
Figure 8
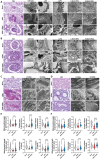
A and B) Representative PAS and TEM images of kidney sections, showing podocyte foot process (FT), mitochondria in the glomerulus (Glom. Mito), and C and D) mitochondria in tubule (T. Mito). E and F) Representative violin plots illustrate the changes in mitochondrial lengths, cristae area, and volume density following GQDs injection, with imaging conducted at 50000× for the glomerulus (n = 14) and 12000× for the tubule (n = 40) in both ADN and 5/6Nx models. Scale bar, 2 µm (12000×; cell body), 1 µm (30000×; FT), 200 nm (80000×; FT or 100000×; Glom.Mito), and 500 nm (50000×; Glom. Mito). Three independent experiments with similar results were performed. Data is shown as the mean ± standard error of the mean. *p < 0.05, **p < 0.01, ***p < 0.001.
Figure 9
Figure 9
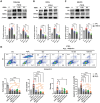
GQDs ameliorated kidney injury and fibrosis by suppressing fibroblast activation. A–C) Western blot analysis shows the effects of GQDs on human podocytes (A), hTECs (B), and NIH3T3 (C) after 48 h of incubation with recombinant transforming growth factor (rTGF‐β) (2 ng mL−1) and GQDs (0.25 and 0.5 µg mL−1) (n = 6 per group). D) hTECs are treated with H2O2 (0.5 mM) and GQDs (0.5 µg mL−1) for indicated periods (−1 h, 0, +5 min, +20 min). Annexin V/PI staining revealed the proportion of early apoptosis, late apoptosis, necrosis, and apoptotic cells. Flow cytometry density plot (top) and quantification (bottom) are shown (n = 5 per group). E) Summary diagram of the mechanism of the effects after GQDs treatment. Data are shown as the mean ± standard error of the mean. The experiments were repeated at least 3 times. *p < 0.05, **p < 0.01, ***p < 0.001.
Figure 9
Figure 9
GQDs ameliorated kidney injury and fibrosis by suppressing fibroblast activation. A–C) Western blot analysis shows the effects of GQDs on human podocytes (A), hTECs (B), and NIH3T3 (C) after 48 h of incubation with recombinant transforming growth factor (rTGF‐β) (2 ng mL−1) and GQDs (0.25 and 0.5 µg mL−1) (n = 6 per group). D) hTECs are treated with H2O2 (0.5 mM) and GQDs (0.5 µg mL−1) for indicated periods (−1 h, 0, +5 min, +20 min). Annexin V/PI staining revealed the proportion of early apoptosis, late apoptosis, necrosis, and apoptotic cells. Flow cytometry density plot (top) and quantification (bottom) are shown (n = 5 per group). E) Summary diagram of the mechanism of the effects after GQDs treatment. Data are shown as the mean ± standard error of the mean. The experiments were repeated at least 3 times. *p < 0.05, **p < 0.01, ***p < 0.001.

References

    1. Williams R. M., Jaimes E. A., Heller D. A., Kidney Int. 2016, 90, 740. - PMC - PubMed
    1. a) Zhao C., Song X., Liu Y., Fu Y., Ye L., Wang N., Wang F., Li L., Mohammadniaei M., Zhang M., Zhang Q., Liu J., J. Nanobiotechnol. 2020, 18, 142; - PMC - PubMed
    2. b) Volarevic V., Paunovic V., Markovic Z., Simovic Markovic B., Misirkic‐Marjanovic M., Todorovic‐Markovic B., Bojic S., Vucicevic L., Jovanovic S., Arsenijevic N., Holclajtner‐Antunovic I., Milosavljevic M., Dramicanin M., Kravic‐Stevovic T., Ciric D., Lukic M. L., Trajkovic V., ACS Nano 2014, 8, 12098; - PubMed
    3. c) Gao W., Liang Y., Wu D., Deng S., Qiu R., BMC Oral Health 2023, 23, 331. - PMC - PubMed
    1. Kim D., Yoo J. M., Hwang H., Lee J., Lee S. H., Yun S. P., Park M. J., Lee M., Choi S., Kwon S. H., Lee S., Kwon S. H., Kim S., Park Y. J., Kinoshita M., Lee Y. H., Shin S., Paik S. R., Lee S. J., Lee S., Hong B. H., Ko H. S., Nat. Nanotechnol. 2018, 13, 812. - PMC - PubMed
    1. Tian Z., Yao X., Ma K., Niu X., Grothe J., Xu Q., Liu L., Kaskel S., Zhu Y., ACS Omega 2017, 2, 1249. - PMC - PubMed
    1. Foresto‐Neto O., da Silva A., Cipelli M., Santana‐Novelli F. P. R., Camara N. O. S., Kidney Res. Clin. Pract. 2023, 42, 561. - PMC - PubMed

MeSH terms

LinkOut - more resources