. 2025 Mar;292(5):1086-1105.
doi: 10.1111/febs.17379. Epub 2024 Dec 30.

Hypoxia-induced increase in sphingomyelin synthase 2 aggravates ischemic skeletal muscle inflammation

Affiliations

Hypoxia-induced increase in sphingomyelin synthase 2 aggravates ischemic skeletal muscle inflammation

Hinano Mizugaki et al. FEBS J. 2025 Mar.

Abstract

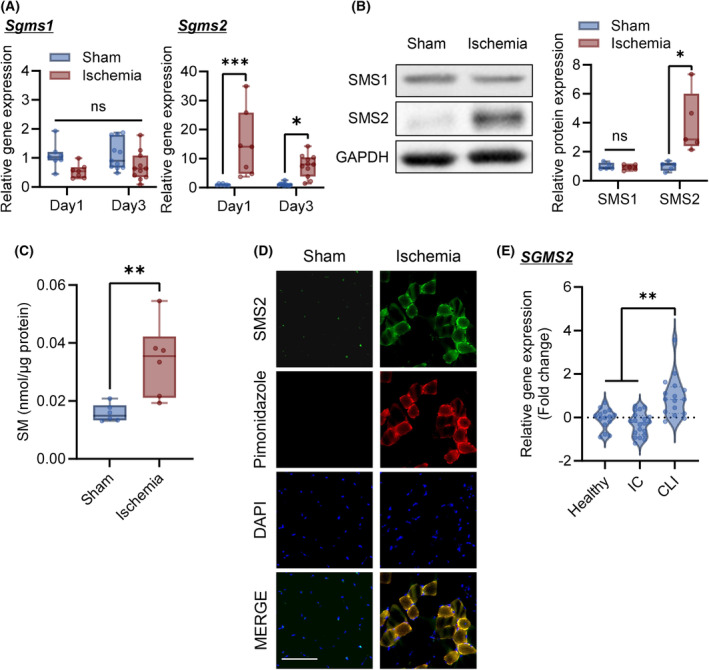
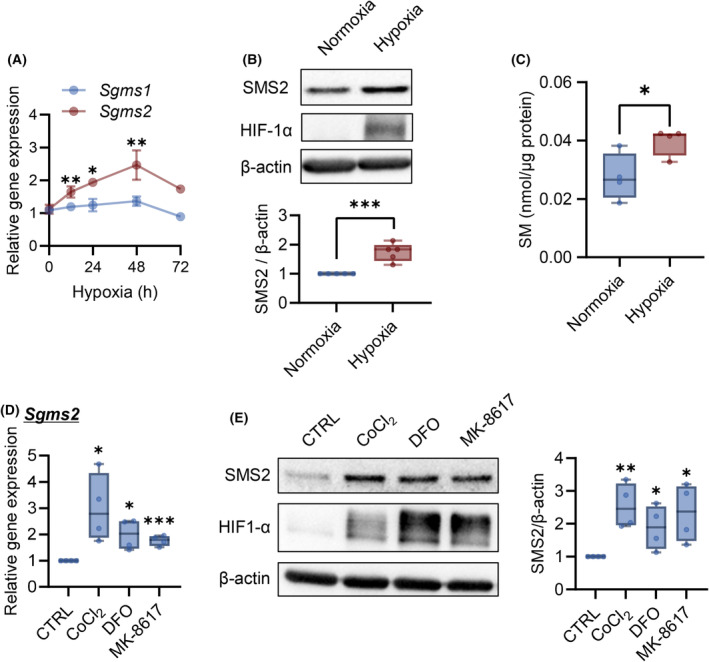
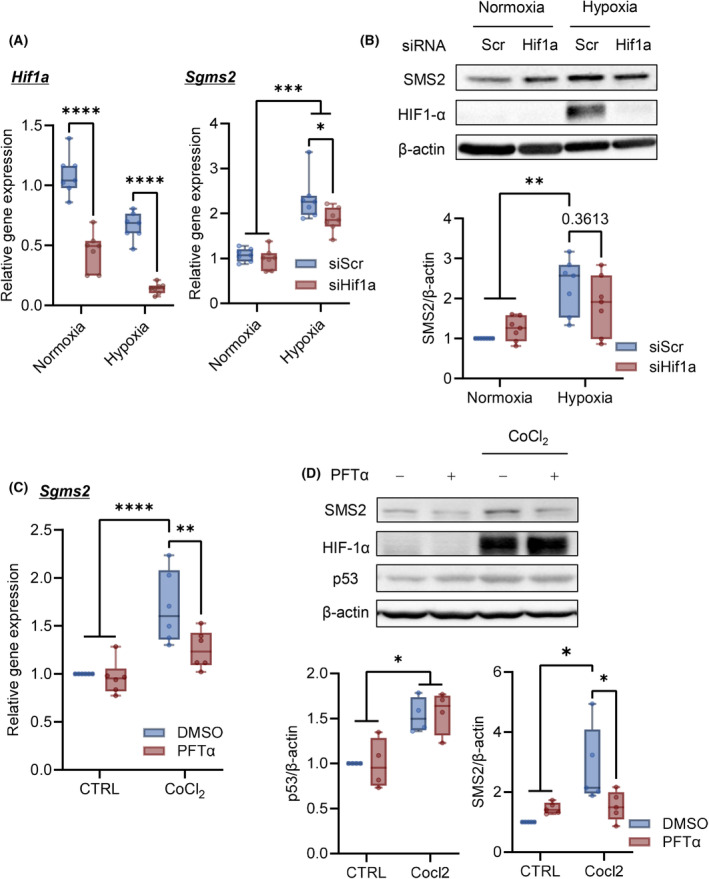
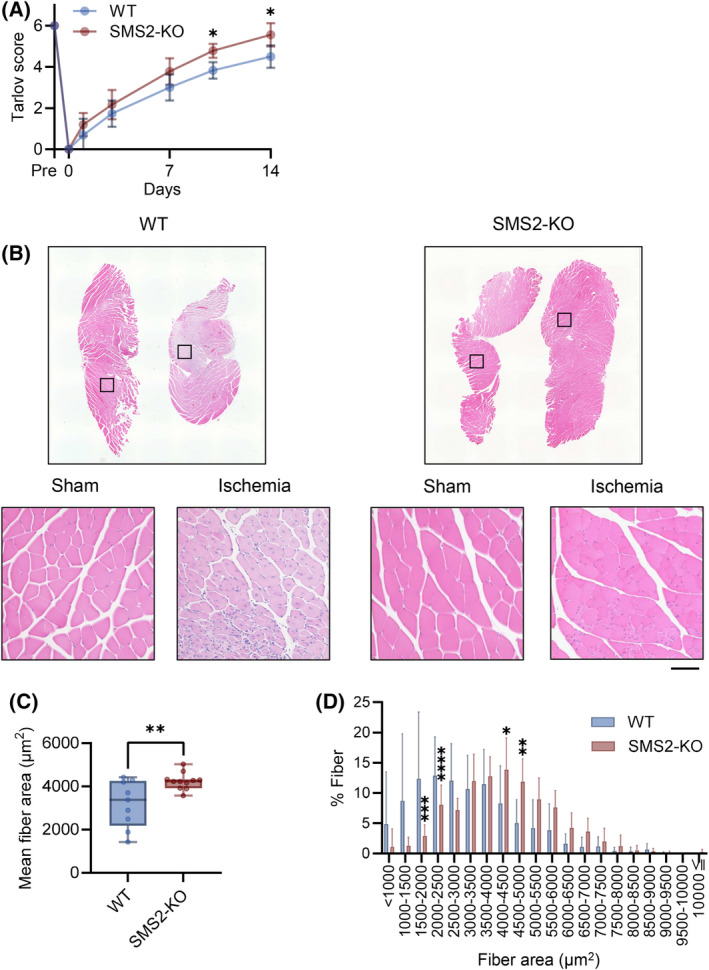
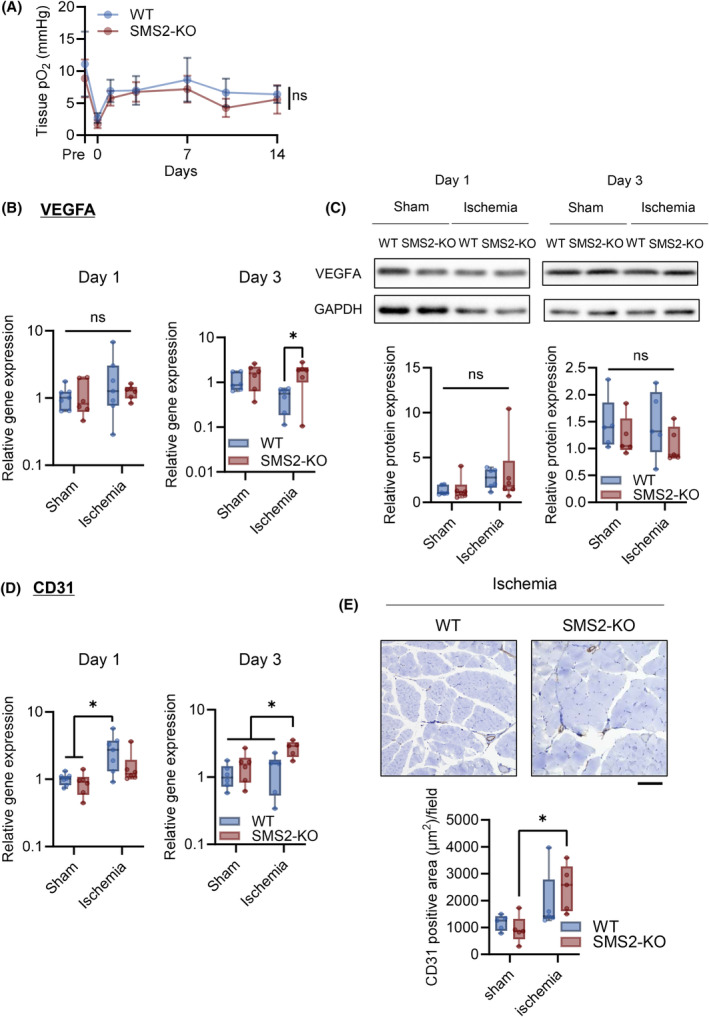
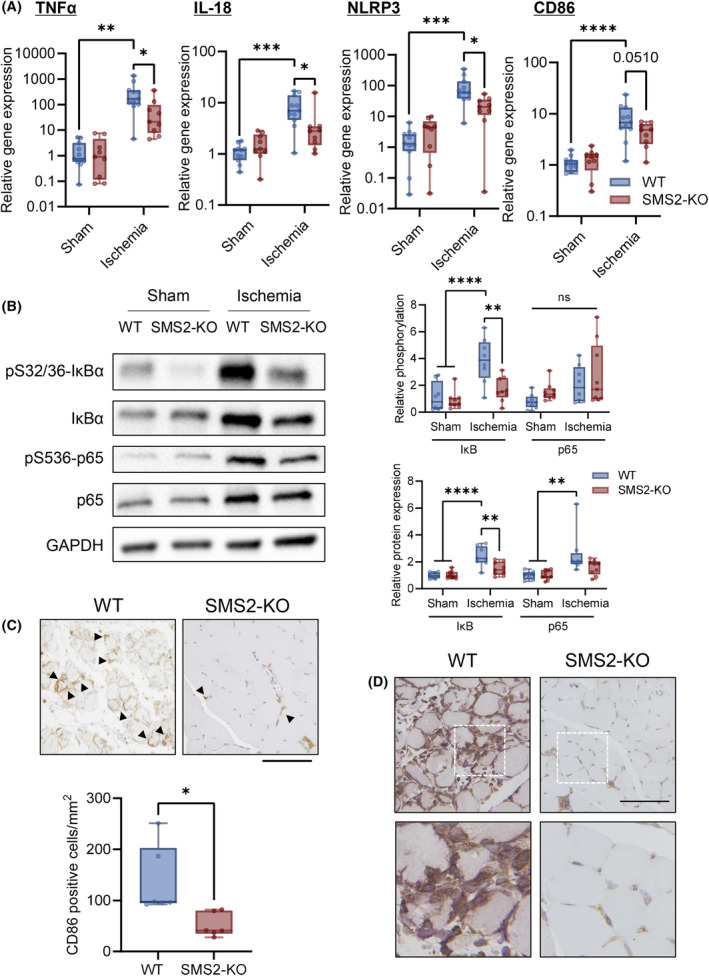
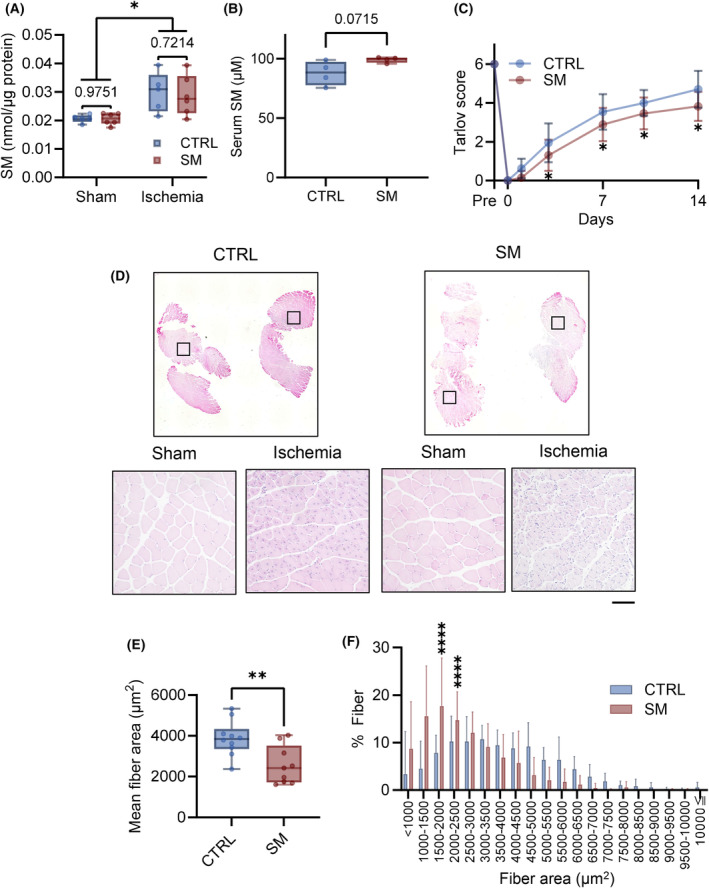
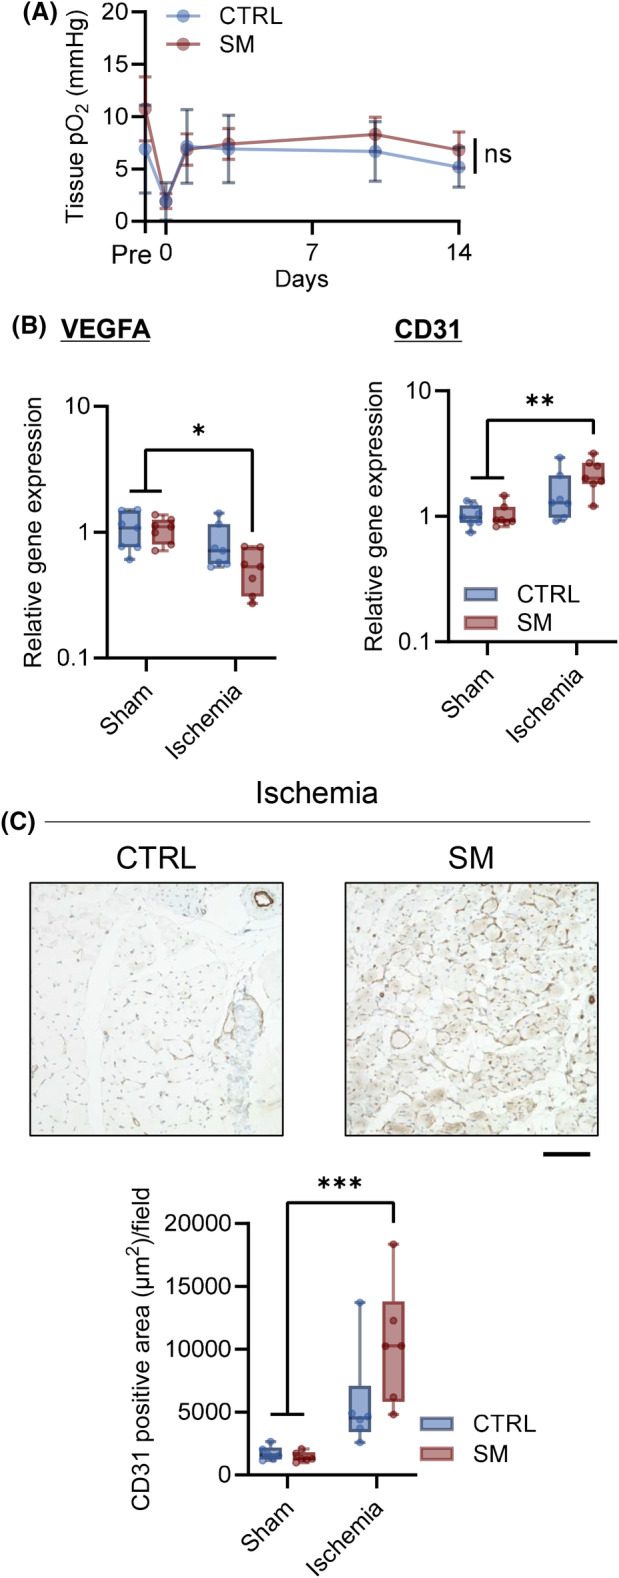
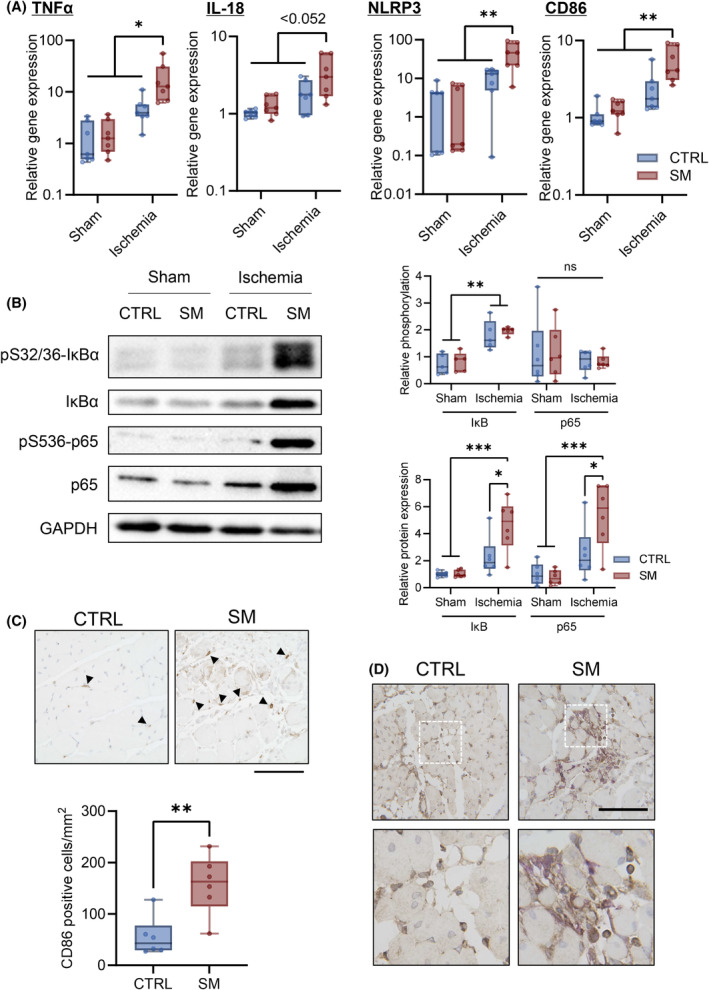
Critical limb ischemia (CLI) is the most advanced stage of peripheral arterial disease, posing a high risk of mortality. Sphingomyelin, a sphingolipid synthesized by sphingomyelin synthases (SMSs) 1 and 2, plays an essential role in signal transduction as a component of lipid rafts. However, the role of sphingomyelin in the inflammation of ischemic skeletal muscles remains unclear. In this study, we analyzed the roles of sphingomyelin and SMSs in CLI-induced myopathy using a mouse hindlimb ischemia model. We observed that hypoxia after CLI triggered an increase in SMS2 levels, thereby elevating sphingomyelin concentrations in ischemic skeletal muscles. The expression of SMS2 and sphingomyelin was induced by hypoxia in C2C12 myotubes and regulated by the prolyl hydroxylase domain enzyme. Additionally, SMS2 deficiency suppressed skeletal muscle inflammation after CLI, attenuated the phosphorylation of inhibitor of κBα (IκBα), and reduced the nuclear translocation of nuclear factor κB (NFκB) p65. Meanwhile, the administration of sphingomyelin hampered skeletal muscle inflammation by inhibiting IκBα phosphorylation and NFκB p65 nuclear translocation and extending inflammation post-CLI. Our results suggest that hypoxia-induced enhancement in SMS2 levels and the consequent increase in sphingomyelin expression levels promote inflammation in ischemic muscle tissues via the NFκB pathway and propose sphingomyelin as a potential therapeutic target in patients with CLI and other hypoxia-related inflammatory diseases.

Keywords: NFκB; critical limb ischemia; hypoxia; sphingomyelin; sphingomyelin synthase 2.


Conflict of interest statement

The authors declare no conflict of interest.

Figures

Fig. 1
Fig. 1
Sphingomyelin and SMS2 expression levels are increased in gastrocnemius after critical limb ischemia. The femoral artery/vein of the C57BL/6N mice was ligated to create a CLI (critical limb ischemia) model. Gastrocnemius tissue samples were collected 1 and 3 days after CLI. (A) Expression of Sgms1 and Sgms2 was analyzed using RT‐qPCR (Day 1, n = 7; Day 3, n = 11; internal control: Rn18s). (B) Representative western blot images of sphingomyelin synthase (SMS) 1 and SMS2 in the gastrocnemius 3 days after CLI. Relative band intensities were normalized to that of GAPDH (n = 5). (C) The sphingomyelin (SM) concentration in the gastrocnemius muscle was analyzed 3 days after CLI (n = 6). (D) Representative images of gastrocnemius immunohistology 1 day after CLI. SMS2 expression (green); hypoxic area detected by pimonidazole (red); nucleus stained with DAPI (blue); scale bar = 100 μm. (E) Expression of SGMS2 in the gastrocnemius of non‐peripheral arterial disease (PAD) controls (Healthy), patients with intermittent claudication (IC), and CLI (Healthy, n = 15; IC, n = 20; CLI, n = 16). The relative gene expression is shown in log2 fold change. Data are shown as box‐whisker plots or violin plots. In the box‐whisker plot, horizontal bar represents the median, and whiskers represent the maximum and minimum values. Comparison between two groups was analyzed using the t‐test. For comparison between three or more groups, the Tukey's multiple comparison test was used (*P < 0.05, **P < 0.01, and ***P < 0.001).
Fig. 2
Fig. 2
Hypoxia and prolyl hydroxylase domain enzyme inhibitors induce SMS2 expression. C2C12 myotubes were cultured under hypoxic conditions for the indicated times. (A) Expression of Sgms1/2 was analyzed using RT‐qPCR (n = 4; internal control: Tbp). (B) Representative western blot image and quantitative analysis of band intensities after 48 h of hypoxia. The relative band intensities were normalized to that of actin (n = 5). (C) The SM concentration in C2C12 myotube cells was analyzed 48 h after hypoxia. C2C12 myotube cells were treated with prolyl hydroxylase domain enzyme (PHD) inhibitors CoCl2 (200 μm), deferoxamine (DFO; 200 μm), and MK‐8617 (10 μm). (D) Gene expression of Sgms2 was analyzed using RT‐qPCR after 24 h of treatment with PHD inhibitors (n = 4). (E) Representative images of western blot and quantitative analysis of band intensities obtained after 48 h of treatment with PHD inhibitors (n = 4). Data are shown as mean ± SD in line graphs. In the box‐whisker plot, horizontal bar represents the median, and whiskers represent the maximum and minimum values. Comparison between two groups was analyzed using the t‐test. For comparison between three or more groups, the Tukey's multiple comparison test was used (*P < 0.05, **P < 0.01, and ***P < 0.001).
Fig. 3
Fig. 3
HIF‐1α and p53 are involved in SMS2 expression in hypoxia. C2C12 myotube cells were transfected with siRNA of HIF1‐α. Three days after transfection, C2C12 myotubes were cultured under hypoxia. (A) Expression of Hif1a and Sgms2 after 24 h of hypoxia (n = 7). (B) Representative western blot images of SMS2 expression and HIF1‐α accumulation after 48 h of hypoxia (n = 7). C2C12 myotube cells were treated with Pifithrin‐α (PTFα) (5 μm) with CoCl2 for 48 h. (C) Gene expression of Sgms2 was analyzed using RT‐qPCR (n = 6). (D) Representative western blot images and quantitative analyses (n = 5). In the box‐whisker plot, horizontal bar represents the median, and whiskers represent the maximum and minimum values. Comparison between groups, the Tukey's multiple comparison test was used (*P < 0.05, **P < 0.01, ***P < 0.001, and ****P < 0.0001).
Fig. 4
Fig. 4
SMS2 deficiency promotes recovery from critical limb ischemia. Critical limb ischemia (CLI) was induced in wild‐type (WT) and SMS2‐knock‐out (KO) mice. (A) The walking ability after CLI was evaluated using the Tarlov score (WT, n = 16; KO, n = 15). (B) Fourteen days after CLI, the gastrocnemius muscle was collected and stained with hematoxylin and eosin (H&E; scale bar = 100 μm). (C) Mean fiber area and (D) distribution of fiber area (WT, n = 9; KO, n = 11). In the bar graph, the data is shown as mean ± SD. Horizontal bar represents the median, and whiskers represent the maximum and minimum values in the box‐whisker plot. Comparison between two groups was analyzed using the t‐test. For comparison between three or more groups, the Tukey's multiple comparison test was used (*P < 0.05, **P < 0.01, ***P < 0.001, and ****P < 0.0001).
Fig. 5
Fig. 5
SMS2 plays a minimal role in the oxygenation of the tissue and angiogenesis of ischemic limbs. Angiogenesis after critical limb ischemia (CLI) in skeletal muscle of wild type (WT) and SMS2‐KO (KO) was evaluated. (A) Footpad tissue pO2 obtained by electron paramagnetic resonance (EPR) oximetry (WT, n = 21; KO, n = 16). (B) Gene expression of Vegfa in the gastrocnemius after 1 and 3 days CLI was analyzed using RT‐qPCR (Day 1, n = 7; Day 3, n = 6; internal control: Rn18s). (C) Representative image and of western blotting for VEGFA indicated days after CLI. Protein expression was normalized by GAPDH (Day 1, n = 6; Day 3, n = 5). (D) Gene expression of Pecam1 (Day 1, n = 7; Day 3, n = 6; internal control: Rn18s). (E) Representative image and quantification of CD31‐positive (brown, CD31; blue, nuclei, scale bar = 100 μm, n = 6). In the line graph, the data is shown as mean ± SD. Horizontal bar represents the median, and whiskers represent the maximum and minimum values in the box‐whisker plot. Comparison between groups, the Tukey's multiple comparison test was used (*P < 0.05).
Fig. 6
Fig. 6
SMS2 deficiency suppresses the production of inflammatory cytokines in ischemic limbs. Gastrocnemius samples were collected 3 days after CLI from wild‐type (WT) and SMS2‐knock out (KO) mice, and gene and protein expression levels were examined. (A) Gene expression levels of TNFα, IL‐18, NLRP3, and CD86 were analyzed using RT‐qPCR (WT, n = 11; KO, n = 9; internal control: Rn18s). (B) Representative images of western blotting and quantitative analyses. The relative band intensities of the phosphorylated proteins were normalized to that of the total protein, and protein expression levels were normalized to that of GAPDH (Sham, n = 8; Ischemia, n = 9). Infiltration of CD86‐ and p65‐positive cells in skeletal muscle was examined using immunohistochemical analysis. (C) Representative image and quantification of CD 86‐positive cells (Arrows indicate CD86; scale bar = 100 μm; n = 6). (D) Representative immunohistochemistry image of p65 and Iba1 in skeletal muscle (brown, p65; purple, Iba1; scale bar = 100 μm). In the box‐whisker plot, horizontal bar represents the median, and whiskers represent the maximum and minimum values. Comparison between two groups was analyzed using the t‐test. For comparison between three or more groups, the Tukey's multiple comparison test was used (*P < 0.05, **P < 0.01, ***P < 0.001, and ****P < 0.0001).
Fig. 7
Fig. 7
Sphingomyelin (SM) represses skeletal muscle regeneration. SM was administered intravenously (0.5 mg·kg−1) immediately after CLI (critical limb ischemia) surgery and 7 days after CLI surgery. (A) SM concentration of skeletal muscle 8 days after CLI (control mice [CTRL], n = 5; SM‐treated mice [SM], n = 6). (B) SM concentration of serum 8 days after CLI (n = 5). (C) Walking ability after CLI was evaluated by Tarlov scoring (CTRL, n = 18; SM, n = 20). (D) Fourteen days after CLI, the gastrocnemius muscle was collected and stained with H&E (scale bar = 100 μm). (E) Mean fiber area and (F) distribution (CTRL, n = 10; SM, n = 9). In the line and bar graphs, the data is shown as mean ± SD. Horizontal bar represents the median, and whiskers represent the maximum and minimum values in the box‐whisker plot. Comparison between two groups was analyzed using the t‐test. For comparison between three or more groups, the Tukey's multiple comparison test was used (*P < 0.05, **P < 0.01, and ****P < 0.0001).
Fig. 8
Fig. 8
Sphingomyelin plays a minimal role in the oxygenation of the tissue and angiogenesis of ischemic limbs. Sphingomyelin (SM) was intravenously administered (0.5 mg·kg−1) immediately after CLI (critical limb ischemia) surgery and 7 days after CLI, and also angiogenesis after CLI in skeletal muscle with and without SM injection was evaluated. (A) Footpad tissue pO2 was measured using electron paramagnetic resonance (EPR) oximetry (CTRL mice [CTRL], n = 15; SM‐treated mice [SM], n = 19). (B) Gene expression of Vegfa and Pcam1 was analyzed using qPCR 14 days after CLI (n = 7, internal control: Rn18s). (C) Representative image of immunohistochemistry and CD31 positive area was quantified (brown, CD31; blue, nuclei, scale bar = 100 μm, n = 6). In the line graph, the data is shown as mean ± SD. Horizontal bar represents the median, and whiskers represent the maximum and minimum values in the box‐whisker plot. Comparison between groups, the Tukey's multiple comparison test was used (*P < 0.05, **P < 0.01, and ***P < 0.001).
Fig. 9
Fig. 9
Sphingomyelin prolongs inflammation in skeletal muscles. Gastrocnemius samples were collected 14 days after CLI with or without sphingomyelin (SM) treatment. (A) Gene expression levels of TNFα, IL‐18, NLRP3, and CD86 were analyzed using RT‐qPCR (n = 7; internal control: Rn18s). (B) Representative images of western blotting and quantitative analyses. The relative band intensities of the phosphorylated proteins were normalized to that of the total protein, and the protein expression levels were normalized to that of GAPDH (n = 6). (C) Infiltration of CD86‐positive cells in skeletal muscle was examined using immunohistochemical analysis. Representative image and quantification of CD 86‐positive cells (Arrows = CD86; scale bar = 100 μm; n = 6). (D) Representative immunohistochemistry image of p65 and Iba1 in skeletal muscle (brown, p65; purple, Iba1; scale bar = 100 μm). In the box‐whisker plot, horizontal bar represents the median, and whiskers represent the maximum and minimum values. Comparison between two groups was analyzed using the t‐test. For comparison between three or more groups, the Tukey's multiple comparison test was used (*P < 0.05, **P < 0.01, and ***P < 0.001).

Similar articles

References

    1. McDermott MM, Ferrucci L, Gonzalez‐Freire M, Kosmac K, Leeuwenburgh C, Peterson CA, Saini S & Sufit R (2020) Skeletal muscle pathology in peripheral artery disease: a brief review. Arterioscler Thromb Vasc Biol 40, 2577–2585. - PMC - PubMed
    1. Uccioli L, Meloni M, Izzo V, Giurato L, Merolla S & Gandini R (2018) Critical limb ischemia: current challenges and future prospects. Vasc Health Risk Manag 14, 63–74. - PMC - PubMed
    1. Ryan TE, Yamaguchi DJ, Schmidt CA, Zeczycki TN, Shaikh SR, Brophy P, Green TD, Tarpey MD, Karnekar R, Goldberg EJ et al. (2018) Extensive skeletal muscle cell mitochondriopathy distinguishes critical limb ischemia patients from claudicants. JCI Insight 3, e123235. - PMC - PubMed
    1. Mohiuddin M, Lee NH, Moon JY, Han WM, Anderson SE, Choi JJ, Shin E, Nakhai SA, Tran T, Aliya B et al. (2019) Critical limb ischemia induces remodeling of skeletal muscle motor unit, myonuclear‐, and mitochondrial‐domains. Sci Rep 9, 9551. - PMC - PubMed
    1. Olea FD, Locatelli P, Hnatiuk A, De Lorenzi A, Valdivieso L, Rocha E, Ramírez R, Laguens R & Crottogini A (2015) Vascular endothelial growth factor overexpression does not enhance adipose stromal cell‐induced protection on muscle damage in critical limb ischemia. Arterioscler Thromb Vasc Biol 35, 184–188. - PubMed

MeSH terms

Substances

LinkOut - more resources