. 2024 Dec 31;19(12):e0307577.
doi: 10.1371/journal.pone.0307577. eCollection 2024.

Immune cell infiltration and modulation of the blood-brain barrier in a guinea pig model of tuberculosis: Observations without evidence of bacterial dissemination to the brain

Affiliations

Immune cell infiltration and modulation of the blood-brain barrier in a guinea pig model of tuberculosis: Observations without evidence of bacterial dissemination to the brain

Amanda S Latham et al. PLoS One. .

Abstract

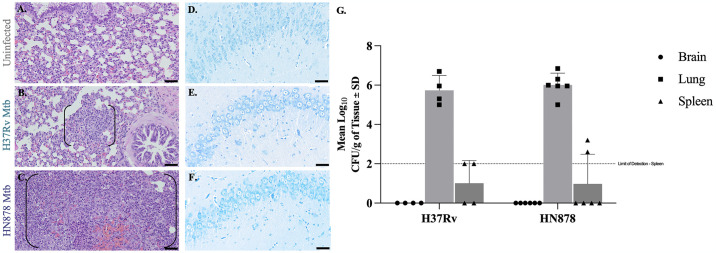
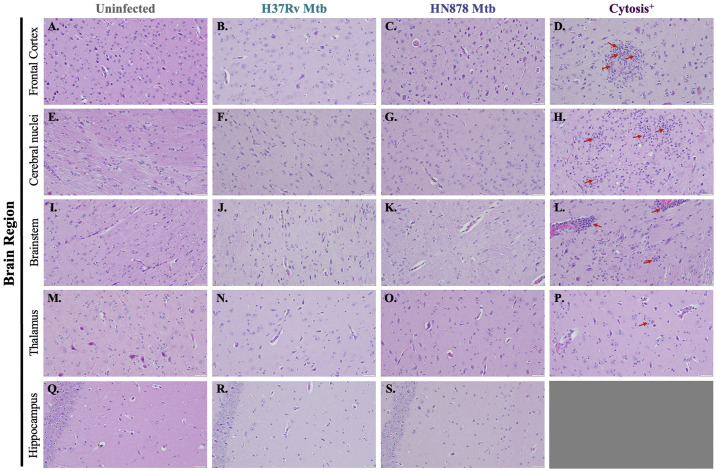
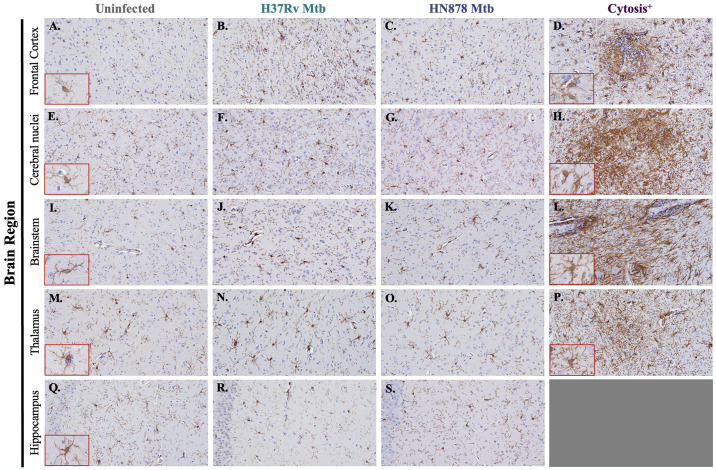
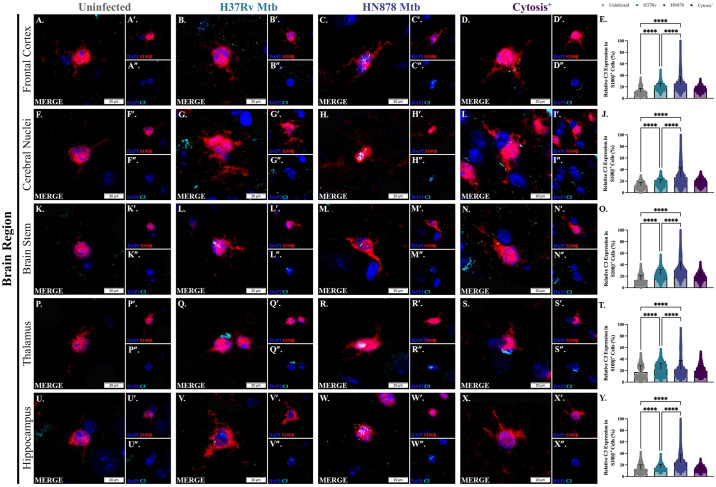
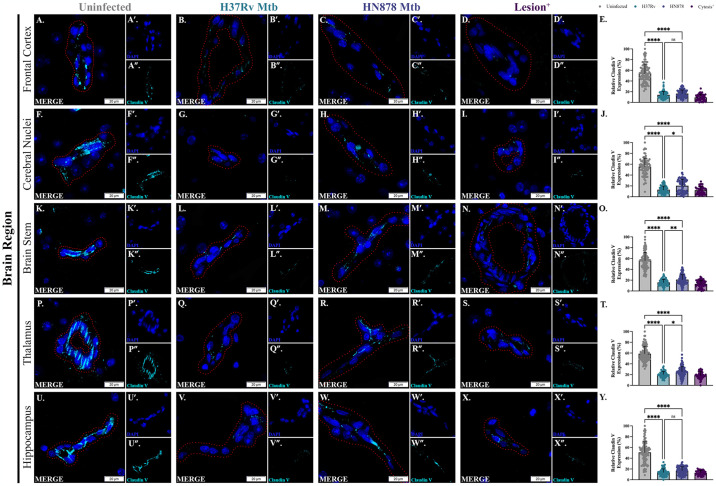
Tuberculosis (TB), caused by Mycobacterium tuberculosis (Mtb) infection, is a chronic inflammatory disease. Although typically associated with inflammation of the lungs and other peripheral tissues, increasing evidence has uncovered neurological consequences attributable to Mtb infection. These include deficits in memory and cognition, increased risk for neurodegenerative disease, and progressive neuropathology. Although the neurological effects of the disease, without CNS infection, have been characterized, the mechanism of neurotoxicity is unknown. We hypothesized that alterations to the blood-brain barrier (BBB) allows peripheral immune cells to enter the brain, initiating a neuroinflammatory response. To test this hypothesis, guinea pigs were exposed by aerosol to a laboratory and a clinical Mtb strain for 15 days. Following Mtb infection, proteins critical to BBB function, including claudin V and collagen IV, are modulated without evidence of bacterial dissemination to the brain. This is correlated with increased contact of astrocytic processes to vessels in the brain, as well as increased expression of the water channel protein aquaporin 4 (AQP4) on endfeet. Upon further investigation, we discovered the potential role of glial reactivity, which is increased following infection with both bacterial strains, in the progression of BBB changes and, ultimately, the permeability of peripheral immune cells into the brain. Through these data, we have obtained a preliminary understanding of the mechanisms of cellular stress in the brain following pulmonary Mtb infection which should be further investigated in future studies.


Conflict of interest statement

The authors have declared that no competing interests exist.

Figures

Fig 1
Fig 1. Bacterial dissemination to the brain is not detected despite infection of peripheral tissues.
Lesions and bacteria are absent in the brains of guinea pigs infected with Mtb H37Rv and HN878 15 days post-infection. Lung histology shows granulomas (black brackets) in animals infected with Mtb H37Rv (B) and Mtb HN878 (C) but no granuloma formation is seen in uninfected animals (A). Acid-fast staining of brain tissue does not show the presence of bacteria in any brain region; representative images of the hippocampus are given for an uninfected control (D) and an animal infected with Mtb H37Rv (E) and Mtb HN878 (F). Colony-forming unit (CFU) assays indicate bacterial colonies in lung and spleen homogenates, but no bacterial colonies were detected in brain for either Mtb strain. The limit of detection for spleen is 2 log CFU (G). Each bar represents the mean ± SD. (N = 4–6 animals/Mtb infection group). Scale Bar = 100 μm.
Fig 2
Fig 2. Increased cellular nuclei and changes in tissue morphology in cytosis+ animals.
Cytosis was identified in the brains of only two Mtb-infected animals by H&E staining. Representative images from the two animals 15 days post-infection in the frontal cortex (A–D), cerebral nuclei (E–H), brain stem (I–L), thalamus (M–P), and hippocampus (Q–S) are shown. No evidence of an abnormal cellular response is seen in any brain region in uninfected controls (A, E, I, M, and Q) nor in the other animals infected with H37Rv (B, F, J, N, and R) and HN878 (C, G, K, O, and S). An intense cellular response, with increased cellular nuclei, is identified in one HN878-infected animal in the frontal cortex (D) and cerebral nuclei (H), and in one Mtb H37Rv-infected animal in the brain stem (L) and thalamus (P). (N = 4–6 animals/Mtb infection group; 2 animals in the cytosis+ group). Scale Bar = 50 μm.
Fig 3
Fig 3. Increased microglial response following Mtb infection that is exacerbated in cytosis+ animals.
Microgliosis was determined using immunohistochemical staining of guinea pig brain tissue for the microglial cell marker Iba-1. Representative images of Iba-1+ microglia 15 days post-infection in the frontal cortex (A–D), cerebral nuclei (E–H), brain stem (I–L), thalamus (M–P), and hippocampus (Q–S) are shown. Inlets were provided to allow for higher magnification to view the glial staining and morphological changes. The number of Iba-1+ cells increase in all brain regions in animals infected with Mtb H37Rv (B, F, J, N, and R) and Mtb HN878 (C, G, K, O, and S) compared to uninfected controls (A, E, I, M, and Q). An intense microglial response is identified in one HN878-infected animal in the frontal cortex (D) and cerebral nuclei (H), and in one Mtb H37Rv-infected animal in the brain stem (L) and thalamus (P). (N = 4–6 animals/Mtb infection group; 2 animals in the cytosis+ group). Scale Bar = 50 μm.
Fig 4
Fig 4. Limited astrocyte proliferation demonstrated following Mtb infection.
Immunohistochemical staining of guinea pig brain tissue for the astrocyte marker S100β was performed to determine if proliferation of astrocytes occurred following infection with Mtb. Representative images of S100β+ astrocytes 15 days post-infection in the frontal cortex (A–D), cerebral nuclei (E–H), brain stem (I–L), thalamus (M–P), and hippocampus (Q–S) are shown. Inlets were provided to allow for higher magnification to view the glial staining. S100β+ cells do not appear to increase in any of the brain regions in animals infected with Mtb H37Rv (B, F, J, N, and R) and Mtb HN878 (C, G, K, O, and S) compared to uninfected controls (A, E, I, M, and Q). Although limited changes in cell number are apparent, cells upregulate S100β in one HN878-infected animal in the frontal cortex (D) and cerebral nuclei (H), and in one Mtb H37Rv-infected animal in the brain stem (L) and thalamus (P). (N = 4–6 animals/Mtb infection group; 2 animals in the cytosis+ group). Scale Bar = 50 μm.
Fig 5
Fig 5. Astrocytes increase production of complement 3 following Mtb-infection.
Astrocyte reactivity was analyzed following Mtb exposure for 15 days, as determined by co-localization of DAPI (blue), S100β (red), and C3 (cyan). C3 expression was analyzed in every S100β+DAPI+ cell present in each brain region for one tissue section per animal. Representative images of the frontal cortex (A–D), cerebral nuclei (F–I), brain stem (K–N), thalamus (P–S), and hippocampus (U–X) 15 days post-infection are shown. Exposure to Mtb H37Rv increased C3 expression, compared to uninfected controls, in the frontal cortex (E), cerebral nuclei (J), brain stem (O), thalamus (T), and hippocampus (Y). Expression is increased in Mtb HN878-infected animals in the frontal cortex (E), cerebral nuclei (J), brain stem (O), thalamus (T), and hippocampus (Y) compared to both H37Rv-infected and uninfected animals. Similarly, C3 is upregulated in astrocytes of cytosis+ animals in all brain regions but the hippocampus (E, J, O, T, and Y). Each bar represents the mean ± SD. (N = 4–6 animals/Mtb infection group; 2 animals in the cytosis+ group). Nonparametric one-way ANOVA analysis performed; ****p ≤ 0.0001. Scale Bar = 20 μm.
Fig 6
Fig 6. Astrocytes increase contact with vessels and expression of AQP4 following Mtb infection, which is decreased in cytosis+ animals.
Immunofluorescent staining of guinea pig brain tissue for the astrocytic marker GFAP (red), endfoot protein AQP4 (cyan), and DAPI (blue) in vessels was performed. Representative images of the frontal cortex (A–D), cerebral nuclei (G–J), brain stem (M–P), thalamus (S–V), and hippocampus (Y–BB) 15 days post-infection are shown. Exposure to Mtb H37Rv increased AQP4 expression and endfoot contact, compared to uninfected controls, in the frontal cortex (A, B, and E), cerebral nuclei (G, H, and K), brain stem (M, N, and Q), thalamus (S, T, and W), and hippocampus (Y, Z, and CC). AQP4 expression and contact is increased in Mtb HN878-infected animals in the frontal cortex (A, C, and E), cerebral nuclei (G, I, and K), brain stem (M, O, and Q), thalamus (S, U, and W), and hippocampus (Y, AA, and CC) compared to uninfected animals. Decreased expression of AQP4, and endfoot contact, is found in cytosis+ animals in the frontal cortex (D and E), cerebral nuclei (J and K), brain stem (P and Q), thalamus (V and W) and hippocampus (BB and CC). Increased GFAP+ area is demonstrated in animals infected with both Mtb H37Rv and HN878, but not cytosis+ animals, in the frontal cortex (F), cerebral nuclei (L), brain stem (R), thalamus (X), and hippocampus (DD). Each bar represents the mean ± SD. (N = 4–6 animals/Mtb infection group; 2 animals in the cytosis+ group). Nonparametric one-way ANOVA analysis performed; * = p ≤ 0.05, **** = p ≤ 0.0001. Scale Bar = 20 μm.
Fig 7
Fig 7. Collagen IV is modulated following infection with Mtb.
Immunofluorescent staining of guinea pig brain tissue for DAPI (blue) and collagen IV (cyan) in vessels was performed. Representative images of the frontal cortex (A–D), cerebral nuclei (F–I), brain stem (K–N), thalamus (P–S), and hippocampus (U–X) 15 days post-infection are shown. Exposure to Mtb H37Rv and HN878 decreased collagen IV expression compared to uninfected controls in the frontal cortex (E), cerebral nuclei (J), brain stem (O), thalamus (T), and hippocampus (Y). Decreased expression of collagen IV in cytosis+ animals is found in the frontal cortex (E) and hippocampus (Y), but not the cerebral nuclei (J), brain stem (O), and thalamus (T). Each bar represents the mean ± SD. (N = 4–6 animals/Mtb infection group; 2 animals in the cytosis+ group). Nonparametric one-way ANOVA analysis performed; *p ≤ 0.05, ***p ≤ 0.001, and ****p ≤ 0.0001. Scale Bar = 20 μm.
Fig 8
Fig 8. Claudin V is decreased following infection with Mtb.
Immunofluorescent staining of guinea pig brain tissue for DAPI (blue) and claudin V (cyan) in vessels was performed. Representative images of the frontal cortex (A–D), cerebral nuclei (F–I), brain stem (K–N), thalamus (P–S), and hippocampus (U–X) 15 days post-infection are shown. Exposure to Mtb H37Rv and HN878 decreased claudin V expression compared to uninfected controls in the frontal cortex (E), cerebral nuclei (J), brain stem (O), thalamus (T), and hippocampus (Y). Decreased expression of claudin V in cytosis+ animals is found in the frontal cortex (E), cerebral nuclei (J), brain stem (O), thalamus (T), and hippocampus (Y) as well. Each bar represents the mean ± SD. (N = 4–6 animals/ Mtb infection group; 2 animals in the cytosis+ group). Nonparametric one-way ANOVA analysis performed; *p ≤ 0.05, **p ≤ 0.01, and ****p ≤ 0.0001. Scale Bar = 20 μm.
Fig 9
Fig 9. Peripheral immune cells identified in cytosis+ animals.
Immunofluorescent staining of guinea pig brain tissue for CD45 (pink), S100β (yellow), Iba-1 (cyan), and DAPI (blue) for identification of peripheral immune cells. Representative images 15 days post-infection are shown. Exposure to Mtb H37Rv (B) and HN878 (C) did not show an abnormal population of cells, similar to uninfected animals (A). Alternatively, CD45highS100βlowIba-1low peripheral immune cells are identified in cytosis+ animals (D and E). (N = 4–6 animals/Mtb infection group; 2 animals in the cytosis+ group). Scale Bar = 20 μm.

Similar articles

References

    1. Organization WH. Global tuberculosis report 2021. 2021 978-92-4-003702-1.
    1. Harding E. WHO global progress report on tuberculosis elimination. The Lancet Respiratory Medicine. 2020;8(1):19. doi: 10.1016/S2213-2600(19)30418-7 - DOI - PubMed
    1. R F, Glaziou P, Harris JB, Date A, Floyd K, Kasaeva T. Epidemiology of Tuberculosis and Progress Toward Meeting Global Targets—Worldwide 2019. MMWR Morb Mortal Wkly Reports. 2021;(1545-861X (Electronic)). - PMC - PubMed
    1. Robertson KR, Oladeji B, Jiang H, Kumwenda J, Supparatpinyo K, Campbell TB, et al.. Human Immunodeficiency Virus Type 1 and Tuberculosis Coinfection in Multinational, Resource-limited Settings: Increased Neurological Dysfunction. Clin Infect Dis. 2019;68(10):1739–46. Epub 2018/08/24. doi: 10.1093/cid/ciy718 . - DOI - PMC - PubMed
    1. Frecker MF, Pryse-Philli WEM, Strong HR. Immunological Associations in Familial and Non-Familial Alzheimer Patients and Their Families. Canadian Journal of Neurological Sciences / Journal Canadien des Sciences Neurologiques. 1994;21(2):112–9. Epub 2015/09/18. doi: 10.1017/s0317167100049027 - DOI - PubMed

MeSH terms

LinkOut - more resources