Comparative transcriptome analysis of albino northern snakehead (Channa argus) reveals its various collagen-related DEGs in caudal fin cells
- PMID: 39739744
- PMCID: PMC11687805
- DOI: 10.1371/journal.pone.0315996
Comparative transcriptome analysis of albino northern snakehead (Channa argus) reveals its various collagen-related DEGs in caudal fin cells
Abstract
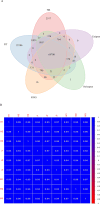
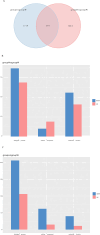
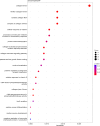
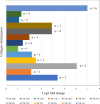
The albino northern snakehead (Channa argus) is an aquaculture species characterized by heritable albino body color, in contrast to the typical coloration. Additionally, there are gray- and golden-finned individuals, which exhibit distinct coloration in their caudal fins. We performed RNA-seq to profile the transcriptome of caudal fin tissues in albino gray-finned and golden-finned C. argus, contrasting these with normal morphs to elucidate the differences between the two groups. A total of 137,130 unigenes were identified in this study. Gene Ontology (GO) analysis showed that the identified DEGs were significantly enriched in cellular components related to cytoplasm. So far, 379 common DEGs have been identified in all three groups. Notably, we observed more DEGs in golden-finned individuals compared to gray-finned individuals. We also revealed that golden-finned individuals were enriched in collagen-related pathways compared with normal individuals. The enriched DEGs of collagen components include collagen I of COL1A1 and COL1A2, collagen II of COL2A1, collagen V of COL5A1 and COL5A2, collagen VI of COL6A1 and COL6A3, collagen IX of COL9A3, collagen X of COL10A1, collagen XI of COL11A2, collagen XII of COL12A1, collagen XVI of COL16A1, collagen XVIII of COL18A1 and decorin (DCN), all of which play a role in modulating the collagen matrix. In golden-finned albino fish, collagen-related genes were downregulated, suggesting that despite the abundance of collagen types in their caudal fin cells, gene expression was slightly limited. This work provides valuable genetic insights into collagen variation in albino C. argus, lays the foundation for research on collagen genes and is crucial for the development and utilization of fish-derived collagen as a biomaterial for tissue engineering and biomedical applications.
Copyright: © 2024 Chen et al. This is an open access article distributed under the terms of the Creative Commons Attribution License, which permits unrestricted use, distribution, and reproduction in any medium, provided the original author and source are credited.
Conflict of interest statement
The authors have declared that no competing interests exist.
Figures


References
-
- Dunsmore SE. Extracellular Matrix | Collagens. Encyclopedia of Respiratory Medicine, ed. Laurent G. J., Shapiro S.D. Oxford: Academic Press; 2006. pp. 168–175. doi: 10.1016/b0-12-370879-6/00145-9 - DOI
-
- Ando M, Toyohara H, Sakaguchi M. Three-dimensional structure of collagen fibrillar network of pericellular connective tissue in association with firmness of fish muscle. Nippon Suisan Gakk. 1992;58(7):1361–1364. doi: 10.2331/suisan.58.1361 - DOI
-
- Lin F, Ye X, Lin J, Liu X, Yuan Y, Guo H, et al. Comparative transcriptome analysis between muscle and swim bladder reveals key genes regulating collagen deposition in zebrafish. Aquaculture Reports. 2022. Apr 1;23:101053. doi: 10.1016/j.aqrep.2022.101053 - DOI
-
- Johnston IA. The biological basis of variability in the texture of fish flesh. Improving seafood products for the consumer. ed. Børresen T. Cambridge: Woodhead Publishing Limited; 2008. pp. 465–489. doi: 10.1533/9781845694586.5.465 - DOI
-
- Song D, Yun Y, Mi J, Luo J, Jin M, Nie G, et al. Effects of faba bean on growth performance and fillet texture of Yellow River carp, Cyprinus carpio haematopterus. Aquaculture Reports. 2020. Jul 1;17:100379. doi: 10.1016/j.aqrep.2020.100379 - DOI
Publication types
MeSH terms
Substances
Supplementary concepts
LinkOut - more resources
Full Text Sources
Miscellaneous

