. 2024 Dec 31;19(12):e0316384.
doi: 10.1371/journal.pone.0316384. eCollection 2024.

Early life stress shifts critical periods and causes precocious visual cortex development

Affiliations

Early life stress shifts critical periods and causes precocious visual cortex development

Janet Poplawski et al. PLoS One. .

Abstract

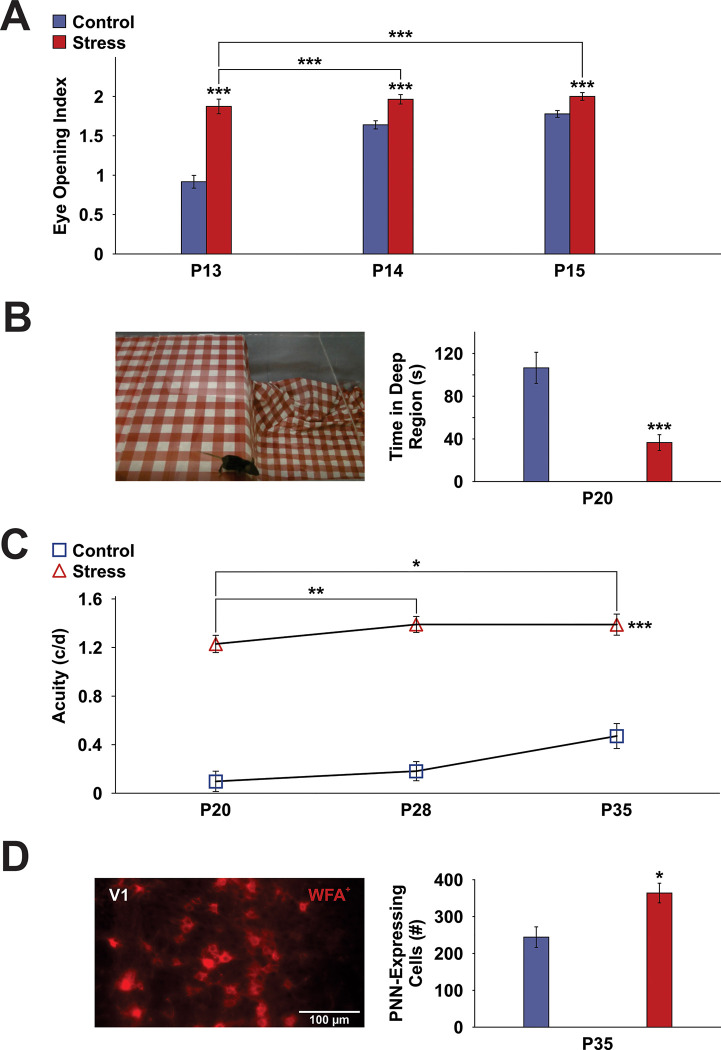
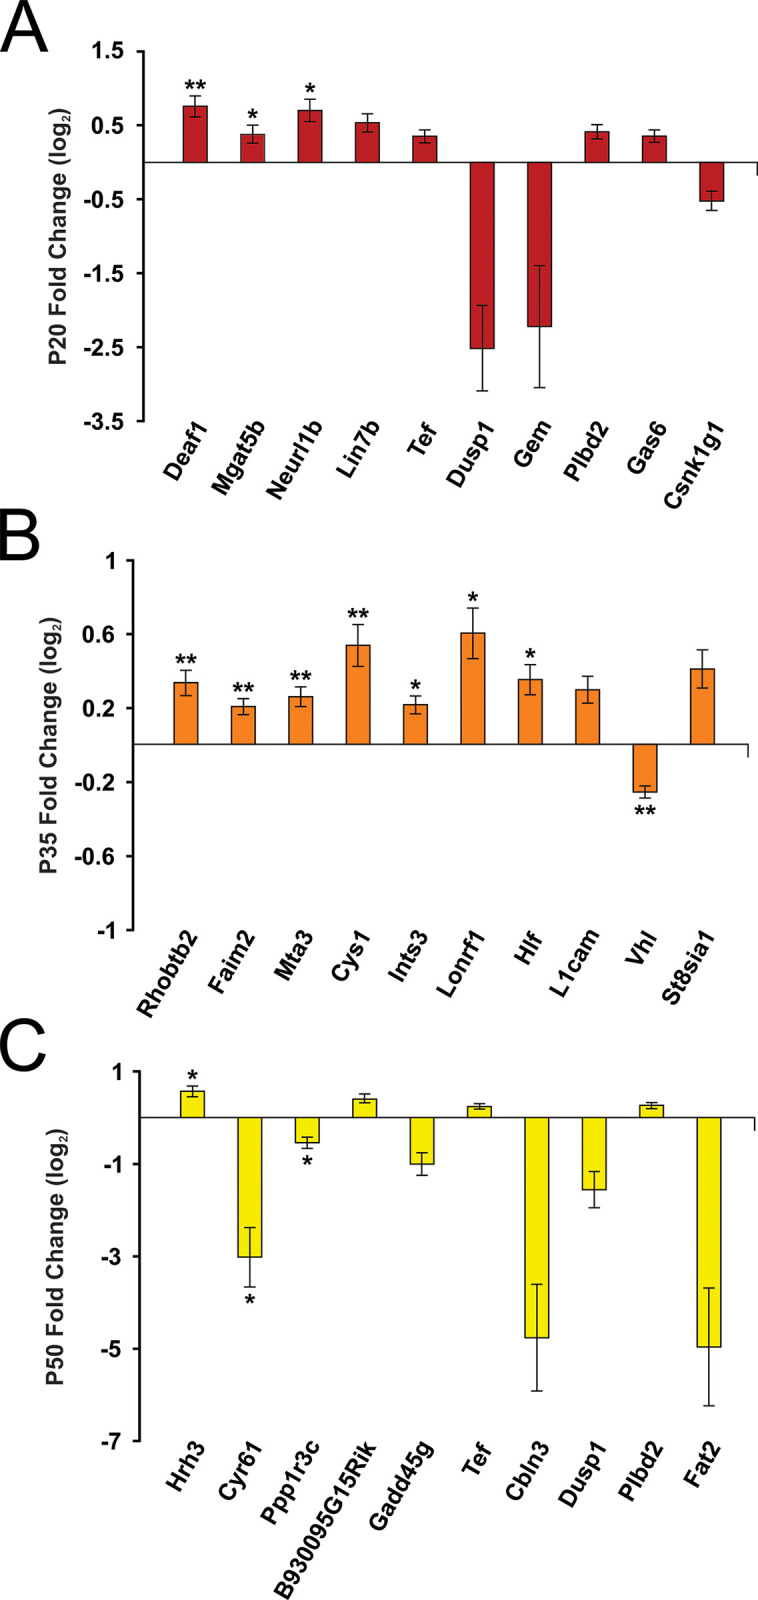
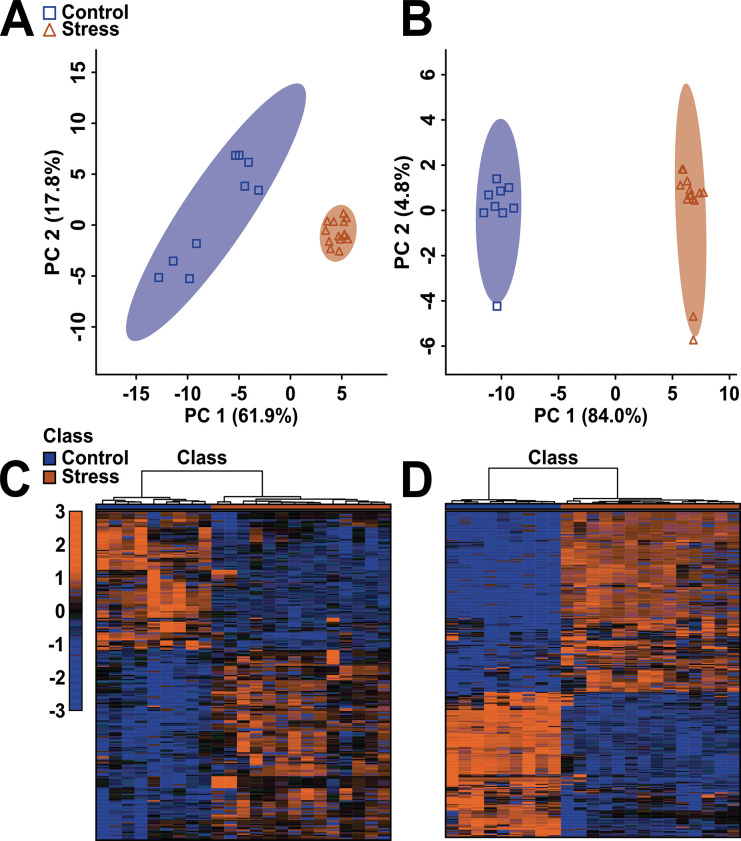
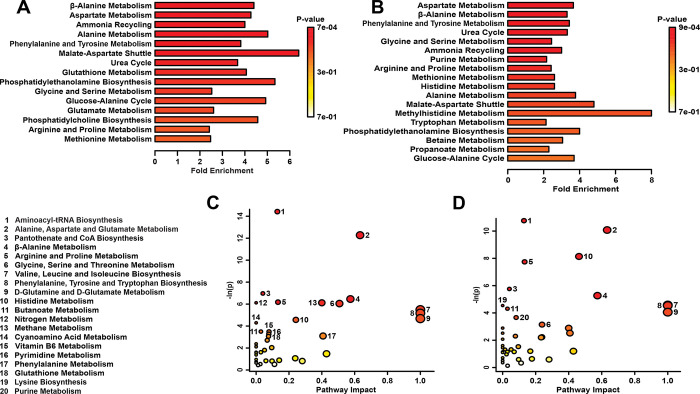
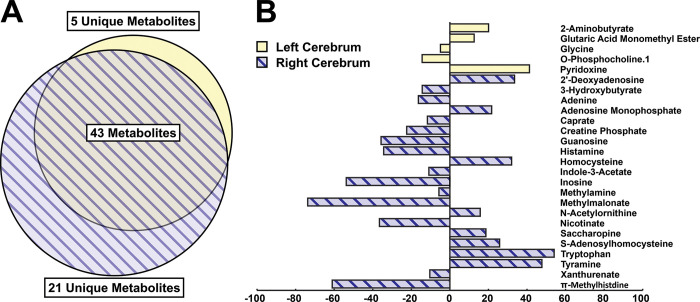
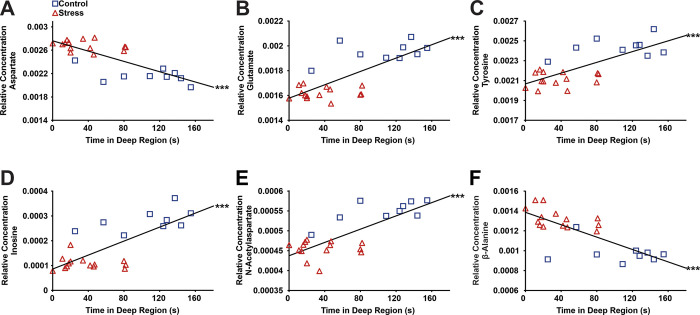
The developing nervous system displays remarkable plasticity in response to sensory stimulation during critical periods of development. Critical periods may also increase the brain's vulnerability to adverse experiences. Here we show that early-life stress (ELS) in mice shifts the timing of critical periods in the visual cortex. ELS induced by animal transportation on postnatal day 12 accelerated the opening and closing of the visual cortex critical period along with earlier maturation of visual acuity. Staining of a molecular correlate that marks the end of critical period plasticity revealed premature emergence of inhibitory perineuronal nets (PNNs) following ELS. ELS also drove lasting changes in visual cortex mRNA expression affecting genes linked to psychiatric disease risk, with hemispheric asymmetries favoring the right side. NMR spectroscopy and a metabolomics approach revealed that ELS was accompanied by activated energy metabolism and protein biosynthesis. Thus, ELS may accelerate visual system development, resulting in premature opening and closing of critical period plasticity. Overall, the data suggest that ELS desynchronizes the orchestrated temporal sequence of regional brain development potentially leading to long-term functional deficiencies. These observations provide new insights into a neurodevelopmental expense to adaptative brain plasticity. These findings also suggest that shipment of laboratory animals during vulnerable developmental ages may result in long lasting phenotypes, introducing critical confounds to the experimental design.


Conflict of interest statement

The authors have declared that no competing interests exist.

Figures

Fig 1
Fig 1. Multidimensional stress induces precocious development of the visual system.
(A) Eye Opening Index throughout early adolescence showing accelerated eye-opening in multidimensionally-stressed animals at P13, P14 and P15. (B) Photograph of a mouse in the shallow region of the visual cliff apparatus, observed to measure the precocious development of depth perception. Stressed animals spent significantly less time in the deep region of the apparatus, indicating increased perception of the visual cliff. (C) Stressed animals showed improved visual performance relative to non-stressed controls in the visuospatial testing box as measured by the optokinetic reflex. (D) Photograph of WFA+ cells, indicating the presence of PNNs, in the primary visual cortex of an adolescent control mouse. Stressed animals showed an increased abundance of PNN-expressing cells at the closure of the critical period for visual system development relative to non-stressed controls. Asterisks indicate significances: *p < 0.05, **p < 0.01, ***p<0.001. Error bars represent ± SEM.
Fig 2
Fig 2. ELS programs mRNA expression profiles across development.
Fold changes (log2) of mRNA in P20 (A), P35 (B), and P50 (C) stressed animals in reference to controls. Note that EPS led to up- or down-regulation of unique mRNA transcripts across development. Asterisks denote significances (FDR-adjusted; *p<0.05, **p<0.01). Error bars represent ± SEM.
Fig 3
Fig 3
PCA scores plots (A, B) and heat maps (C, D) showing statistically significant separation between adult mice exposed to EPS and controls for both left (A, C) and right (B, D) cerebra, plotted using a list of metabolites found to be statistically significant by a Mann-Whitney U-test. For the PCA plots (A, B), each triangle or square represents one individual under study. The x- and y-axes show principal components 1 and 2, respectively, with the percentages shown in brackets along each axis indicating the amount of data variance explained by that component. For the heat maps (C, D), the x- and y-axes show the class and individual spectral bins, respectively. These heat maps visually indicate either upregulation or downregulation of the metabolites presented in S1 Table. The dendrogram at the top of each heat map illustrates the results of the unsupervised hierarchical clustering analysis.
Fig 4
Fig 4
(A, B) MSEA plot in adult mice exposed to EPS. (C, D) Metabolomic Pathway topology analysis showing all matched pathways according to p-values from pathway enrichment analysis and pathway impact values in left (A, C) and right (B, D) cerebra of adult animals. A higher value on the y-axis indicates a lower p-value. The x-axis gives the Pathway Impact. Only metabolic pathways with p < 0.05 are labeled. This figure was created using the lists of metabolites identified as significant in a Mann-Whitney U test.
Fig 5
Fig 5. Multidimensional EPS induces brain lateralization in metabolic profiles.
Venn diagram profiling metabolites changed either uniquely or across both left and right cerebral hemispheres in stressed animals relative to controls (A). Percent differences of individual metabolites significantly altered in response to stress (p < 0.05; B).
Fig 6
Fig 6
Pearson correlations to assess the relationship between precocious development of depth perception (i.e., time spent in the deep region of the visual cliff apparatus) and the relative concentrations of (A) aspartate, (B) glutamate, (C) tyrosine, (D) inosine, (E) N-acetylaspartate, and (F) β-alanine in either left (A, B, C) or right (D, E, F) cerebra. There were negative correlations between the time spent in the deep region and aspartate (r = –0.78, p = 0.000012) and β-alanine (r = –0.76, p = 0.000027), indicating that precocious visual development was linked to higher aspartate and β-alanine concentrations. There were positive correlations between the time spent in the deep region and glutamate (r = 0.75, p = 0. 000043), tyrosine (r = 0.73, p = 0.000077), inosine (r = 0.75, p = 0.000044), and N-acetylaspartate (r = 0.77, p = 0.000020), indicating that precocious visual development was linked to lower glutamate, tyrosine, inosine, and N-acetylaspartate concentrations.

Similar articles

Cited by

References

    1. Bock J, Braun K. Blockade of N-methyl-D-aspartate receptor activation suppresses learning-induced synaptic elimination. Proc Natl Acad Sci U S A. 1999;96: 2485–2490. doi: 10.1073/pnas.96.5.2485 - DOI - PMC - PubMed
    1. Goldman PS, Rakic PT. Impact of the outside world upon the developing primate brain. Perspective from neurobiology. Bull Menninger Clin. 1979;43: 20–28. Available: https://www.ncbi.nlm.nih.gov/pubmed/420959 - PubMed
    1. Hensch TK. Critical period plasticity in local cortical circuits. Nat Rev Neurosci. 2005;6: 877–888. doi: 10.1038/nrn1787 - DOI - PubMed
    1. Lorenz K. The Foundations of Ethology: The principal ideas and discoveries in animal behavior. Simon & Schuster; 1982.
    1. Hensch TK. Critical period regulation. Annu Rev Neurosci. 2004;27: 549–579. doi: 10.1146/annurev.neuro.27.070203.144327 - DOI - PubMed