. 2025 Jan 7;122(1):e2412391122.
doi: 10.1073/pnas.2412391122. Epub 2024 Dec 31.

Aberrant neuronal hyperactivation causes an age-dependent behavioral decline in Caenorhabditis elegans

Affiliations

Aberrant neuronal hyperactivation causes an age-dependent behavioral decline in Caenorhabditis elegans

Binta Maria Aleogho et al. Proc Natl Acad Sci U S A. .

Abstract

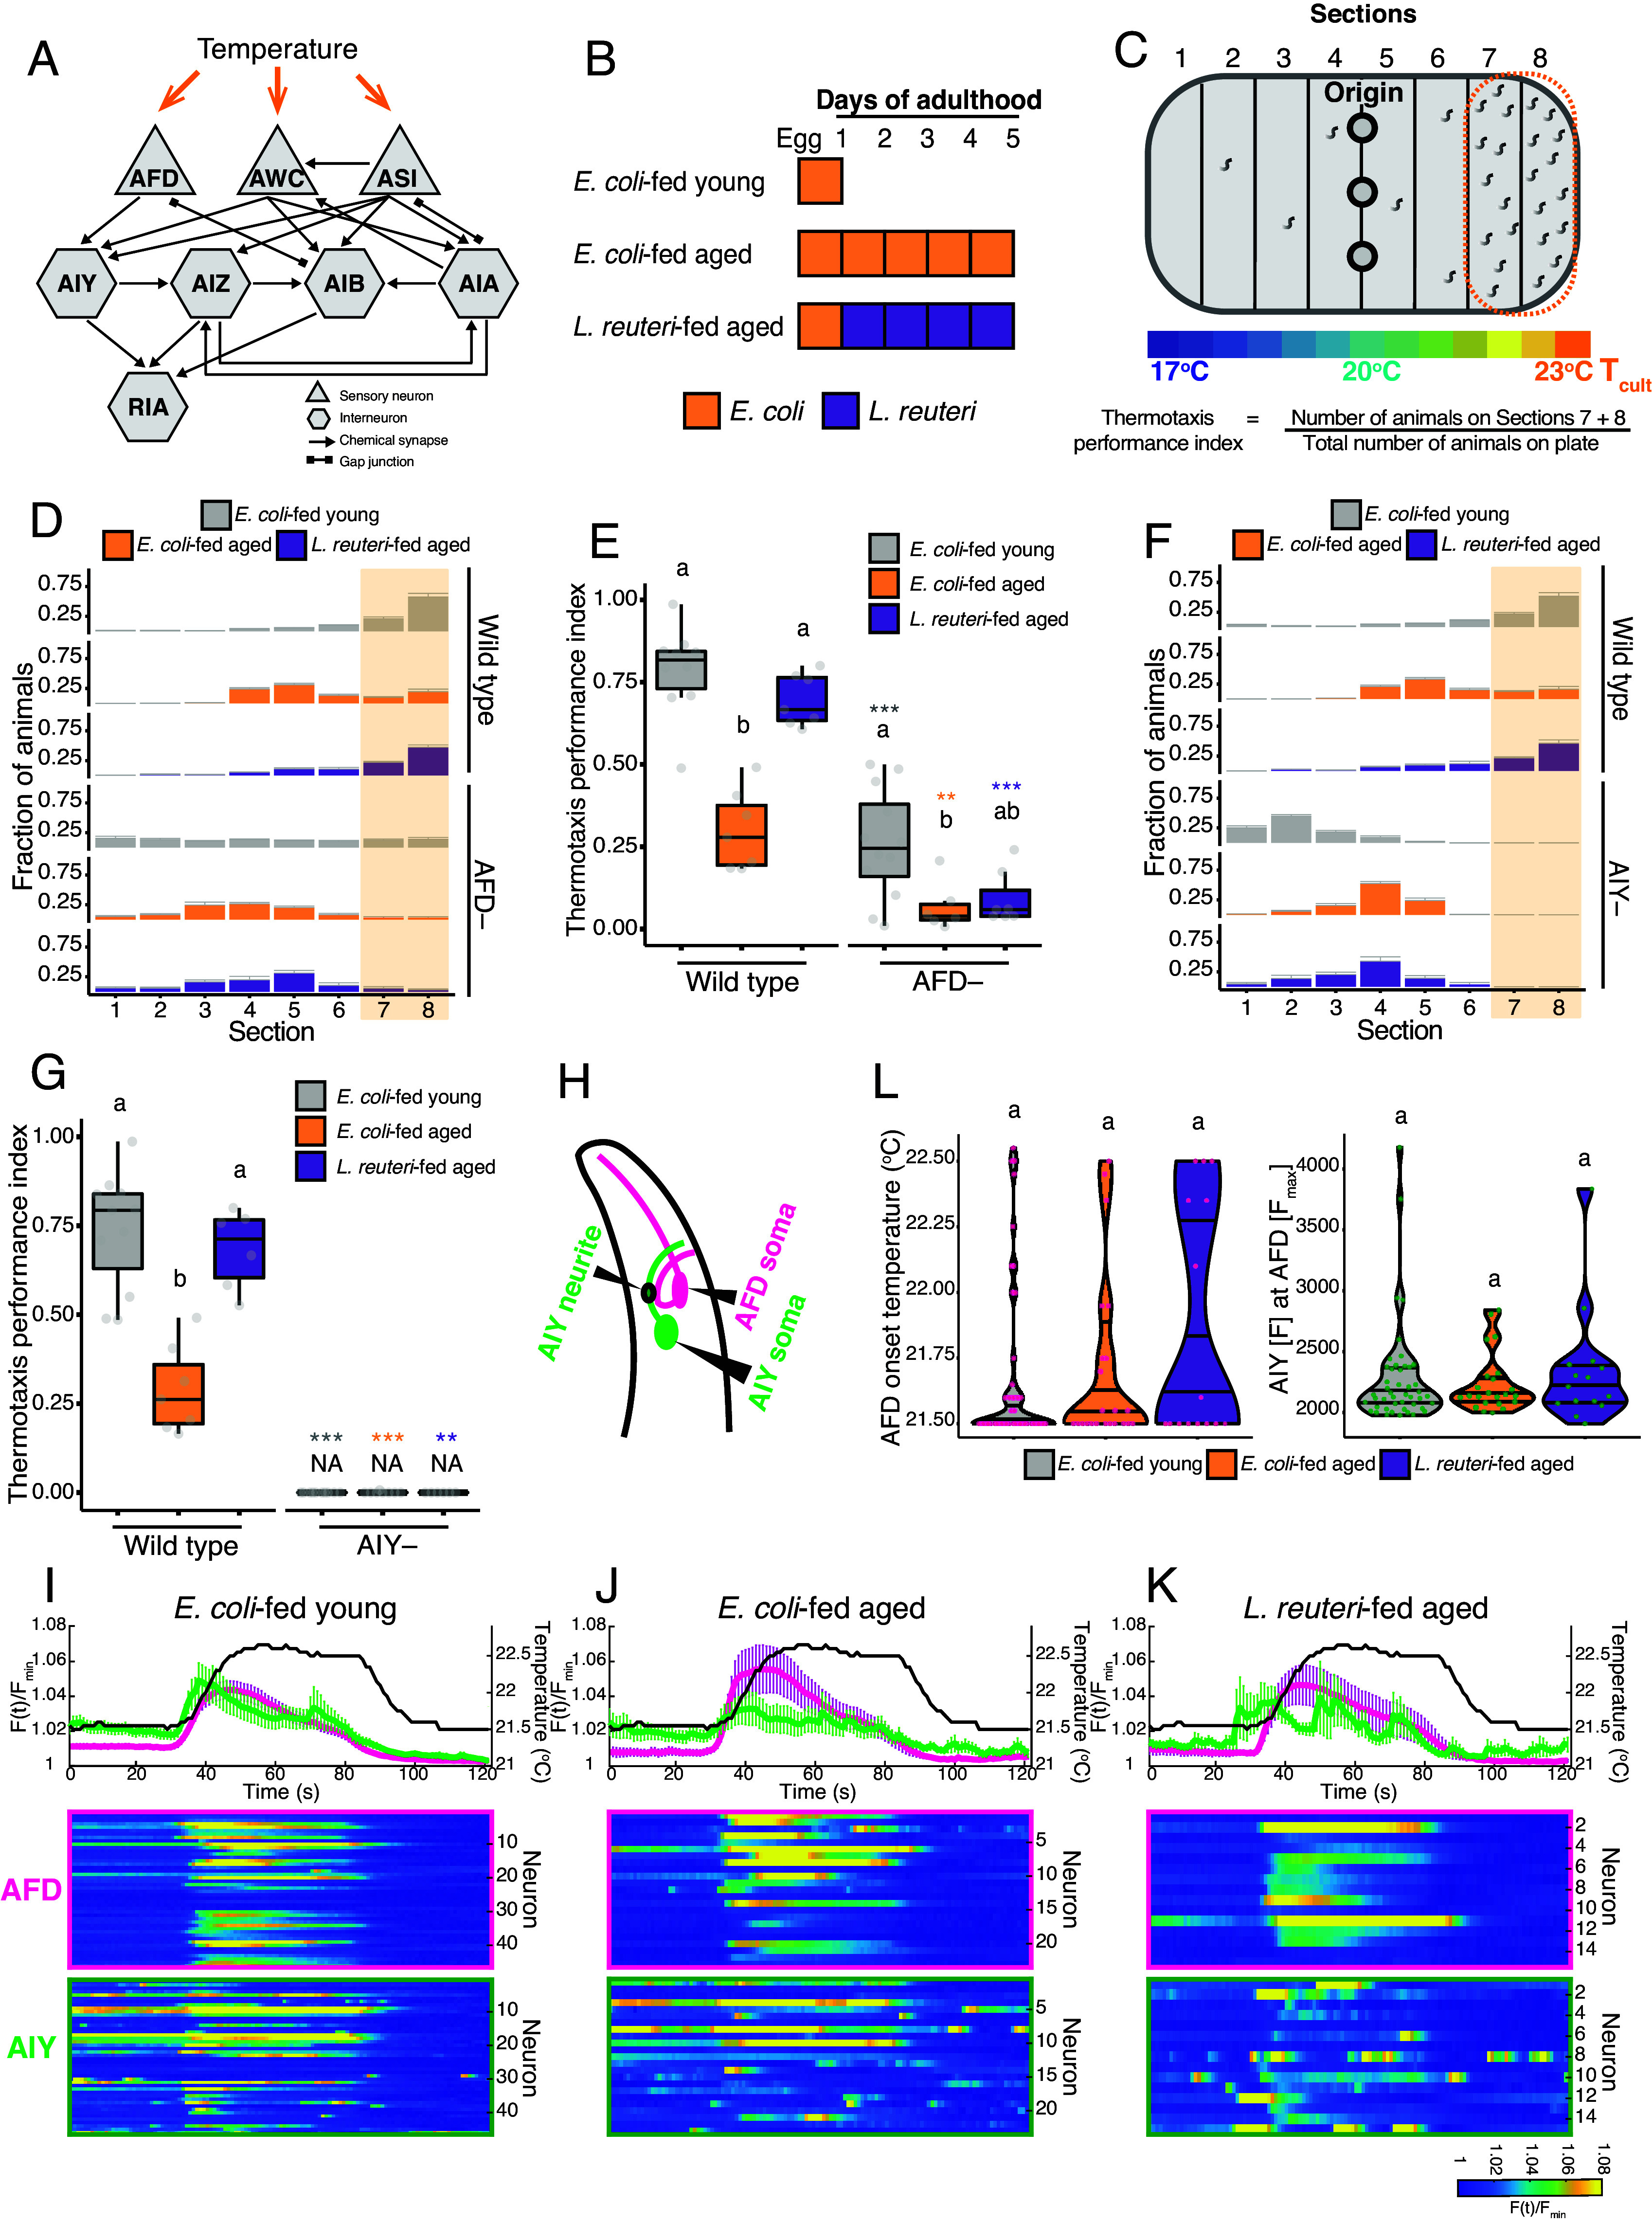
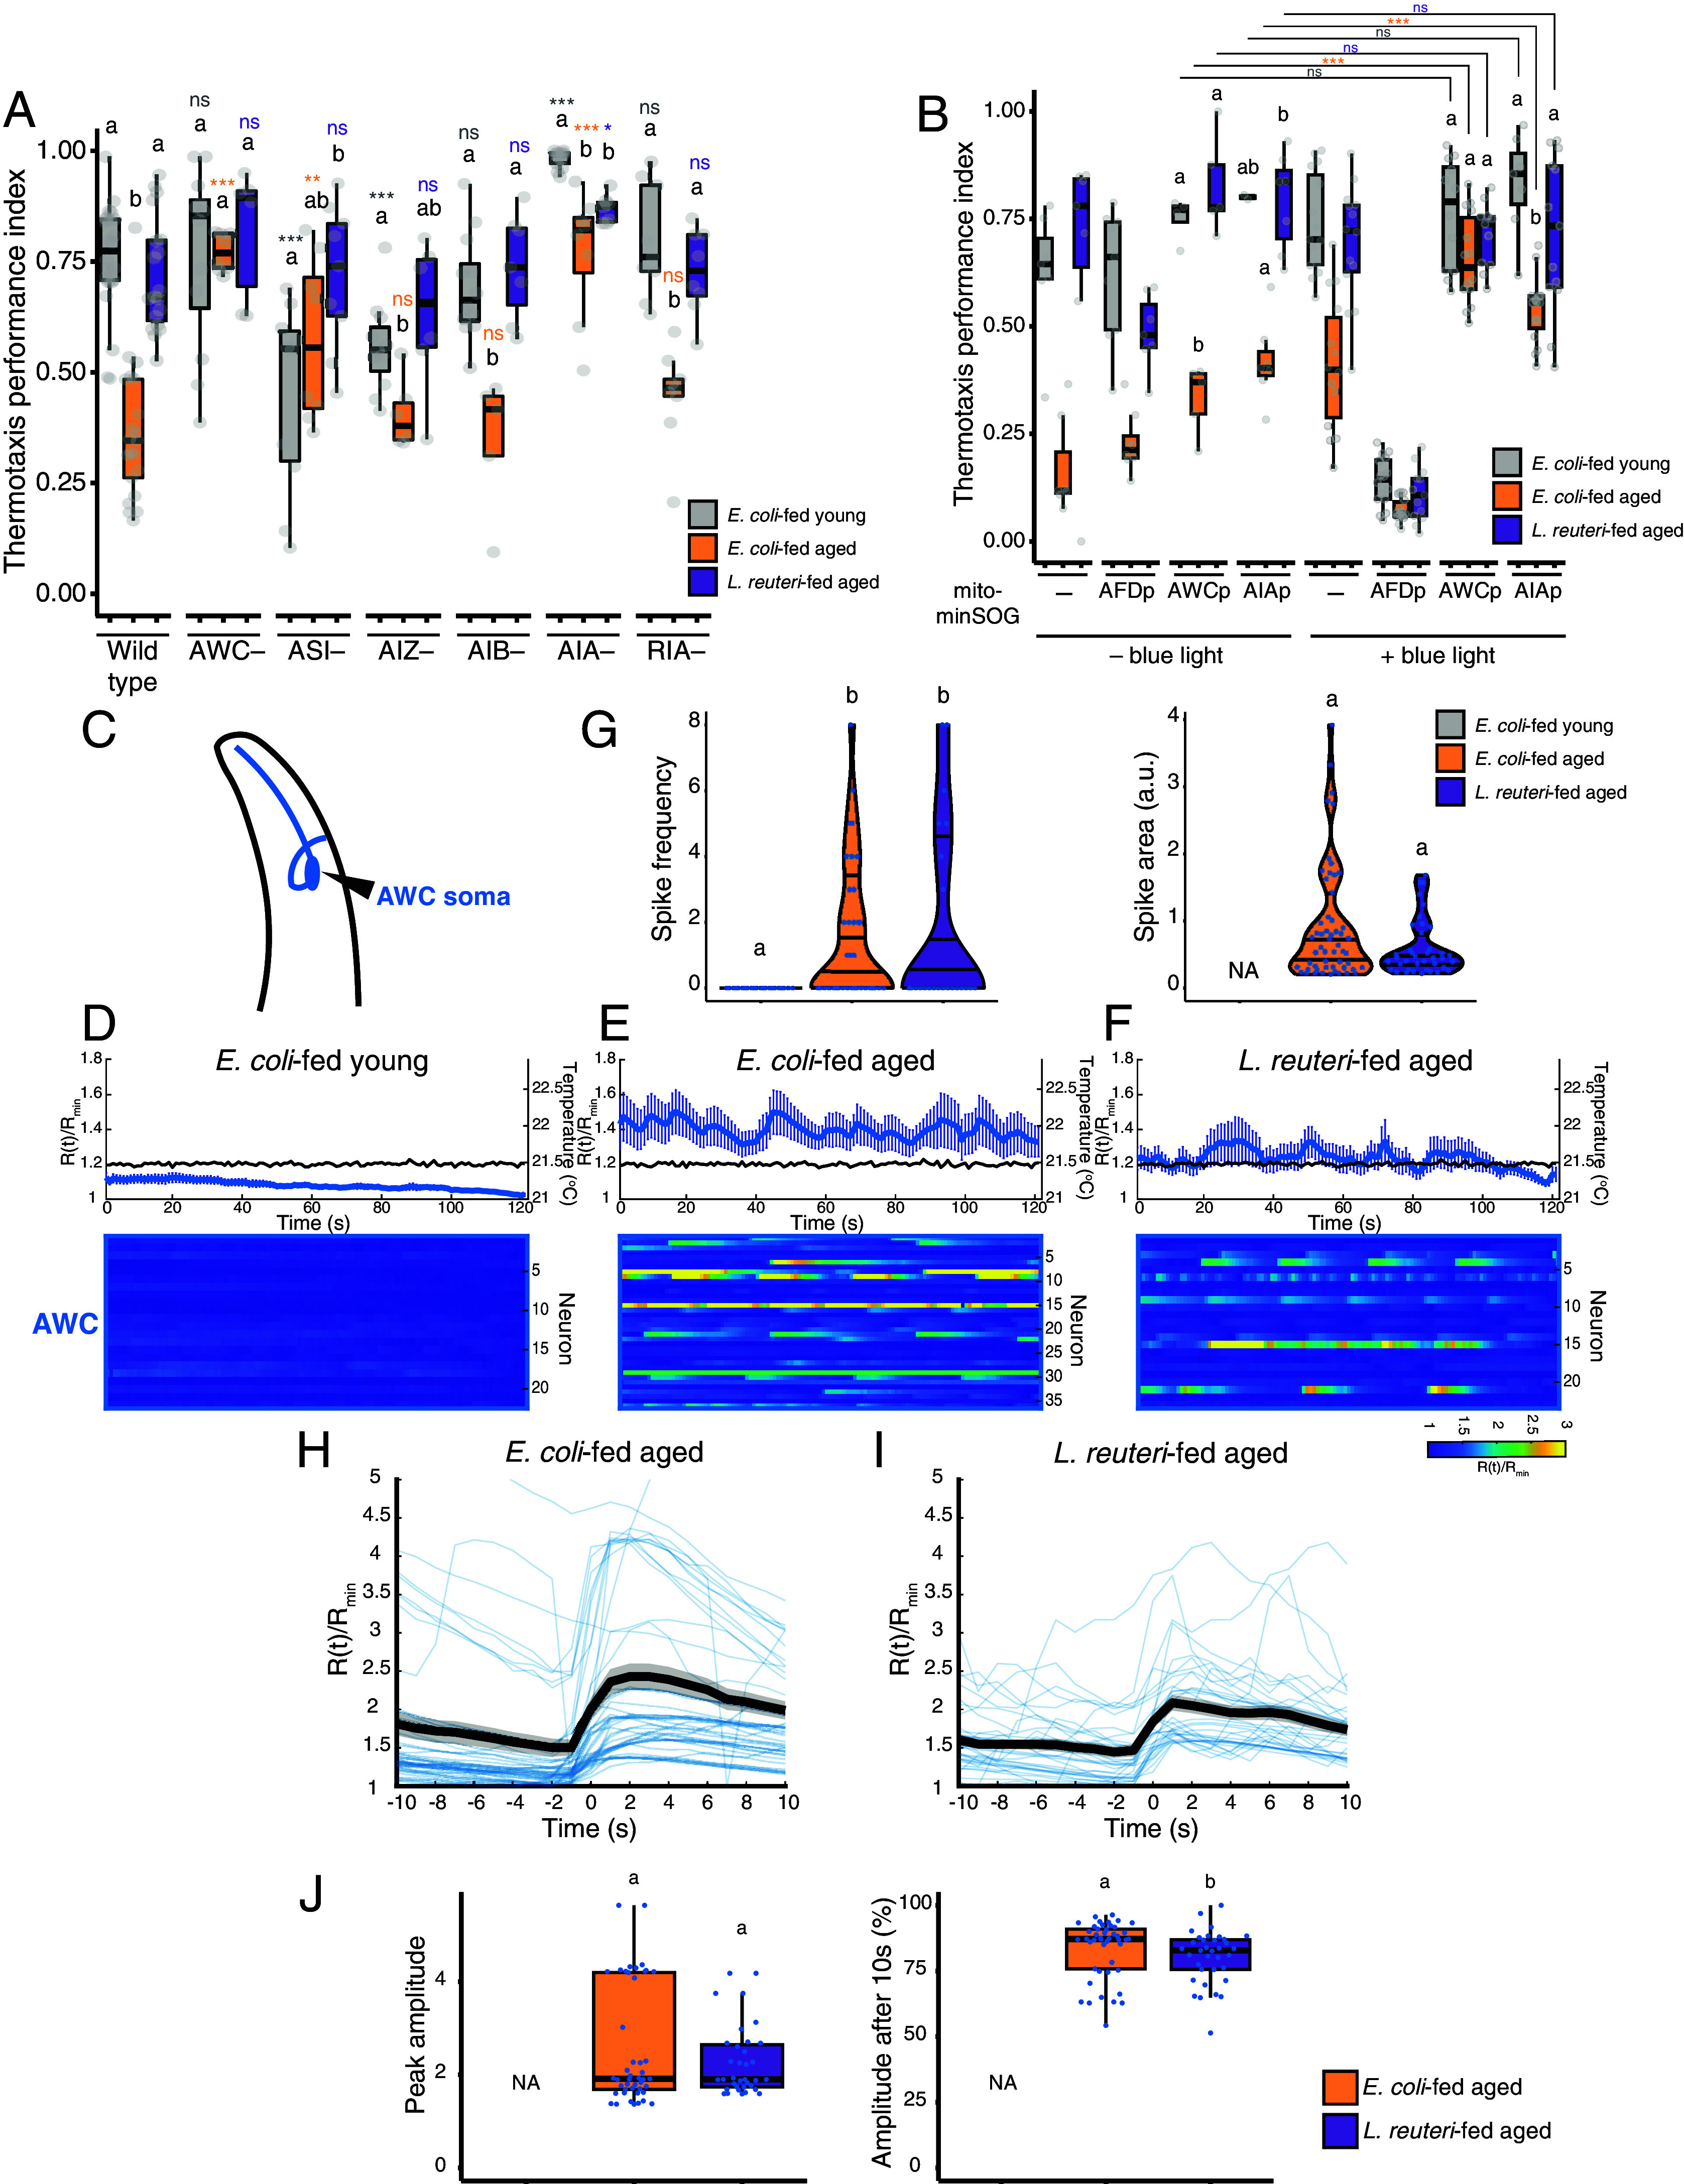
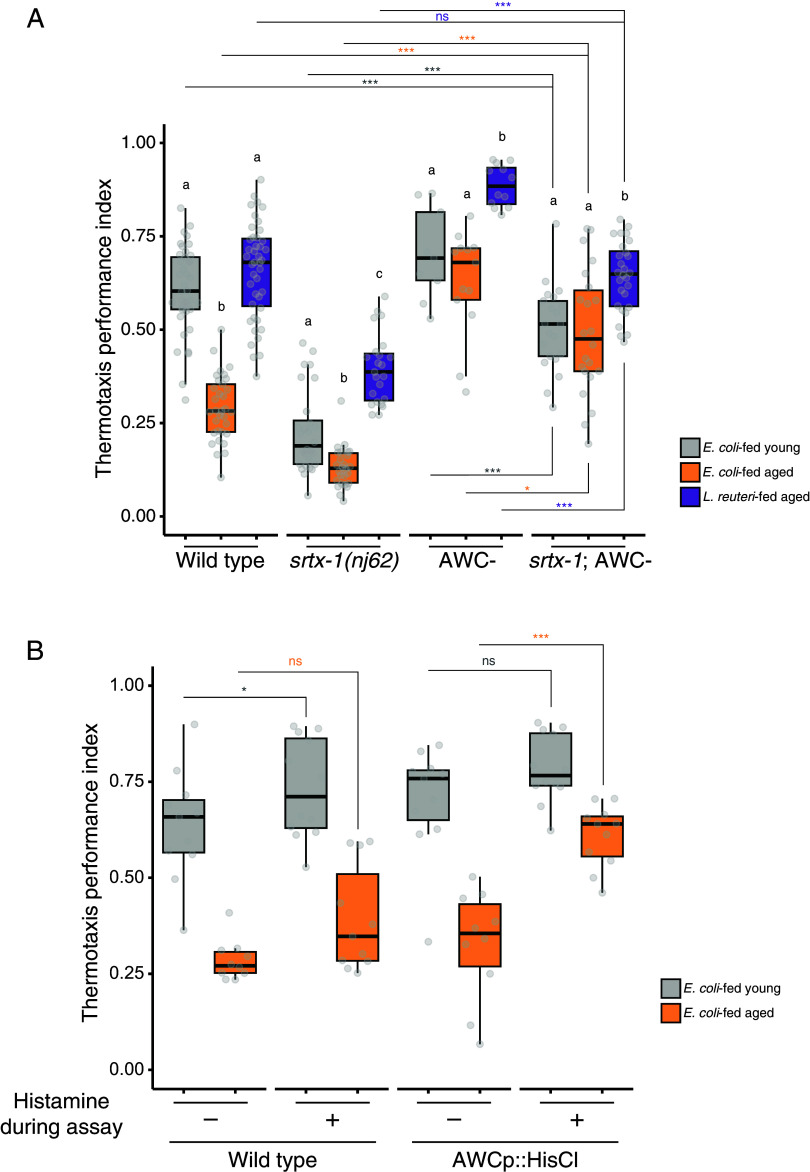
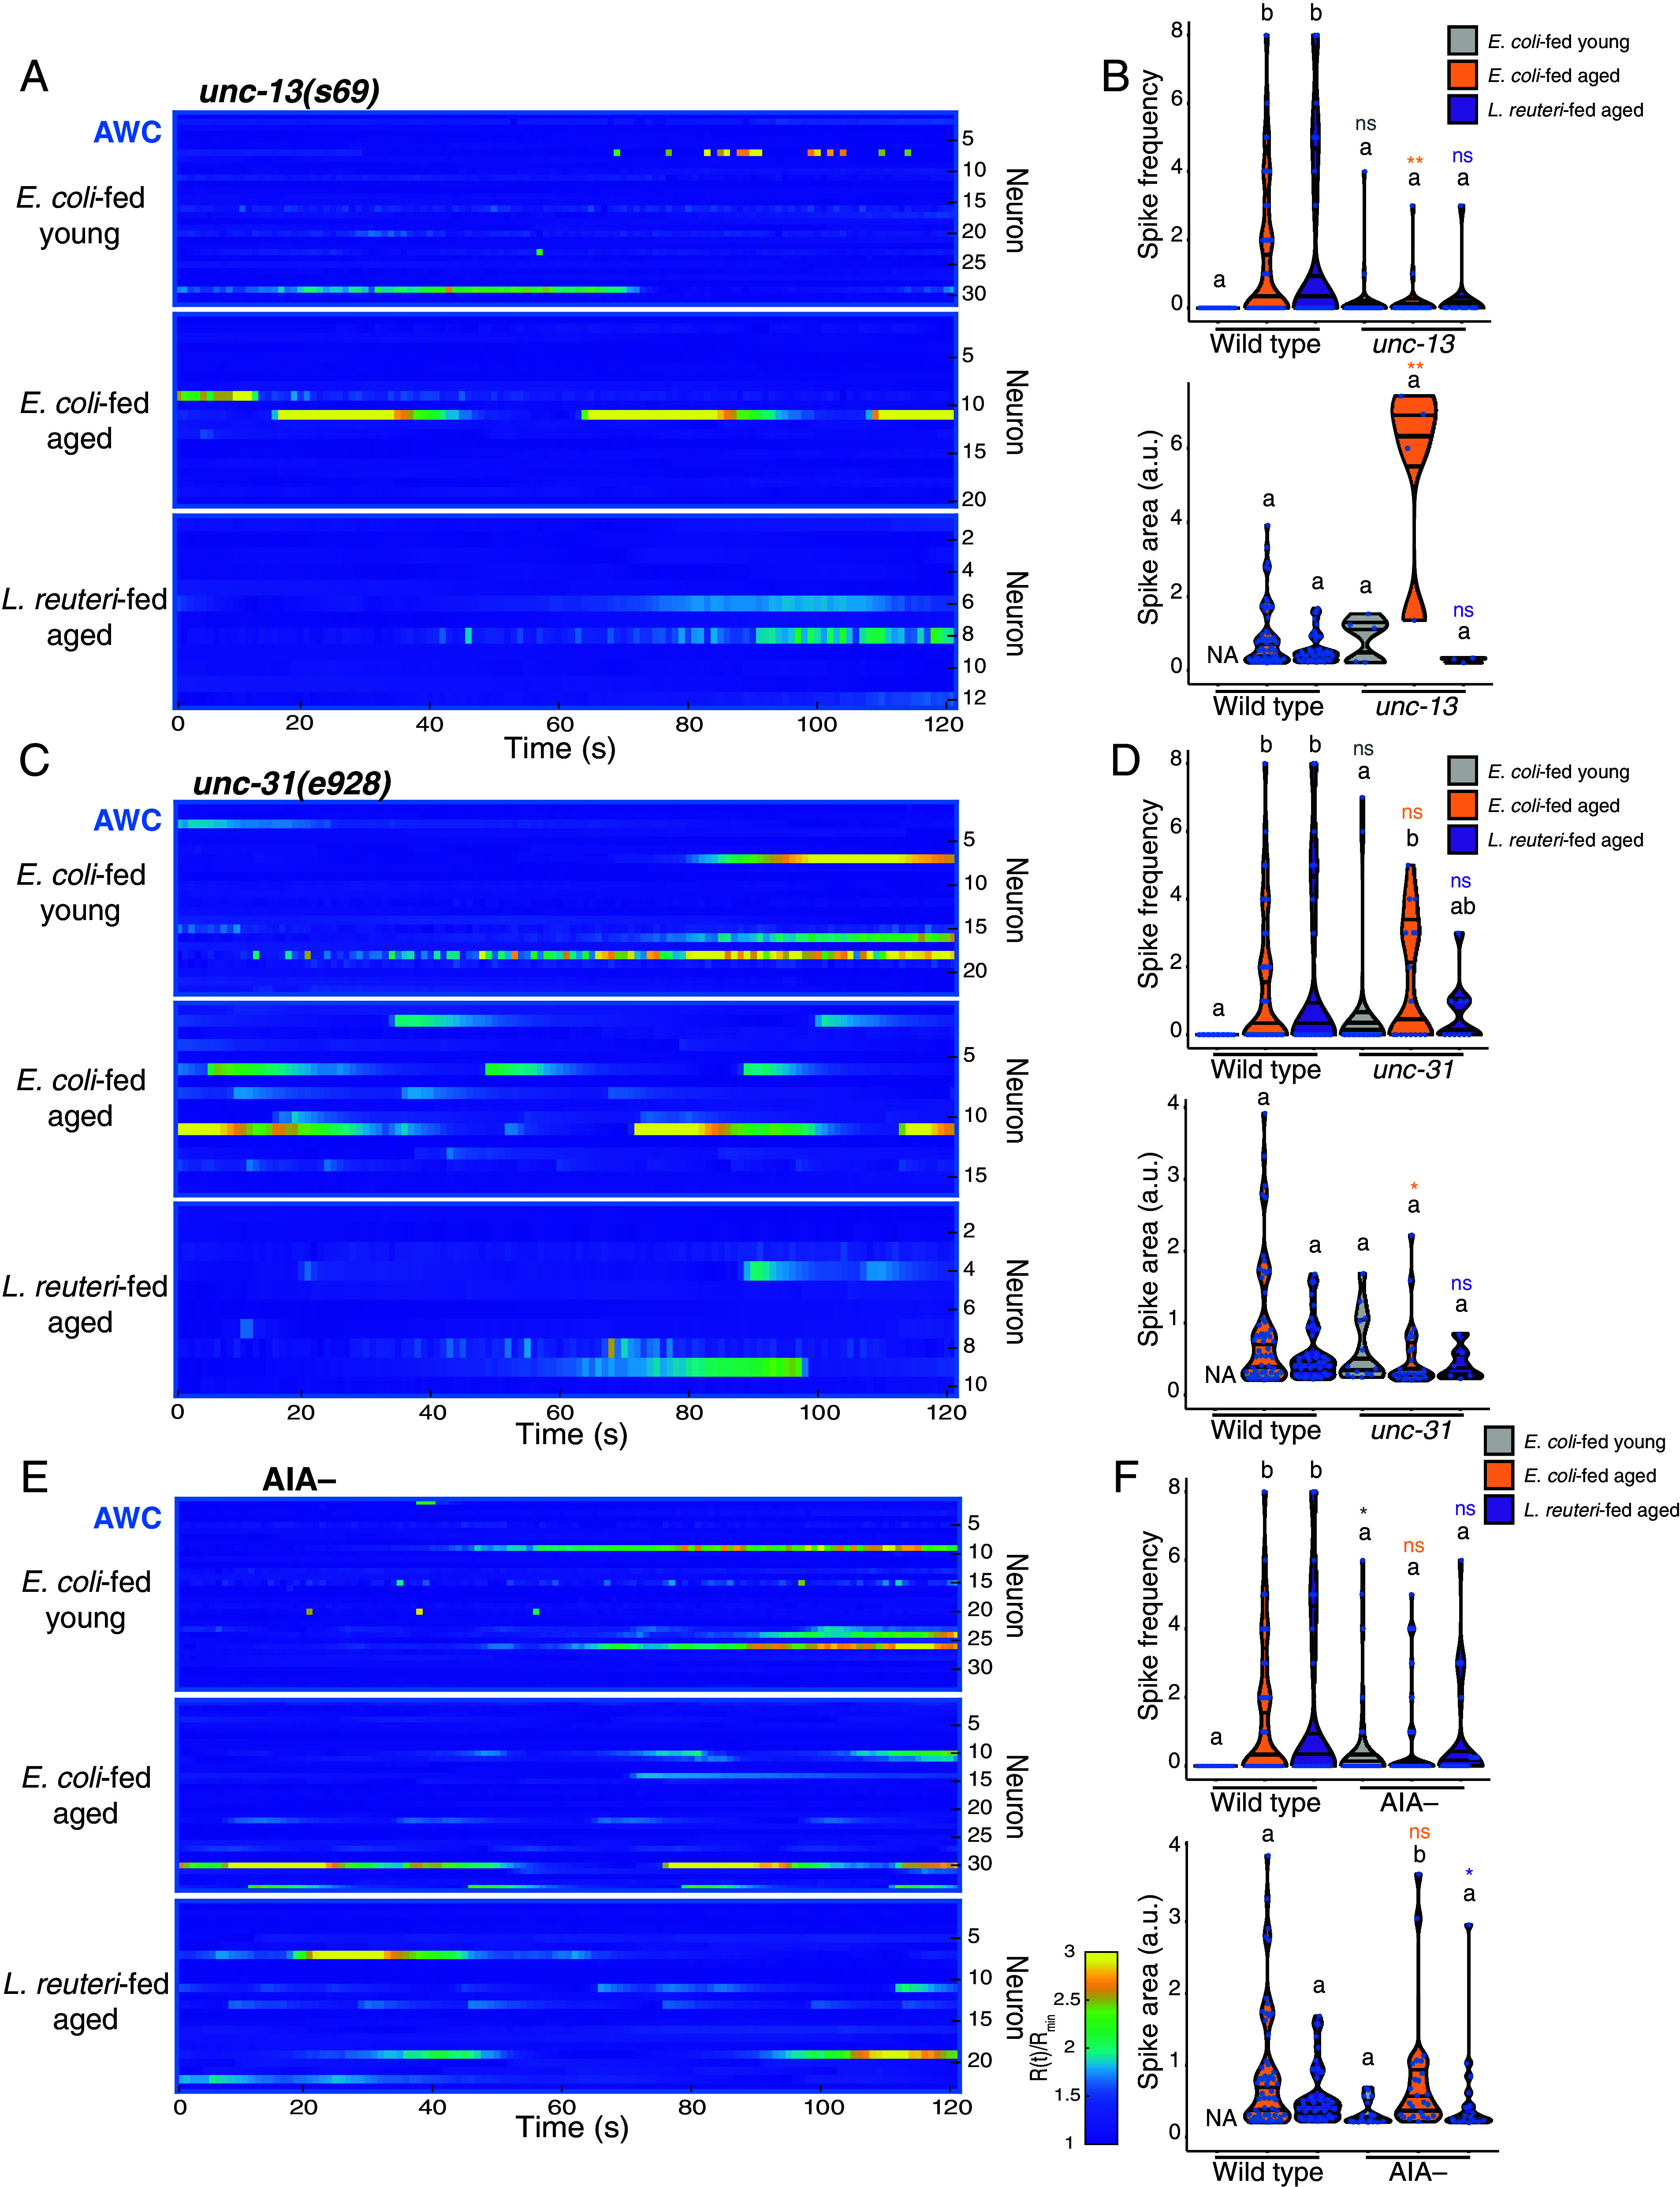
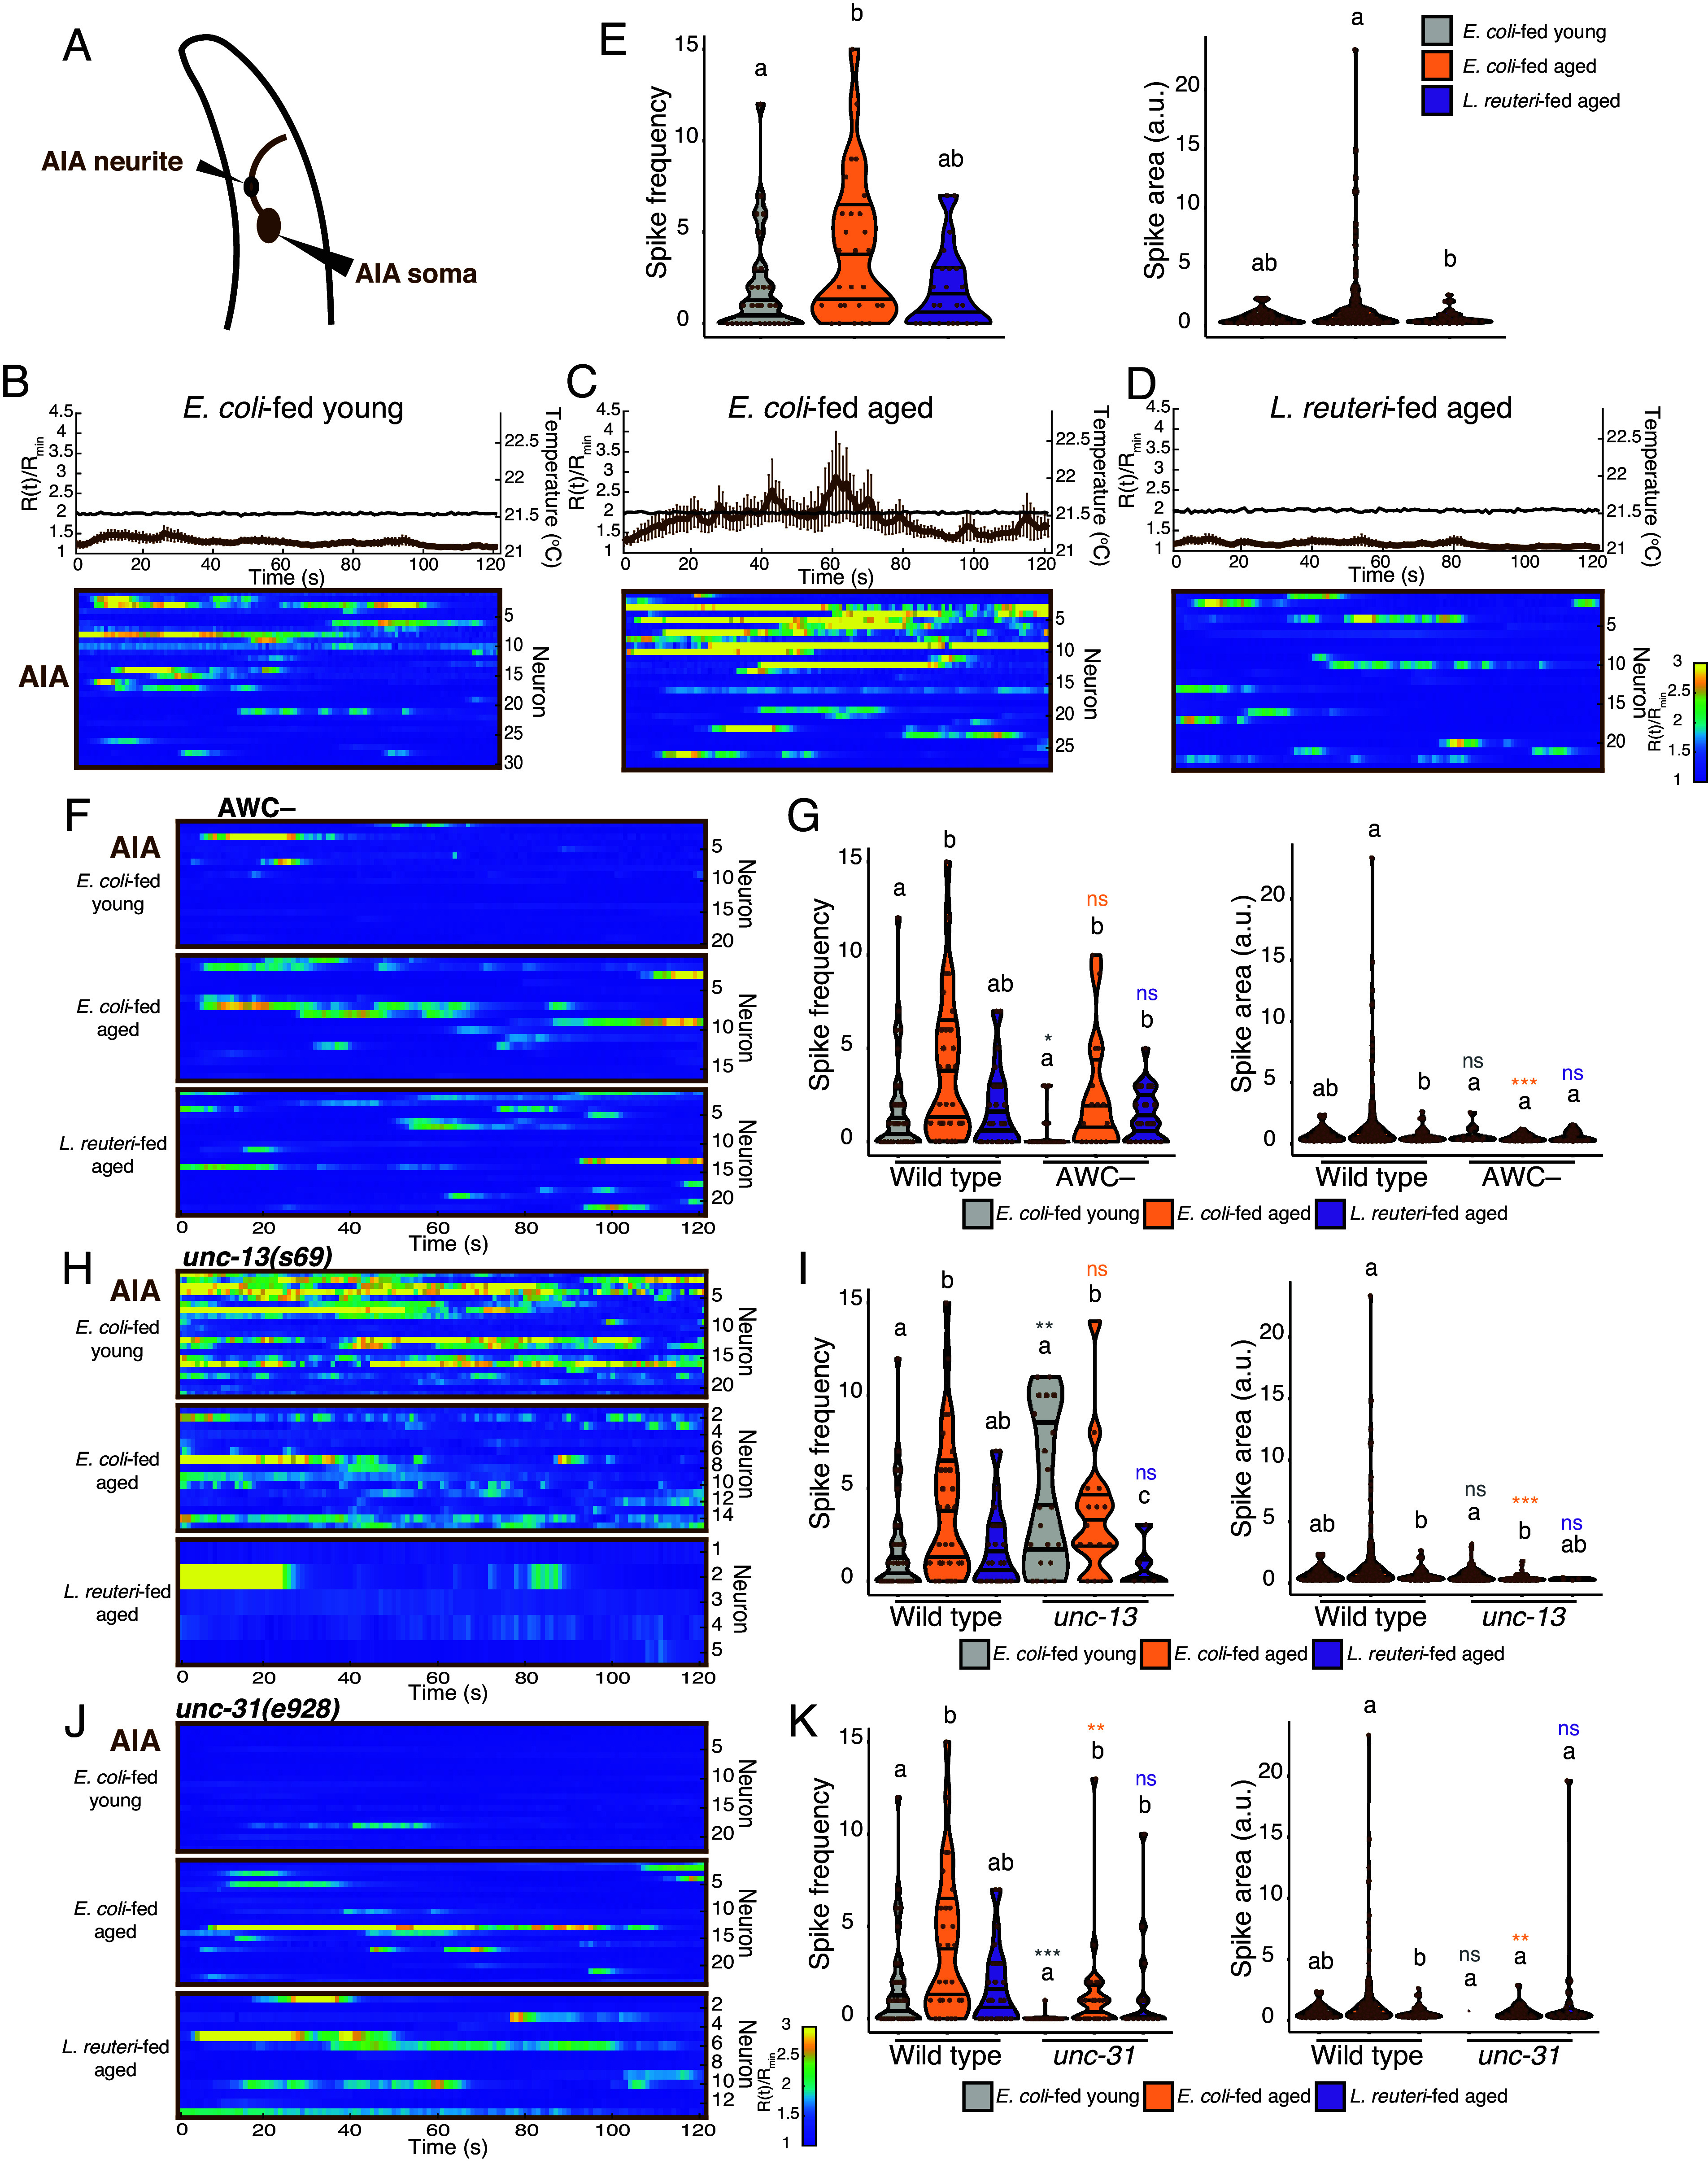
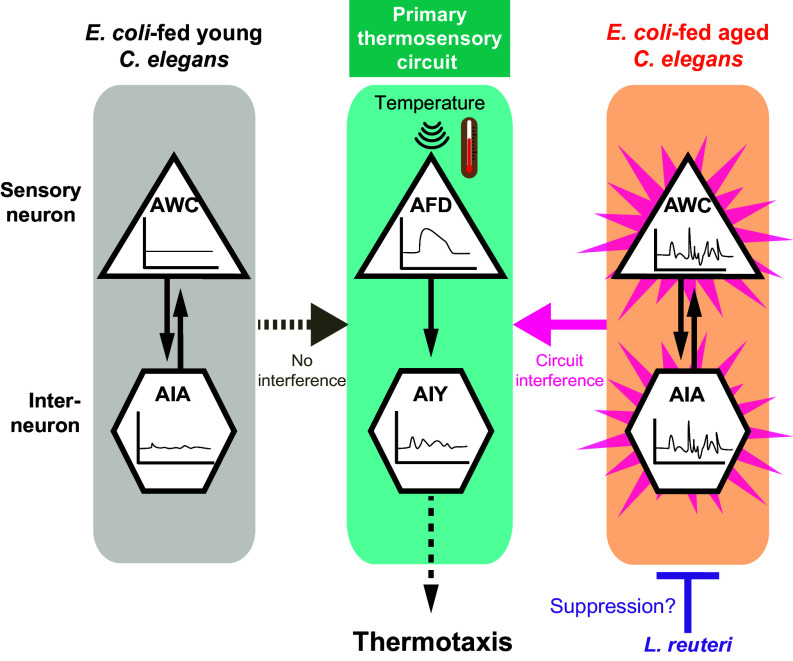
Age-dependent sensory impairment, memory loss, and cognitive decline are generally attributed to neuron loss, synaptic dysfunction, and decreased neuronal activities over time. Concurrently, increased neuronal activity is reported in humans and other organisms during aging. However, it is unclear whether neuronal hyperactivity is the cause of cognitive impairment or a compensatory mechanism of circuit dysfunction. The roundworm Caenorhabditis elegans exhibits age-dependent declines in an associative learning behavior called thermotaxis, in which its temperature preference on a thermal gradient is contingent on food availability during its cultivation. Cell ablation and calcium imaging demonstrate that the major thermosensory circuit consisting of AFD thermosensory neuron and AIY interneuron is relatively intact in aged animals. On the other hand, ablation of either AWC sensory neurons or AIA interneurons ameliorates the age-dependent thermotaxis decline. Both neurons showed spontaneous and stochastic hyperactivity in aged animals, enhanced by reciprocal communication between AWC and AIA via neurotransmitters and neuropeptides. Our findings suggest that AWC and AIA hyperactivity mediates thermotaxis decline in aged animals. Furthermore, dietary modulation could ameliorate age-dependent thermotaxis decline by suppressing neuronal hyperactivity. We propose that aberrantly enhanced, not diminished, neuronal activities can impair the behavior of aged animals.

Keywords: C. elegans; behavioral aging; diet; neuronal hyperactivity; thermotaxis.


Conflict of interest statement

Competing interests statement:The authors declare that they have no competing interests. S.T. is a former employee of MEGMILK SNOW BRAND Co., Ltd.

Figures

Fig. 1.
Fig. 1.
Aged animals require AFD sensory neurons and AIY interneurons for thermotaxis. (A) Schematic of the neural circuit diagram of thermosensory neurons and downstream interneurons (8, 9, 35, 36). (B) Schematic of animal feeding design. “Young” refers to animals on the first day of adulthood (D1), while “aged” refers to animals on the fifth day of adulthood (D5). (C) Schematic of a thermotaxis assay plate. Eight sections were drawn on the plate, and animals were spotted at the origin (20 °C center, except otherwise stated) and allowed to move freely. Thermotaxis performance indices reflecting the animals’ ability to learn and migrate to Tcult were calculated using the indicated formula. (D-G) Thermotaxis of AFD– (D and E) and AIY– (F and G) animals. (D and F) Distribution of animals with indicated genotypes on thermotaxis plates from data in (E) and (G), respectively. Light brown rectangles indicate the two sections near Tcult. Error bars denote SEM. (E and G) Box and whisker plots of thermotaxis performance indices of wild type (WT) and indicated neuron-ablated animals in the different age and diet conditions ((E) WT: n = 10,7,7; AFD–: n = 12,6,7 and (G) WT: n = 10,8,6; AIY–: n = 11,7,6). “Not applicable” (NA) in (G) depicts that most values were zero and could not be analyzed statistically. (H) Schematic of AFD thermosensory neuron and AIY interneuron. (IK) Calcium signals of AFD soma and AIY neurite in indicated conditions in the WT under a 1 °C-temperature increase at 0.05 °C/s. R-CaMP2 fluorescence, F(t), in AFD and AIY, was simultaneously measured and standardized by the minimum fluorescence value, Fmin, in each neuron recording. Magenta and green lines depict the average calcium signals in AFD and AIY, respectively. Error bars are SEM. Black lines indicate average temperature stimuli. Heat maps of calcium signals in AFD and AIY are shown at the Bottom. Each horizontal bar in the heat map represents a recording from one animal. (L) Violin plots showing the temperature at the onset of AFD activation (Left) and the AIY fluorescence value, AIY [F], corresponding to AFD maximum fluorescence, AFD [Fmax], (right) (n = 46,23,15 neurons each) from data in (IK). Middle lines within violin plots show medians, and Top and Bottom lines show interquartile ranges. Each data point is data obtained from a single neuron. Statistical analysis was done using the Kruskal–Wallis test followed by a post hoc Steel–Dwass test to compare within a genotype. Different alphabets depict significant differences. A post hoc Steel test was used for corresponding comparisons with control within a condition, as represented by the distinct asterisk colors. **P ≤ 0.01 and ***P ≤ 0.001.
Fig. 2.
Fig. 2.
Hyperactivity of AWC sensory neuron interferes with thermotaxis in aged animals. (A and B) Box and whisker plots of thermotaxis performance indices of WT and animals with indicated neuron ablation in the different diet and age conditions. (A) Cell ablation by caspase during development (WT: n = 24,21,19; AWC–: n = 12,8,6; ASI–: n = 10,8,9; AIZ–: n = 11,6,6; AIB–: n = 12,5,7; AIA–: n = 13,8,7; RIA–: n = 9,9,8). (B) Cell ablation by mito-miniSOG 1 d prior to the thermotaxis assay (– blue light: WT: n = 7,7,7; AFD–: n = 9,8,7; AWC–: n = 4,5,5; AIA–: n = 2,7,2 and (+ blue light: WT: n = 15,14,14; AFD–: n = 16,14,13; AWC–: n = 12,14,11; AIA–: n = 7,15,13). (C) Schematic of AWC sensory neuron. (DF) Calcium signals of AWC soma in indicated WT conditions under a constant temperature stimulus. GCaMP6f in AWC and TagRFP in AWCON (used as a reference) were measured. The GCaMP6f/TagRFP ratio, R(t), was calculated and standardized by the minimum fluorescence ratio, Rmin, in each neuron recording. Blue lines depict the average calcium signals in AWC. Error bars are SEM. Black lines indicate average temperature stimuli. Heat maps of calcium signals are shown at the Bottom. (G) Violin plots showing quantification of calcium spike frequency per soma (Left) (n = 22,36,23 somas) and calcium spike area (Right) (n = NA,55,39 spikes) from data in (DF). NA in the right plot depicts that no spike areas could be measured since no spikes were detected in all neurons recorded (Left). Each data point represents one soma. (H and I) AWC calcium spike averages calculated for data in (E and F) 10 s before and after spike occurrence. Thin blue lines represent calcium activities of individual spikes in all neurons imaged, while the thick black line with gray shading represents the average and SEM. (E) E. coli–fed aged: n = 45. (F) L. reuteri–fed aged: n = 35. (J) Box and whisker plots of peak amplitude (Left) and percentage of peak amplitude after a 10 s decay (Right). Each data point represents individual spikes in (H and I). E. coli–fed aged: n = 45; L. reuteri–fed aged: n = 35. NA in both plots depicts that no spike averages for young animals could be measured since no spikes were detected during calcium imaging in (D). Statistical analysis was done using the Kruskal–Wallis test followed by a post hoc Steel–Dwass test to compare within a genotype. Different alphabets depict significant differences. A post hoc Steel test was used for corresponding comparisons with control within a condition, as represented by the distinct asterisk colors. *P ≤ 0.05, **P ≤ 0.01, ***P ≤ 0.001, and “ns” indicates not significant (P > 0.05).
Fig. 3.
Fig. 3.
AWC hyperactivity causes thermotaxis defects irrespective of age or diet. (A) Box and whisker plots of thermotaxis performance indices of the WT (n = 40,33,4) and indicated genotypes in the different diet and age conditions (srtx-1: n = 28,26,23; AWC–: n = 9,13,12; srtx-1; AWC–: n = 21,22,28). srtx-1(nj62) mutants were used as a model of AWC hyperactivity, and AWC was ablated by the expression of caspase. Statistical analysis was done using the Kruskal–Wallis test followed by a post hoc Steel–Dwass test to compare within a genotype. Different alphabets depict significant differences. A post hoc Steel test was used for corresponding comparisons with control within a condition, as represented by the distinct asterisk colors. *P ≤ 0.05, ***P ≤ 0.001, and ns indicates not significant (P > 0.05). (B) Box and whisker plots of thermotaxis indices of the WT (histamine –: n = 11,10; histamine +: n = 12,11) and AWCp::HisCl-expressing animals (histamine –: n = 11,10; histamine +: n = 12,11). Histamine was added only during the assay to specified conditions. Statistical analysis was done using the Mann–Whitney U/Wilcoxon rank-sum exact test. *P ≤ 0.05, ***P ≤ 0.001, and ns indicates not significant (P > 0.05).
Fig. 4.
Fig. 4.
AWC hyperactivity in aged animals depends on unc-13 and partially on AIA interneuron.(A-F) AWC activity in unc-13 (A and B), unc-31 (C and D), and AIA– (E and F) animals. (A, C, and E) Heat maps of calcium signals of AWC soma in indicated conditions in unc-13(s69) mutants, which disrupt synaptic vesicle transmission, unc-31(e928) mutants, which disrupt neuropeptide transmission, and AIA-ablated animals, respectively, under a constant temperature stimulus of 21.5 °C. (B, D, and F) Quantification of calcium spike frequency per soma (Left) and calcium spike area (Right) ((B): unc-13 spike frequency: n = 31,20,12 somas; unc-13 spike area: n = 5,4,3 spikes; (D): unc-31 spike frequency: n = 22,16,10 somas; unc-31 spike area: n = 13,25,6 spikes and (F): AIA– spike frequency: n = 33,34,23 somas; AIA– spike area: n = 18,25,17 spikes) from data in (A, C, and E) respectively. WT data are the same as in Fig. 2G. Statistical analysis was done using the Kruskal–Wallis test followed by a post hoc Steel–Dwass test to compare within a genotype. Different alphabets depict significant differences. A post hoc Steel test was used for corresponding comparisons with control within a condition, as represented by the distinct asterisk colors. *P ≤ 0.05, **P ≤ 0.01, and ns indicate not significant (P > 0.05).
Fig. 5.
Fig. 5.
AIA interneuron exhibits age-dependent hyperactivity that depends on unc-31 and partially on AWC. (A) Schematic of AIA interneuron. (BD) Calcium signals of AIA neurite in indicated conditions in the WT under a constant temperature stimulus. The YFP/CFP fluorescence ratio, R(t), of AIA was measured and standardized using the minimum fluorescence ratio, Rmin, in each neuron recording. Brown lines depict the average calcium signals in AIA. Error bars are SEM. Black lines indicate average temperature stimuli. Heat maps of calcium signals are shown at the Bottom. Each horizontal bar in the heat map represents a recording from one animal. (E) Violin plots showing quantification of calcium spike frequency per neurite (Left) (n = 30,28,23 neurites); and calcium spike area (Right) (n = 56,112,42 spikes) from data in (BD). Each data point represents one soma. (FK) AIA activity in AWC–, unc-13, and unc-31 animals. (F, H, and J) Heat maps of calcium signals of AIA neurite in indicated conditions in AWC-ablated animals, unc-13 mutants, and unc-31 mutants, respectively, under a constant temperature stimulus. Measurement standardization is the same as in (BD). (G, I, and K) Quantification of calcium spike frequency per neurite (Left) and calcium spike area (Right) ((G): AWC– spike frequency: n = 20,16,22 neurites; AWC– spike area: n = 12,40,30 spikes; (I): unc-13 spike frequency: n = 21,15,5 neurites; unc-13 spike area: n = 101,55,4 spikes and (K): unc-31 spike frequency: n = 22,23,13 neurites; unc-31 spike area: n = 1,32,20 spikes) from data in (F, H, and J) respectively. WT data are the same as in (E). Statistical analysis was done using the Kruskal–Wallis test followed by a post hoc Steel–Dwass test to compare within a genotype. Different alphabets depict significant differences. A post hoc Steel test was used for corresponding comparisons with control within a condition, as represented by the distinct asterisk colors. *P ≤ 0.05, **P ≤ 0.01, ***P ≤0.001, and ns indicates not significant (P > 0.05).
Fig. 6.
Fig. 6.
Model of age- and diet-dependent thermotaxis decline. AWC and AIA neurons, dispensable for thermotaxis in young animals, become hyperactive and interfere with the primary thermosensory circuit in aged animals. Feeding animals with L. reuteri ameliorates age-dependent thermotaxis decline possibly through suppressing the AWC and AIA hyperactivity.

Similar articles

Cited by

References

    1. Taoufik E., Kouroupi G., Zygogianni O., Matsas R., Synaptic dysfunction in neurodegenerative and neurodevelopmental diseases: An overview of induced pluripotent stem-cell-based disease models. Open Biol. 8, 180138 (2018). - PMC - PubMed
    1. Anastacio H. T. D., Matosin N., Ooi L., Neuronal hyperexcitability in Alzheimer’s disease: What are the drivers behind this aberrant phenotype? Transl. Psychiatry 12, e257 (2022). - PMC - PubMed
    1. Simkin D., et al. , Aging-related hyperexcitability in CA3 pyramidal neurons is mediated by enhanced A-Type K+ channel function and expression. J. Neurosci. 35, 13206–13218 (2015). - PMC - PubMed
    1. Lee H., Wang Z., Zeger S. L., Gallagher M., Knierim J. J., Heterogeneity of age-related neural hyperactivity along the CA3 transverse axis. J. Neurosci. 41, 663–673 (2021). - PMC - PubMed
    1. Petrella J. R., et al. , Cortical deactivation in mild cognitive impairment: High-field-strength functional MR imaging. Radiology. 245, 224–235 (2007). - PubMed

MeSH terms

Substances

LinkOut - more resources