. 2025 Jan 7;122(1):e2421280121.
doi: 10.1073/pnas.2421280121. Epub 2024 Dec 31.

Higher-order transient structures and the principle of dynamic connectivity in membrane signaling

Affiliations

Higher-order transient structures and the principle of dynamic connectivity in membrane signaling

Yuxi Zhang et al. Proc Natl Acad Sci U S A. .

Abstract

We examine the role of higher-order transient structures (HOTS) in M2R regulation of GIRK channels. Electron microscopic membrane protein location maps show that both proteins form HOTS that exhibit a statistical bias to be near each other. Theoretical calculations and electrophysiological measurements suggest that channel activity is isolated near larger M2R HOTS. By invoking weak interactions that permit transient binding of M2R to M2R and GIRK to GIRK (i-i interactions) and M2R to GIRK (i-j interactions), the distribution patterns and electrophysiological properties of HL-1 cells are replicated in a reaction-diffusion simulation. We propose the principle of dynamic connectivity to explain communication between protein components of a membrane signaling pathway. Dynamic connectivity is mediated by weak, transient interactions between proteins. HOTS created by weak i-i interactions, and statistical biases created by weak i-j interactions promoted by the multivalence of HOTS, are the key elements of dynamic connectivity.

Keywords: GPCR; HOTS; higher-order transient structure; membrane signaling; self-assembly.


Conflict of interest statement

Competing interests statement:The authors declare no competing interest.

Figures
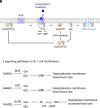
Fig. 1.
Fig. 1.
Coexisting signaling pathways in the HL-1 cell plasma membrane. (A) Schematic of the M2R-GIRK channel signaling pathway in HL-1 cell membranes. (B) M2R, A1R, and β1AR pathways in HL-1 cell membranes. Both M2R and A1R activate GIRK by releasing free Gβγ and thus hyperpolarize the membrane, which slows heart rate. Gαs(GTP) generated by β1AR activates AC, which synthesizes cAMP. cAMP facilitates HCN channel opening, which depolarizes the membrane and increases heart rate.
Fig. 2.
Fig. 2.
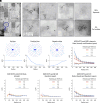
Detection of a spatial bias between membrane protein HOTS. (A) A representative M2R (18 nm) and GIRK (6 nm) double-labeled electron microscope montage of an unroofed HL-1 cell. The dashed perimeter outlines the boundary of the membrane. An example of an M2R-GIRK cocluster is shown in the magnifying glass. The region in the white square is addressed in Fig. 4. (Scale bars: 5 μm.) (B) Representative negative stain electron micrographs with double-labeled M2R (18 nm) and GIRK (6 nm) in HL-1 cells. Top row: Example of M2R and GIRK HOTS that do not colocalize. Bottom row: Example of M2R-GIRK coincident HOTS. Only 4% of GIRK channels colocalize with M2R HOTS (i.e., when the distance between the GIRK channel and M2R cluster centroids is less than 150 nm.). (Scale bars: 100 nm.) (C) Schematic of the Landmark Correlated Particle Index (LCPI) analysis used in panels (DF) (16). LCPI = (fraction of total protein inside a circle)/(fraction of unroofed membrane area inside a circle). Dark blue central filled circles represent M2R HOTS centroids. Light blue dots represent other proteins. LCPI as a function of circle radius generated in each case is shown in the Lower panel. (D) LCPI analysis for M2R HOTS and GIRK channels (closed symbols) or randomly distributed GIRK channels (open symbols) in HL-1 cells. Different colors correspond to different M2R HOTS sizes. (In the randomized case, an equal number of GIRK channels are randomly distributed in the unroofed membrane.) Symbols show mean and SE from 17 electron microscope montages. (E) LCPI analysis as in panel (D) for M2R HOTS and β1AR (Left) or randomly distributed β1AR (Right) in HL-1 cells. Symbols show means and SE from 10 electron microscope montages. (F) LCPI analysis as in panel (D) for M2R HOTS and A1R (closed symbols) or randomly distributed A1R (open symbols) in HL-1 cells. Symbols show mean and SE from 13 electron microscope montages.
Fig. 3.
Fig. 3.
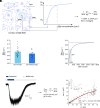
Calculating the Gβγ field in plasma membrane sheets. (A) Depiction of the system for solving the steady-state diffusion equation. The central blue circle represents an M2R source. G-protein trimers are assumed present at a constant concentration. Free Gβγ (red circle) [and Gαi(GTP), not shown] generated at the source diffuses until it recombines with Gαi(GDP) (yellow circle), the hydrolysis product of Gαi(GTP). The diffusion equation, ·DCr-k Cr=0, in which D and k are the diffusion coefficient and disappearance rate constant for Gβγ, is solved for the concentration of Gβγ at distance r subject to a near gradient boundary condition on a circular perimeter near the source: Gβγ satisfies DGβγGβγ ds=rate of Gβγ production and a far boundary condition is set by Gβγ=0 at r=2.0 μm. We assume rate of Gβγ production=10 s1 (18), lifetime 2.0 s (20, 21), and diffusion coefficient 0.15 μm2/s (19). (B) Calculated steady-state 2-dimensional Gβγ concentration profile generated by a single M2R. Parameters are as described in panel (A). Gβγ concentration is high near M2R and decays with distance from the source. (C) Steady-state Gβγ concentration generated by a single M2R (red) and a HOTS containing 6 M2R (blue). (D) The Gβγ field generated from the M2R-GIRK double-labeled montage in Fig. 2A. The Gβγ field was calculated from the coordinates of M2R HOTS centroids and HOTS sizes using the parameters and equation described in panel (A), with source rate proportional to n, the number of M2Rs inside a HOTS. Color and the z coordinate indicate the concentration of free Gβγ generated by activated M2R. (Scale bars: 5 μm.) (E) The hypothetical Gβγ field generated for the montage in Fig. 2A after M2R is randomly redistributed over the membrane.
Fig. 4.
Fig. 4.
Comparing calculated open probability densities from structure maps to electrophysiological measurements. (A) Schematic showing the procedure to predict NPo/μm2 from the Gβγ field. The Gβγ concentration contour plot with 15 levels generated for the square region in Fig. 2A is shown (Left). GIRK channels in the M2R-GIRK double-labeled electron micrographs are assigned a Gβγ concentration based on their position in the Gβγ field. The open probability (Poi) of each (ith channel) in the field was calculated from the concentration dependence of GIRK channel activation (Right), summed, and divided by the measured membrane area to estimate NPo/Area (Materials and Methods). (B) Open probability density, NPo/Area (μm-2), calculated from electron micrograph montages from HL-1 cells as described in the text and in panel (A). Symbols show individual outcomes from 17 montages (symbols) with bar height and error bars showing the mean and SE (0.089 ± 0.009 μm−2) from the 17 montages (Left). Open probability density, NPo/Area (μm−2), calculated from electrophysiological current and membrane capacitance measurements on HL-1 cells as shown below. Symbols show outcomes from nine cells (symbols) with bar height and error bars showing the mean and SE (0.075 ± 0.010 μm−2) from the nine cells (Right). (C) Cumulative open probability density plot generated from electron micrograph montages. Channels from 17 montages were ordered in a list according to their calculated open probability, from highest to lowest. A graph of the cumulative sum of open probabilities in the list (divided by the total montage area) shows that most of the open probability density comes from a small fraction of the total GIRK channels. (D) A representative whole-cell trace showing the current response of GIRK channels to M2R activation by carbachol and expression to calculate NPo/Area. Carbachol was applied at 10 μM and then removed by perfusion. Voltage was held at –60 mV. Buffer conditions are described in Materials and Methods. The mean and SE from nine current traces are shown. Ccell is the measured cell capacitance and Cspec = 0.009 pF/μm². (E) Current variance, varI, and mean current, I, were measured from traces like those in panel (D). In the graph, varI is plotted as a function of I from the trace in (D) (symbols). The current signal was low pass filtered at 1 kHz and digitized at 10 kHz. varI and I are calculated for every 3,000 nonoverlapping data points. The red curve corresponds to the function varI=iI-I2N (24). The single channel current i (~1.0pA) was measured independently and therefore the function contains a single free parameter, N, the number of channels activated by carbachol application. Capacitance measurements on the same cell permit calculation of membrane area. N divided by the membrane area gives the density of activated channels, N/Area (μm−2). The chi-square plot (Inset) for this cell shows a minimum value for N/Area ~0.23 μm−2. The mean and SE of measurements in nine cells is 0.32 ± 0.04 μm−2.
Fig. 5.
Fig. 5.
The calculated effect of HOTS and spatial bias on open probability density. Open probability density, NPo/Area (μm−2), calculated from electron micrograph montages from HL-1 cells as shown in Fig. 4B (light blue). NPo/Area (μm−2) calculated from hypothetical Gβγ fields generated from the montages after the positive bias is removed (dark blue). Positive bias is the bias between M2R HOTS and GIRK channels. To remove the positive bias, the positions of M2R HOTS were randomized on the membrane without changing the HOTS size distribution. NPo/Area (μm−2) was calculated from hypothetical Gβγ fields generated from montages after M2R (orange) or GIRK (red) or both proteins (dark red) were randomly redistributed on the membrane. Symbols show individual outcomes from 17 montages with bar height and error bars showing the mean and SE (0.089 ± 0.009 μm−2, 0.060 ± 0.008 μm−2, 0.030 ± 0.004 μm−2, 0.059 ± 0.007 μm−2, and 0.030 ± 0.004 μm−2, respectively, from Left to Right) from the 17 montages.
Fig. 6.
Fig. 6.
Simulating the M2R-GIRK pathway to assess the role of i-i and i-j interactions. (A) Schematic of the simulation with blue, red, and yellow circles representing M2R, GIRK channel, and coincident HOTS; circle size proportional to the number of proteins in a HOTS or coincident HOTS. In the simulation, the total M2R density is 2 μm−2 and total GIRK density 3 μm−2, near those measured in HL-1 cells (1.94 ± 0.13 μm−2 for M2R and 2.82 ± 0.26 μm−2 for GIRK using 18 nm and 6 nm gold labels, respectively). In the first frame of the simulation, particles representing proteins were distributed randomly. Particles diffuse with a diffusion coefficient of 0.1 μm2/s. M2R and GIRK can each self-assemble reversibly to form HOTS and with each other to form coincident HOTS. Details of the diffusion process and conditions under which an oligomerization reaction occurs between nearby proteins is described in Materials and Methods. Particle distributions were first analyzed after 20,000 simulation steps and then analyzed every 5,000 steps. (B and C) Normalized (meaning sum of probabilities equals 1.0) M2R or GIRK HOTS size distributions in HL-1 cell double-labeled montages or in the simulation. Data represent means and SE from 17 electron micrograph montages or 11 independent simulations. (D) Open probability density, NPo/Area (μm−2), calculated from electrophysiological current or electron micrograph montages from HL-1 cells as in Fig. 4B. Symbols show individual outcomes from nine cells (symbols) or 17 montages (symbols) with bar height and error bars showing the mean and SE (0.075 ± 0.010 μm−2 and 0.089 ± 0.009 μm−2) from the nine cells (Left) and 17 montages (Middle). Open probability density, NPo/Area (μm−2), calculated from simulations. The Gβγ field was calculated for each simulation as described in Fig. 3D. Open probability density was then calculated as described in Fig. 4A. Symbols show individual outcomes from 11 simulations (symbols) with bar height and error bars showing the mean and SE (0.086 ± 0.012 μm−2) from the 11 simulations (Right). (E) Open probability density, NPo/Area (μm−2) calculated from simulations at different conditions. i-i refers to self (i.e., M2R-M2R and GIRK-GIRK) interactions and i-j refers to nonself (i.e., M2R-GIRK) interactions. To remove i-i M2R, i-i GIRK or i-j M2R-GIRK interactions, the corresponding association probability (Materials and Methods) was set to zero. The Gβγ field was calculated for each simulation, and open probability density then calculated from the Gβγ field. Symbols show individual outcomes from 11 simulations with bar height and error bars showing the mean and SE (0.086 ± 0.012 μm−2, 0.044 ± 0.003 μm−2, 0.018± 0.001 μm−2, 0.046 ± 0.003 μm−2, 0.016 ± 0.0004 μm−2, 0.017 ± 0.001 μm−2, 0.065 ± 0.005 μm−2 and 0.017 ± 0.001 μm−2, respectively, from Left to Right) from the 11 simulations.

Similar articles

Cited by

References

    1. Zhang Y., et al. , Higher-order transient membrane protein structures. Proc. Natl. Acad. Sci. U.S.A. 121, e2421275121 (2024). - PMC - PubMed
    1. Touhara K. K., MacKinnon R., Molecular basis of signaling specificity between GIRK channels and GPCRs. Elife 7, e42908 (2018). - PMC - PubMed
    1. Hilger D., Masureel M., Kobilka B. K., Structure and dynamics of GPCR signaling complexes. Nat. Struct. Mol. Biol. 25, 4–12 (2018). - PMC - PubMed
    1. Logothetis D. E., Kurachi Y., Galper J., Neer E. J., Clapham D. E., The beta gamma subunits of GTP-binding proteins activate the muscarinic K+ channel in heart. Nature 325, 321–326 (1987). - PubMed
    1. Sakmann B., Noma A., Trautwein W., Acetylcholine activation of single muscarinic K+ channels in isolated pacemaker cells of the mammalian heart. Nature 303, 250–253 (1983). - PubMed

MeSH terms

Substances

LinkOut - more resources