. 2025 Jan 7;122(1):e2411833122.
doi: 10.1073/pnas.2411833122. Epub 2024 Dec 31.

Molecular basis of hemoglobin binding and heme removal in Corynebacterium diphtheriae

Affiliations

Molecular basis of hemoglobin binding and heme removal in Corynebacterium diphtheriae

Brendan J Mahoney et al. Proc Natl Acad Sci U S A. .

Abstract

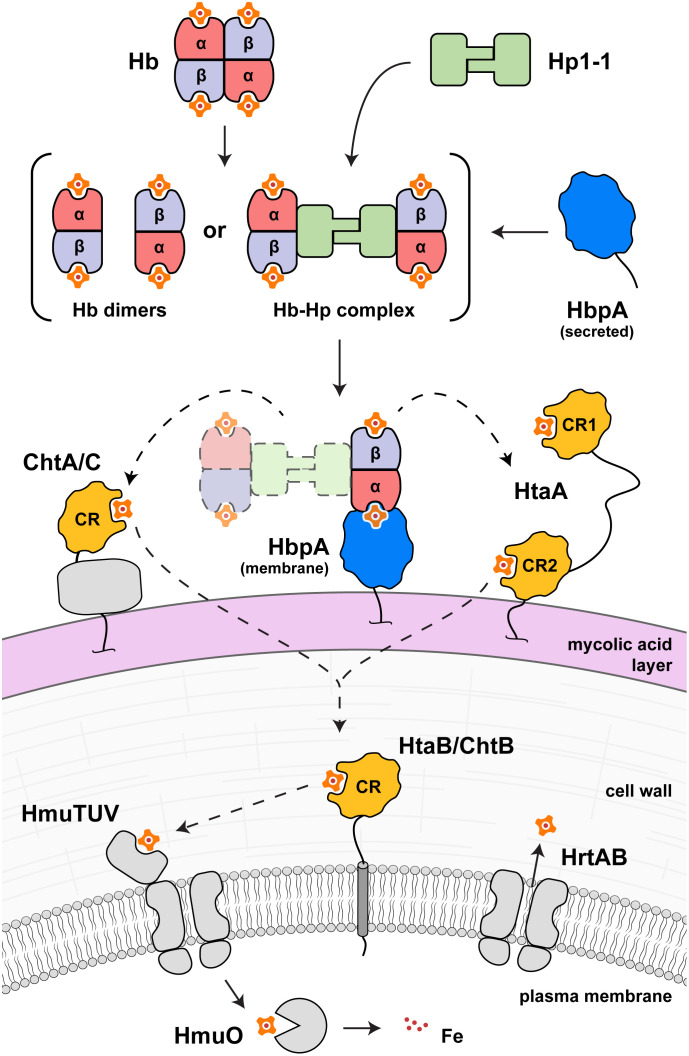
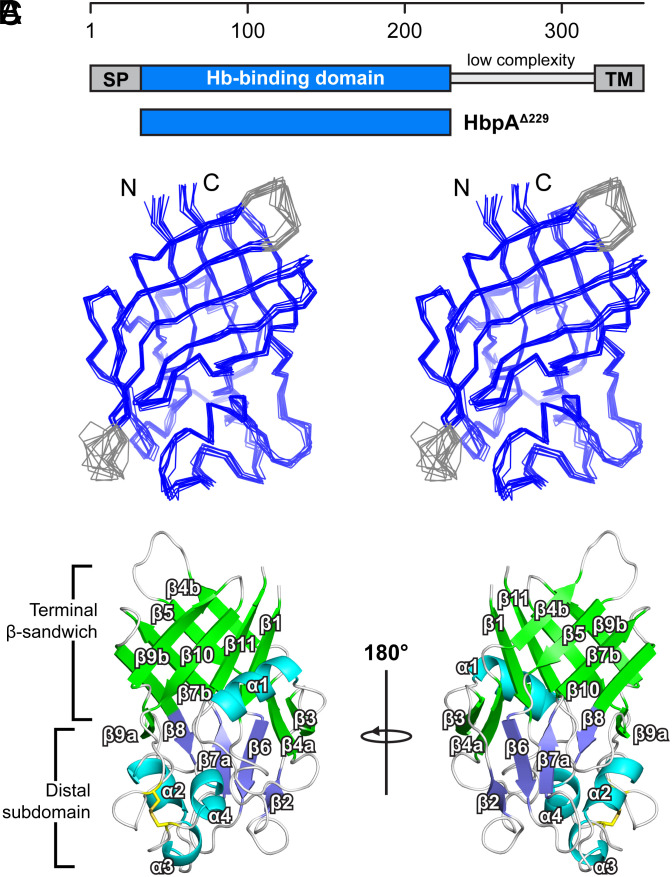
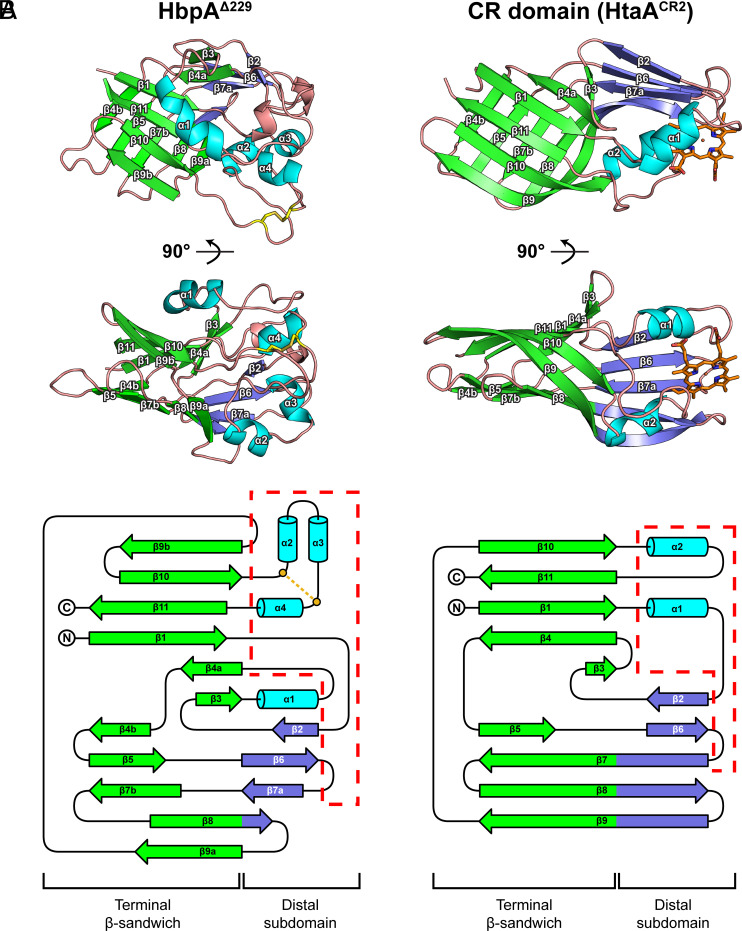
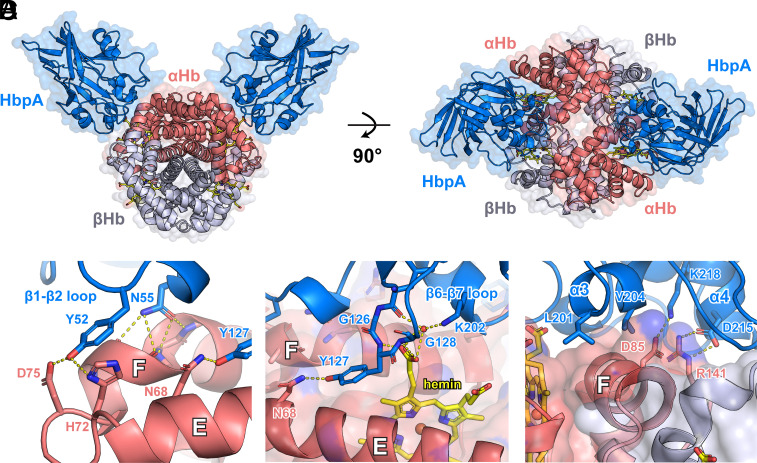
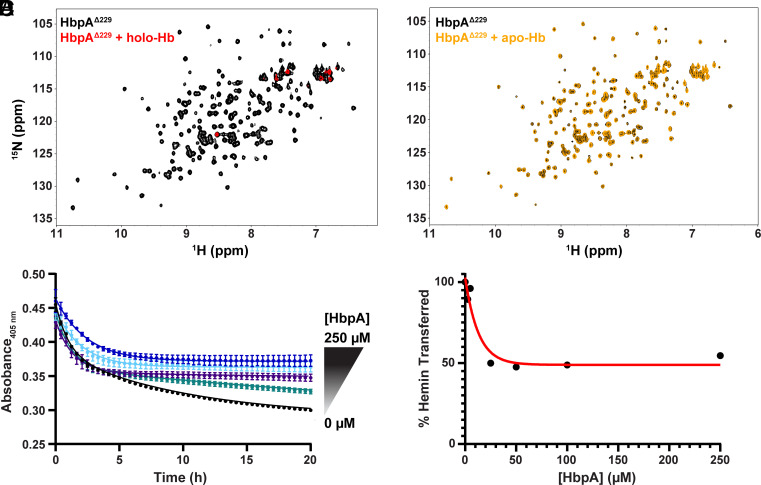
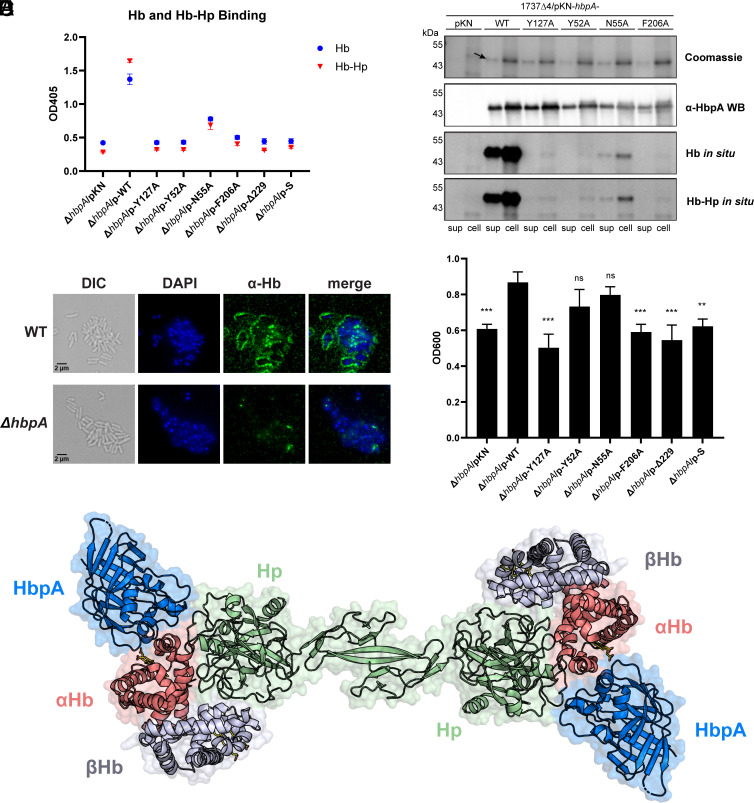
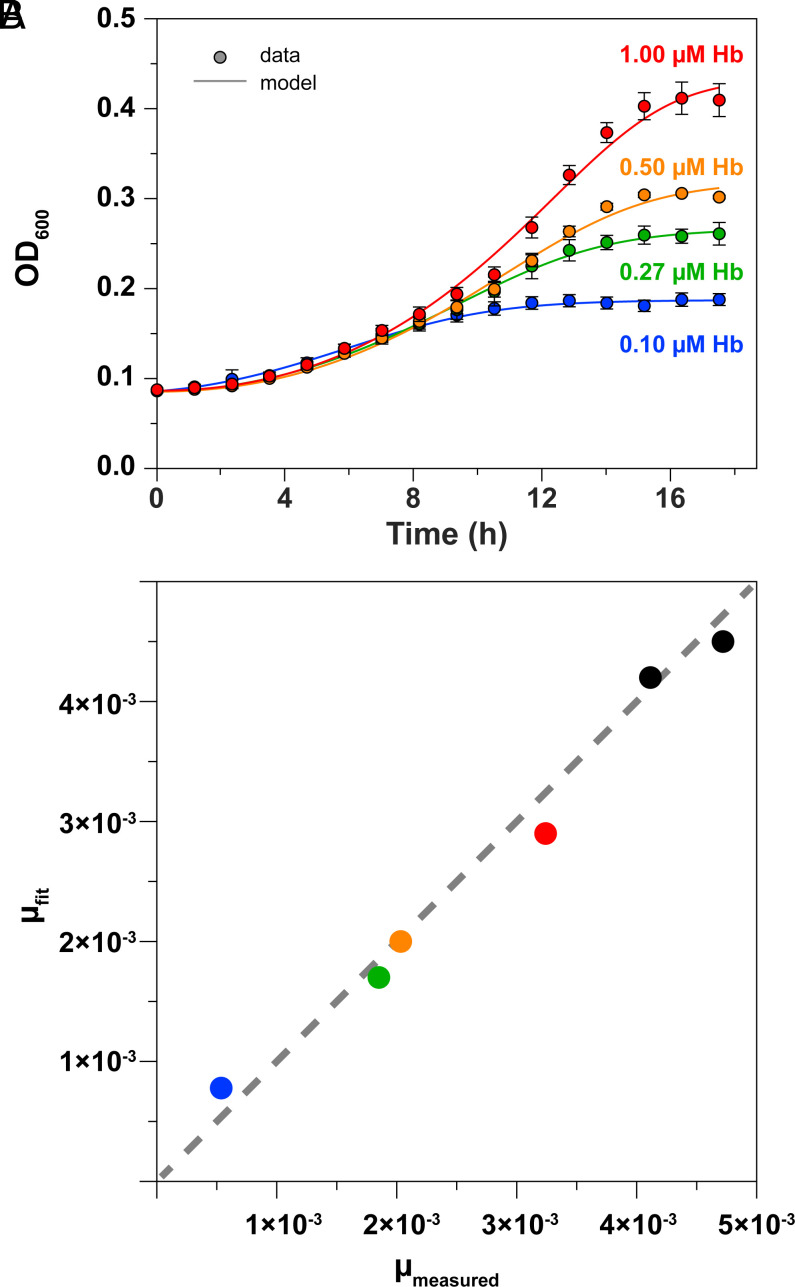
To successfully mount infections, nearly all bacterial pathogens must acquire iron, a key metal cofactor that primarily resides within human hemoglobin. Corynebacterium diphtheriae causes the life-threatening respiratory disease diphtheria and captures hemoglobin for iron scavenging using the surface-displayed receptor HbpA. Here, we show using X-ray crystallography, NMR, and in situ binding measurements that C. diphtheriae selectively captures iron-loaded hemoglobin by partially ensconcing the heme molecules of its α subunits. Quantitative growth and heme release measurements are compatible with C. diphtheriae acquiring heme passively released from hemoglobin's β subunits. We propose a model in which HbpA and heme-binding receptors collectively function on the C. diphtheriae surface to capture hemoglobin and its spontaneously released heme. Acquisition mechanisms that exploit the propensity of hemoglobin's β subunit to release heme likely represent a common strategy used by bacterial pathogens to obtain iron during infections.

Keywords: NMR; X-ray crystallography; bacterial growth; heme capture; hemoglobin.


Conflict of interest statement

Competing interests statement:The authors declare no competing interest.

Figures

Fig. 1.
Fig. 1.
Schematic of C. diphtheriae hemin acquisition pathway. Upon release from red blood cells, tetrameric Hb rapidly dissociates into metHb dimers. Hemin passively released from the β subunit of metHb (or metHb–Hp) bound to HbpA is captured by surface-exposed CR domain-containing receptors ChtA, ChtC, or HtaA. Hemin is then relayed to the HmuTUV integral membrane ABC transporter, presumably involving transfer via HtaB or ChtB, and degraded by the heme oxygenase HmuO. Excess hemin is exported by the HrtAB efflux pump. Only the Hp1-1 form of Hp is shown. Also shown in the figure are secreted forms of the HbpA receptor that bind metHb and the metHb–Hp complex.
Fig. 2.
Fig. 2.
NMR structure of HbpA. (A) Domain schematic of the HbpA Hb receptor, with its signal peptide (SP) and single TM helix indicated. A region of low amino acid sequence complexity connects the TM helix to the structured domain that binds to Hb (residues 33 to 229, HbpAΔ229). (B) Stereo view showing the ensemble of 10 lowest energy NMR structures of HbpAΔ229. The N and C termini are indicated, and the partially disordered β5-β6 and β6-β7 loops are colored gray. (C) Cartoon depiction of HbpAΔ229, with two views shown that are related by a 180° rotation. Secondary structure elements are labeled with α-helices colored cyan. Residues forming the β-sandwich in the terminal subdomain are colored green and residues forming the β-sheet in the distal subdomain are colored slate. The disulfide bond (C182-C211) is shown as stick representation in yellow.
Fig. 3.
Fig. 3.
HbpA and CR domains within the hemin-uptake system are structurally related. (A) Two views of HbpAΔ229 related by a 90° rotation (Left) and similar views of the hemin-binding C-terminal CR domain from the C. diphtheriae HtaA protein (HtaACR2, PDB: 8SMU) (Right) (33). The largest structural differences occur in regions responsible for hemin binding in CR domains. (B) Secondary structure topology diagrams of HbpAΔ229 (Left) and HtaACR2 (Right). The proteins are constructed from “terminal” and “distal” subdomains. Color code: the β-strands in the terminal subdomain (green), strands in the β-sheet within the distal subdomain (slate), α-helices (cyan), and disulfide bond (gold). Regions in HtaACR2 involved in hemin binding are enclosed within a dashed red box. The analogous region in HbpAΔ229 mediates binding to metHb in the crystal structure of the complex described later (dashed red box).
Fig. 4.
Fig. 4.
Structure of the HbpA complex with hemoglobin. (A) Crystal structure of HbpA bound to human Hb reveals two receptors bind to the metHb tetramer, each partially capping the hemin molecule located within the tetramer’s α subunits. (B) Magnified view of interactions between HbpA β1 and β2 loop and the EF region of αHb at the edge of the protein–protein interface. The E and F helices of αHb are indicated. (C) View of interactions between HbpA’s β6 and β7 loop and a hemin propionate group at the HbpA–αHb interface. (D) Residues in HbpA’s α3 and α4 helices bind over the αHb F-helix via a combination of van der Waals packing and salt bridge interactions.
Fig. 5.
Fig. 5.
HbpA binding to holo-Hb and its effects on in vitro hemin release. (A) Overlay of 1H-15N HSQC spectra of [U-15N] HbpAΔ229 in the presence (red) or absence (black) of holo-Hb. The loss of signals upon adding holo-Hb is indicative of binding. In the experiment the carboxyhemoglobin (HbCO) form of Hb was used at a fourfold molar excess (200 µM, heme basis) relative to the receptor (50 µM). (B) As in panel (A) except the spectra show [U-15N] HbpAΔ229 (50 µM) in either the presence (orange) or absence (black) of apo-Hb (200 µM, globin basis). The lack of significant spectral changes suggests that the receptor does not bind to apo-Hb with significant affinity. (C) Experiments monitoring hemin release from the ferric form of Hb (metHb) and subsequent capture by apo-MbH64Y/V68F. Spectral time courses show the change in the metHb Soret band absorbance (405 nm) after mixing with apo-MbH64Y/V68F. The amount of HbpAΔ229 was varied: 0 (black), 5 (green), 25 (purple), 100 (light blue), or 250 µM (dark blue) HbpAΔ229. Lines represent the exponential decay equation to which the data was fit, and error bars reflect the SD obtained from three replicates. Control experiments confirm that the absorbance changes are caused by hemin release from metHb and are not a result of HbpAΔ229 binding to either Hb or Mb (SI Appendix, Fig. S6 B and C). (D) Percent of hemin transferred as a function of HbpAΔ229 concentration. The % hemin transferred was determined by taking the ratio of ΔA405 at each HbpAΔ229 concentration to the ΔA405 in the absence of HbpAΔ229. Error bars representing the SE calculated by propagation of uncertainty are present but are too small to be observed at this scale. At saturating HbpAΔ229 concentrations, only 50% of the metHb-hemin molecules are released.
Fig. 6.
Fig. 6.
Receptor mutations impair C. diphtheriae’s ability to capture the Hb–Hp complex. (A) Binding of C. diphtheriae cells to Hb (blue) and the Hb–Hp complex (red). Cell-based ELISA was used to detect protein binding to ΔhbpA cells expressing receptor variants from plasmid pKN2.6Z as previously described (52). pKN plasmids expressed: wild-type HbpA (ΔhbpA/p-WT), single amino acid variants (ΔhbpA/p-Y127A, Y52A, N55A, or F206A), only the Hb-binding domain (ΔhbpA/p-Δ229), or the full-length protein lacking its TM-helix (ΔhbpA/p-S). (B) Results of in situ gel binding of bacterial extracts to either Hb or the Hb–Hp complex. Cells were separated into supernatant fractions (sup, secreted proteins) and cell-associated proteins (cell). The strain used is C. diphtheriae 1737 that contains deletions of hbpA, chtA, chtC, and htaA. This strain also carries the pKN2.6Z plasmid harboring the WT full-length hbpA gene, specific point mutations of hbpA, or the empty vector (pKN). The four panels from Top to Bottom show the Coomassie stain, western blot with an anti-HbpA antibody, and in situ binding with Hb or with Hb–Hp followed by western blot with an anti-Hb or anti-Hp antibody, respectively. (C) Microscopy of wild-type C. diphtheriae strain 1737 (WT) (Top) and ΔhbpA (Bottom) C. diphtheriae cells. The figure shows images obtained using differential interference contrast (DIC) (Left), DAPI and α-Hb (Alexa Fluor 488) fluorescence (Middle), and a merge of the fluorescence images (Right). (D) Growth of C. diphtheriae ΔhbpA complemented with HbpA variant plasmids in iron-deplete media that contains the Hb–Hp complex as the sole iron source. For the determination of statistical significance, the growth levels of the mutants and the vector control were compared to the WT strain. Results show the mean and SD from at least three experiments, with statistical significance calculated using unpaired t tests; ***P < 0.001; **P < 0.005; ns, no significant difference. (E) Model of HbpA’s interaction with Hb–Hp complex, constructed using the coordinates of our HbpA–Hb structure (PDB: 9BCJ) and the structure of the Hb–Hp complex (PDB: 4WJG) (51).
Fig. 7.
Fig. 7.
C. diphtheriae scavenges hemin that is spontaneously released from Hb. (A) Growth experimental data vs. model predictions for C. diphtheriae grown on Hb. Experimental OD600 time points (circles) and model fit curves (solid lines) shown for Hb substrate concentrations of 0.10 µM (blue), 0.27 µM (green), 0.50 µM (orange), and 1.00 µM (red) (hemin units). Error bars show the SD obtained from three replicates. (B) Linear correlation plot of experimentally measured specific growth rates (µmeasured) vs. the specific growth rates extracted from growth models assuming passive hemin release from Hb (µfit). The data and model are in good agreement (slope = 0.965, R2 = 0.997). Modeling parameters are described in SI Appendix, Table S6, and sensitivity analysis of the parameters used to fit the growth data is presented in SI Appendix, Table S7.

Similar articles

Cited by

  • 'Intelligent' proteins.
    Tripathi T, Uversky VN, Giuliani A. Tripathi T, et al. Cell Mol Life Sci. 2025 Jun 14;82(1):239. doi: 10.1007/s00018-025-05770-1. Cell Mol Life Sci. 2025. PMID: 40515853 Free PMC article. Review.

References

    1. Class W. J., Clinical significance of the different forms of the Klebs-Loeffler bacillus. J. Am. Med. Associat., 1019–1020 (1898).
    1. Schmitt M. P., “Iron acquisition and iron-dependent gene expression in Corynebacterium diphtheriae” in Corynebacterium Diphtheriae and Related Toxigenic Species: Genomics, Pathogenicity and Applications, Burkovski A., Ed. (Springer Netherlands, 2014), pp. 95–121.
    1. Barksdale L., Corynebacterium diphtheriae and its relatives. Bacteriol. Rev. 34, 378–422 (1970). - PMC - PubMed
    1. Kunkle C. A., Schmitt M. P., Analysis of the Corynebacterium diphtheriae DtxR regulon: Identification of a putative siderophore synthesis and transport system that is similar to the yersinia high-pathogenicity island-encoded Yersiniabactin synthesis and uptake system. J. Bacteriol. 185, 6826–6840 (2003). - PMC - PubMed
    1. Kunkle C. A., Schmitt M. P., Analysis of a DtxR-regulated iron transport and siderophore biosynthesis gene cluster in Corynebacterium diphtheriae. J. Bacteriol. 187, 422–433 (2005). - PMC - PubMed

LinkOut - more resources