. 2025 Jan 7;122(1):e2421275121.
doi: 10.1073/pnas.2421275121. Epub 2024 Dec 31.

Higher-order transient membrane protein structures

Affiliations

Higher-order transient membrane protein structures

Yuxi Zhang et al. Proc Natl Acad Sci U S A. .

Abstract

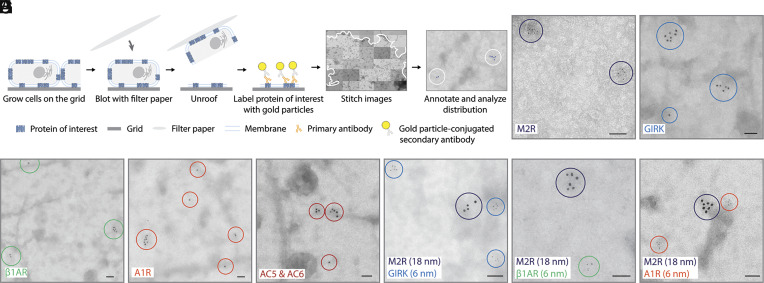
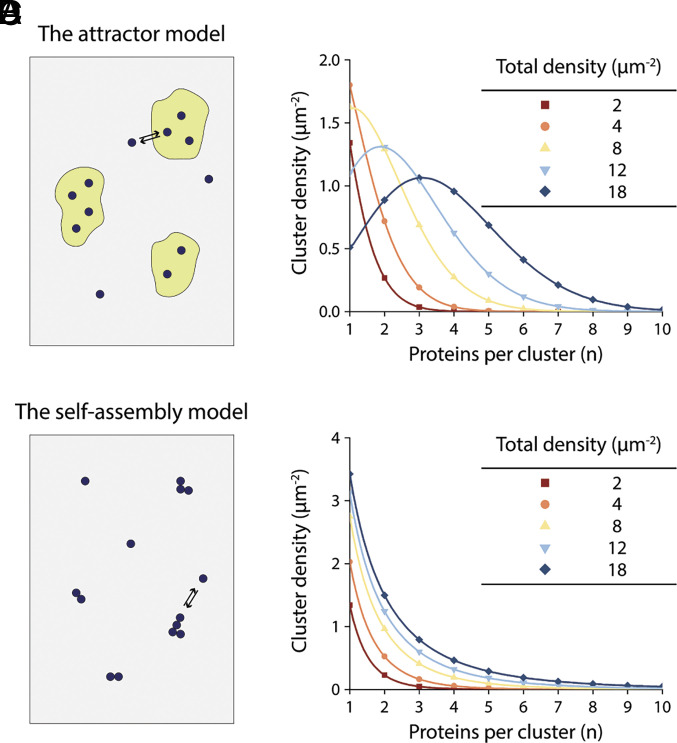
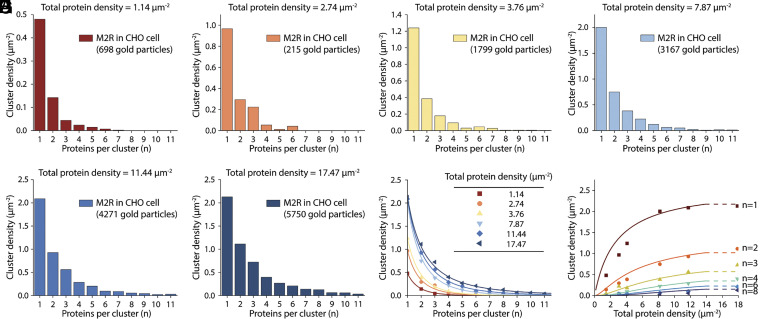
This study shows that five membrane proteins-three GPCRs, an ion channel, and an enzyme-form self-clusters under natural expression levels in a cardiac-derived cell line. The cluster size distributions imply that these proteins self-oligomerize reversibly through weak interactions. When the concentration of the proteins is increased through heterologous expression, the cluster size distributions approach a critical distribution at which point a phase transition occurs, yielding larger bulk phase clusters. A thermodynamic model like that explaining micellization of amphiphiles and lipid membrane formation accounts for this behavior. We propose that many membrane proteins exist as oligomers that form through weak interactions, which we call higher-order transient structures (HOTS). The key characteristics of HOTS are transience, molecular specificity, and a monotonically decreasing size distribution that may become critical at high concentrations. Because molecular specificity invokes self-recognition through protein sequence and structure, we propose that HOTS are genetically encoded supramolecular units.

Keywords: GPCR; HOTS; higher-order transient structure; membrane signaling; self-assembly.


Conflict of interest statement

Competing interests statement:The authors declare no competing interest.

Figures

Fig. 1.
Fig. 1.
HL-1 cells contain β1AR and M2R signaling pathways. (A) Schematic of M2R, A1R, and β1AR signaling pathways in HL-1 cells. (B) Spontaneous calcium oscillations in confluent HL-1 cells are accelerated by isoproterenol and slowed by carbachol. Data are shown as the mean fluorescence over time of Fluo-8 AM loaded cells treated with buffer only, 10 μM isoproterenol or 10 μM carbachol. (C) HL-1 cells have the M2R-GIRK channel signaling pathway. Representative current trace measured in whole-cell mode showing the response of HL-1 cells to 10 μM carbachol. Voltage was held at –60 mV. Buffer conditions are described in Materials and Methods.
Fig. 2.
Fig. 2.
Electron microscope imaging of M2R, GIRK, β1AR, A1R, and AC distributions in HL-1 cells. (A) Schematic depicting the plasma membrane isolation (unroofing), gold particle labeling, and image analysis procedure. The unroofed membrane boundary is indicated by the solid curve. Circles indicate representative protein clusters. (BF) M2R (B), GIRK (C), β1AR (D), A1R (E), and AC (F) all form clusters in HL-1 cells. Representative negative stain electron micrographs of M2R, GIRK, β1AR, A1R, and AC clusters are shown. M2R is labeled with 6 nm gold particles. GIRK, β1AR, A1R, and AC are labeled with 18 nm gold particles. Proteins are indicated by circles. (Scale bar, 100 nm.) (GI) Protein clusters are self-specific. Representative negative stain electron micrographs with double-labeled M2R (18 nm) and GIRK (6 nm) (G), M2R (18 nm) and β1AR (6 nm) (H), and M2R (18 nm) and A1R (6 nm) (I) in HL-1 cells are shown. Circles with different colors indicate different proteins. (Scale bar, 100 nm.)
Fig. 3.
Fig. 3.
Analysis of M2R, GIRK, β1AR, A1R, and AC distributions in cell membranes. (AE) The size distributions of M2R (A), GIRK (B), β1AR (C), A1R (D), and AC (E) clusters in HL-1 cells decrease monotonically with increasing cluster size n. M2R is labeled with 6 nm gold particles. GIRK, β1AR, A1R, and AC are labeled with 18 nm gold particles. The total particle densities are 4.3 µm−2 for M2R, 1.3 µm−2 for GIRK, 1.2 µm−2 for β1AR, 1.1 µm−2 for A1R, and 0.9 µm−2 for AC. For each protein, nonspecific gold particle labeling was estimated from CHO cells without heterologous expression and subtracted using the same reagents. Data represent means and SE from n EM montages: n = 13 for M2R (12,773 gold particles analyzed), n = 15 for GIRK (4,149 gold particles analyzed), n = 11 for β1AR (3,491 gold particles analyzed), n = 12 for A1R (2,636 gold particles analyzed), and n = 5 for AC (1,312 gold particles analyzed). (F) M2R clusters are randomly distributed on the surface of HL-1 cells. Nearest neighbor distance histograms of M2R cluster centroids (gray) and randomly distributed M2R clusters (blue) are shown. Clusters are defined so as to comprise at least three gold particles. Cluster centroids are calculated by averaging the x and y coordinates of all gold particles in each cluster. In the randomized case, the number of generated coordinates matches the number of cluster centroids, and the generated coordinates are randomly distributed over the regions of unroofed cells. (GI) Cluster size distributions of M2R heterologously expressed in PtK2 (G), CHO (H), and HEK (I) cells decrease monotonically. Proteins are labeled with 18 nm gold particles. Nonspecific gold particle labeling was estimated from CHO cells without heterologous expression and subtracted. The total protein densities of M2R in the cell and the numbers of gold particles being analyzed are indicated. Each panel represents the result of one unroofed membrane.
Fig. 4.
Fig. 4.
Cryogenic optical microscope imaging and analysis of the M2R distribution in HL-1 cells. (A) Schematic of the cryogenic optical microscope operating at 8 K. The setup was built to allow the transfer of vitrified biological samples under high vacuum and cryogenic temperature conditions. The microscope operates in polarization detection mode which allows us to resolve the random but fixed polarization states of each individual fluorophore at cryogenic temperature (inset). The number of polarizations per PSF indicates the number of molecules within the diffraction-limited spot. (B, i) Fluorescence image of vitrified, unroofed HL1 cells recorded with the cryo-microscope described in (A). (Scale bar, 10 μm.) (B, ii) Exemplary fluorescence signal within one PSF. The image in B(iii) is a sum of 5,000 frames. (Scale bar, 500 nm.) (B, iii) Having identified the polarization state over time (SI Appendix, Fig. S5D), we generate superresolved images by identifying the coordinates of each polarization state corresponding to a fluorophore. The extent of the spot in each localization represents the localization precision. (Scale bar, 10 nm.) (C) Distribution of the fluorescence intensities within a diffraction-limited PSF. The inset shows a close-up of the histogram tail (N = 4043). (D) Size distribution of the number of molecules per PSF based on the polarization time trace analysis, (N = 3620). (E) Distance histogram showing the distribution of distances between molecules within the diffraction-limited spot, obtained from the two-dimensional superresolved data with localization precision below 1 nm. The main peak of the distribution was fitted with a single Gaussian yielding a mean distance of 5.2 nm as an estimate for the most probable nearest neighbor distance.
Fig. 5.
Fig. 5.
Predicted cluster size distributions of an attractor model and a self-assembly model. (A) Cartoon depicting an attractor model. The membrane is indicated by the gray area. Yellow patches are regions that attract a specific membrane protein. (B) Cluster size distributions for proteins at the indicated total densities predicted by the attractor model. The curves correspond to Eq. 9 in SI Appendix, Appendix 1 with Ka=200μm2, mtot=5.0μm-2, andthectot (μm-2) indicated in the legend. (C) Cartoon depicting the self-assembly model. The membrane is indicated by the gray area. Specific proteins represented as black circles oligomerize reversibly. (D) Cluster size distributions for proteins at the indicated total densities predicted by the self-assembly model described in the main text. Curves correspond to Eq. 5 with ΔGmon tobulk0=-2.0 RT, A0=0.04 μm2, and the ctot (μm-2) in the legend.
Fig. 6.
Fig. 6.
Thermodynamic cycle to determine ΔGmon tonmer0 as a function of ΔGmon tobulk0. The cartoon depicts two distinct paths for the transfer of n monomers to the bulk phase defined as a large sheet of closely packed proteins. The bottom path occurs in two steps with the formation of an intermediate cluster of n protein units. Black and white protein units aid visualization but are statistically indistinguishable.
Fig. 7.
Fig. 7.
Simulated protein oligomers illustrate the self-assembly of membrane protein clusters through self-recognition. (AD) Cluster size distributions of simulated diffusing “proteins” (particles) (SI Appendix, Movie S5) at the indicated total protein densities are shown. The proteins undergo a random walk on a square grid. If a protein has at least one neighbor, it will remain in place with a higher probability (pwait=50) than if it has no neighbor (pwait=1). See Materials and Methods and Mathematica code for details of the simulation and particle binning to generate histograms. (E) The cluster size distributions in panels (AD) (symbols) are fit using Eq. 5 with Eq. 8 (curves) for the total protein densities in the legend. For all curves ΔGmon tobulko=-0.62 RT and A0=0.15, 0.16, 0.18, 0.23 μm2 for the protein densities ctot=2, 4, 10, 20 μm-2, respectively. (F) Cluster densities for n = 1 to 6 from the simulations (symbols) graphed as a function of total protein density (ctot). The curves correspond to Eq. 5 with ΔGmon tobulko=-0.62 RT and A0=0.19 μm2 (curves).
Fig. 8.
Fig. 8.
M2R cluster size distributions in CHO cells correspond to a HOTS self-assembly model. (AF) M2R cluster size distributions in CHO cells expressed to the indicated total protein densities are shown. Proteins were labeled with 18 nm gold particles. Nonspecific gold particle labeling was estimated using CHO cells without heterologous expression and subtracted. Each panel represents the result of one unroofed membrane (one cell). The total numbers of gold particles measured and analyzed are indicated. (G) Cluster size distributions from panels (AF) are shown (symbols). The solid curves correspond to a fit to Eq. 5 constrained by Eq. 8 using the measured total protein densities listed (inset). For all curves ΔGmon tobulk0=-1.82 RT and A0=0.22, 0.13, 0.10, 0.07, 0.08, 0.08 μm2 for the lowest to the highest protein concentrations, respectively. (H) Cluster densities for n = 1 to 8 from data shown in (AF) graphed as a function of measured total protein density (ctot). The curves correspond to Eq. 5 with ΔGmon tobulk0=-1.82 RT and A0=0.08 μm2.
Fig. 9.
Fig. 9.
The HOTS size distribution of M2R in HL-1 cells. (A) The cluster size distribution of M2Rs labeled with 6 nm gold particles in HL-1 cells (symbols) is fit to Eq. 5 constrained by Eq. 8, yielding ΔGmon tobulk0=-1.24 RT and A0=0.58 μm2 (curve). Nonspecific gold particle labeling was estimated from CHO cells without heterologous expression and subtracted. Data represent mean and SE from 13 electron microscope montages. (B) Representative negative stain electron micrograph of a larger M2R cluster in HL-1 cells. Proteins are labeled with 6 nm gold particles. (Scale bar, 100 nm.)

Similar articles

Cited by

References

    1. Weis W. I., Kobilka B. K., The molecular basis of G protein-coupled receptor activation. Annu. Rev. Biochem. 87, 897–919 (2018). - PMC - PubMed
    1. Hilger D., Masureel M., Kobilka B. K., Structure and dynamics of GPCR signaling complexes. Nat. Struct. Mol. Biol. 25, 4–12 (2018). - PMC - PubMed
    1. Gurevich V. V., Gurevich E. V., Biased GPCR signaling: Possible mechanisms and inherent limitations. Pharmacol. Ther. 211, 107540 (2020). - PMC - PubMed
    1. Calebiro D., Koszegi Z., Lanoiselee Y., Miljus T., O’Brien S., G protein-coupled receptor-G protein interactions: A single-molecule perspective. Physiol. Rev. 101, 857–906 (2021). - PubMed
    1. DiFrancesco D., Pacemaker mechanisms in cardiac tissue. Annu. Rev. Physiol. 55, 455–472 (1993). - PubMed

Grants and funding

LinkOut - more resources