. 2025 Jan 7;122(1):e2414321121.
doi: 10.1073/pnas.2414321121. Epub 2024 Dec 31.

RAP-2 and CNH-MAP4 Kinase MIG-15 confer resistance in bystander epithelium to cell-fate transformation by excess Ras or Notch activity

Affiliations

RAP-2 and CNH-MAP4 Kinase MIG-15 confer resistance in bystander epithelium to cell-fate transformation by excess Ras or Notch activity

Razan A Fakieh et al. Proc Natl Acad Sci U S A. .

Abstract

Induction of cell fates by growth factors impacts many facets of developmental biology and disease. LIN-3/EGF induces the equipotent vulval precursor cells (VPCs) in Caenorhabditis elegans to assume the 3˚-3˚-2˚-1˚-2˚-3˚ pattern of cell fates. 1˚ and 2˚ cells become specialized epithelia and undergo stereotyped series of cell divisions to form the vulva. Conversely, 3˚ cells are relatively quiescent and nonspecialized; they divide once and fuse with the surrounding epithelium. 3˚ cells have thus been characterized as passive, uninduced, or ground state. Based on our previous studies, we hypothesized that a 3˚-promoting program would confer resistance to cell fate-transformation by inappropriately activated 1˚ and 2˚ fate-promoting LET-60/Ras and LIN-12/Notch, respectively. Deficient MIG-15/CNH-MAP4 Kinase meets the expectations of genetic interactions for a 3˚-promoting protein. Moreover, endogenous MIG-15 is required for expression of a fluorescent biomarker of 3˚ cell fate, is expressed in VPCs, and functions cell autonomously in VPCs. The Ras family small GTPase RAP-2, orthologs of which activate orthologs of MIG-15 in other systems, emulates these functions of MIG-15. However, gain of RAP-2 function has no effect on patterning, suggesting its activity is constitutive in VPCs. The 3˚ biomarker is expressed independently of the AC, raising questions about the cellular origin of 3˚-promoting activity. Activated LET-60/Ras and LIN-12/Notch repress expression of the 3˚ biomarker, suggesting that the 3˚-promoting program is both antagonized by as well as antagonizes 1˚- and 2˚- promoting programs. This study provides insight into developmental properties of cells historically considered to be nonresponding to growth factor signals.

Keywords: ACDS-10; LET-60; LIN-12; Rap2; citron NIK1 homology.


Conflict of interest statement

Competing interests statement:The authors declare no competing interest.

Figures
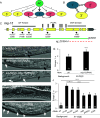
Fig. 1.
Fig. 1.
MIG-15 antagonizes 1˚- and 2˚-promoting signals. (A) A schematic of cell fate patterning of the equipotent VPCs, P3.p-P8.p, to assume the A-P pattern of 3˚−3˚−2˚−1˚−2˚−3˚. (B) A conceptual representation of mutual antagonism between 1˚ and 2˚ cell fate-promoting signaling systems extended hypothetically to include 3˚ cell fate. This model assumes 3˚ fate is actively promoted and not passive. (C) A schematic of the mig-15 gene structure. The encoded S/T Kinase, proline-rich region, and CNH domains are depicted above the model, with the position of individual PxxP sequences indicated. Mutations used in this study are shown, with approximate scale location, below the gene model with accompanying coding changes in amino acids. mu327, rh148, and mu342 alter residues in the kinase domain and rh326 and rh80 are nonsense alleles. The green line indicates the gk5002 allele with mig-15 coding sequences replaced by a myo-2p>nls-gfp cassette. The dotted red line indicates sequences cloned for the Ahringer bacterially mediated RNAi library. (DF) DIC images of late L4 stage normal vulva (black arrow) and ectopic 1˚ pseudovulvae (white arrows). (D) wild type, (E) let-60(n1046gf[G13E]) gain of function grown on control RNAi. (F) let-60(n1046gf[G13E]) animal grown on mig-15-directed RNAi. Black arrows point to invagination of the normally induced vulva; white arrows to ectopic pseudovulvae. (G) Quantitation of increased ectopic 1˚ cells in response to growth on mig-15(RNAi) relative to control RNAi. (H and I) DIC images of ectopic 2˚ cells in lin-12(n379d) animals at the late L4 stage, with and without mig-15(rh326). Solid arrows indicate invaginations of ectopic 2˚ pseudovulvae; open arrows indicate a phenomenon observed in strong mig-15 mutants, where induced VPC lineages pull away from the cuticle. (J) Quantification of ectopic 2˚s in the lin-12(n379d) background with and without a series of mig-15 alleles; see panels C, H, and I. Statistical analysis was performed using the t-test or ANOVA. ****=P < 0.0001, *=P < 0.05. (All scale bars, 10 µm.) Error bars = SE.
Fig. 2.
Fig. 2.
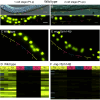
MIG-15 is required for expression of a reporter of 3˚ fate. (A and A’) A wild-type (WT) animal harboring the arIs101(acds-10p>nls-yfp) transgene at the 1-cell (Pn.p) stage of VPC development, when the 3˚ fate marker is not expressed. Pn.p cells are indicated with color coding based on cell fate: yellow = 3˚ cells, rose = 2˚ cells, and blue = 1˚ cells. (A) A DIC photomicrograph. (A’) An epifluorescent photomicrograph of the same animal reveals no YFP expression in any of the VPCs. (B and B’) A WT animal harboring the arIs101(acds-10p>nls-yfp) transgene at the 2-cell (Pn.px) stage of VPC development, when the 3˚ fate marker is expressed in 3˚ cells. Pn.px sibling cells are indicated with color coding based on cell fate: yellow = 3˚ daughters, rose = 2˚ daughters, and blue = 1˚ daughters. (B) A DIC photomicrograph. (B’) An epifluorescent photomicrograph of the same animal reveals YFP expression in 3˚ but not 1˚/2˚ Pn.px siblings. (C) An epifluorescent photomicrograph of the six vulval lineages at the Pn.px stage of a wild-type animal harboring the arIs101(acds-10p>nls-yfp) marker. Anterior is to the left. (D) Heat map representation of the measurement of signal intensity in all VPCs in wild-type animals (Methods). (E) Epifluorescent photomicrographs as in (C) for mig-15(rh148) animals. (F) Heat map representation as in (D) of a mig-15(rh148) animal. Pn.px sibling cells are indicated with color coding based on cell fate: yellow = 3˚ daughters, rose = 2˚ daughters, and blue = 1˚ daughters. Bright yellow nuclei out of frame are epithelial cells. Images for WT and mig-15(rh148) were captured with the same settings (Methods). Pixel intensity from each Pn.p daughter nucleus was measured independently and translated to intensity of yellow signal in the figure (Methods). Each lateral line represents data from each Pn.px in one animal in the order they were scored, with the number of lines in the vertical dimension being the number of animals scored for each genotype. Gray bars represent P3.p lineages that did not divide and thus have only one descendant at this stage and are likely not competent VPCs. N = 20 for the WT and N = 25 for mig-15(rh148). Comparing vulval-only lineages (P5.p-P7.p) between WT and mig-15 mutant we did not see any significant changes (P = 0.23, P = 0.19, P = 0.22, respectively).
Fig. 3.
Fig. 3.
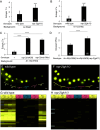
RAP-2 phenocopies MIG-15 in VPC patterning. (A) The rap-2(gk11) deletion mutation enhances induction of ectopic 1˚ cells from let-60(n1046gf). (B) The rap-2(gk11) deletion mutation enhances induction of ectopic 2˚ cells from lin-12(n379d). (C) rap-2(re400) gene disruption and rap-2(miz19dn) dominant negative alleles enhance induction of ectopic 2˚ cells in the lin-12(n379d) background. (D) Deletion of rap-2 partially rescued the underinduction of 1˚ cells, resulting in the vulvaless phenotype, of mutants for the lin-45(n2506) reduction-of-function allele. (E and F) Epifluorescent photomicrographs of all six vulval lineages at the Pn.px stage of WT and rap-2(gk11) animals, respectively, harboring the arIs101(acds-10p>nls-yfp) marker. Anterior is to the left. Images for WT and rap-2(gk11) were captured with the same settings (Methods). Pn.px sibling cells are indicated with color coding based on cell fate: yellow = 3˚ daughters, rose = 2˚ daughters, and blue = 1˚ daughters. Expression of this marker occurs at the first cell division of VPCs. Bright yellow nuclei out of frame are hypodermal cells. (G and H) Heat map representations of the measurement of signal intensity in all VPCs of WT and rap-2(gk11) animals, respectively. Pixel intensity from each Pn.p daughter nucleus was measured independently and translated to intensity of yellow signal in the figure (Methods). Each lateral line represents data from each Pn.px in one animal in the order they were scored, with the number of lines in the vertical dimension being the number of animals scored for each genotype. Gray bars represent P3.p lineages that did not divide and thus have only one descendant at this stage and are likely not competent VPCs. N = 21 for the WT and 24 for rap-2(gk11). Comparing vulval lineages (P5.p-P7.p) between WT and rap-2(gk11) we did not see any significant changes (P = 0.57, P = 0.46, P = 0.38, respectively). Statistical analyses were performed using the t-test and ANOVA. Error bars = SE. ****=P < 0.0001. (All scale bars, 10 µm.)
Fig. 4.
Fig. 4.
MIG-15 and RAP-2 are expressed in VPCs and MIG-15 functions cell autonomously in VPCs to antagonize 2˚ fate. (AC) Confocal photomicrographs of VPCs at the Pn.p (1-cell) stage. (A) Green = mNeonGreen::2xHA::MIG-15. (B) Magenta = mKate2::3xFlag::RAP-2. (C) Merged images from A and B. White = colocalization. Arrows indicate VPC nuclei. (D) Quantitation of ectopic 2˚ cells in the lin-12(n379d) background on vehicle vs. auxin. Animals of genotype cshIs119[lin-31p>TIR1::P2A::mCherry::his-11]; lin-12(n379d); mig-15(re264[AID*::mNG::2xHA::mig-15]), which express the TIR1 cofactor for AID* in the VPCs but not hyp7 epithelium, were exposed to vehicle (4% EtOH) or auxin (1 mM in 4% EtOH). (E) Quantitation of ectopic 2˚ cells in the lin-12(n379d) background on vehicle vs. auxin. Animals of genotype wrdSi47[dpy7p>TIR1::F2A::mTagBFP2::AID*::NLS]; lin-12(n379d); mig-15(re264[AID*::mNG::2xHA::mig-15]), which express the TIR1 cofactor for AID* in the hyp7 epithelium but not VPCs, were exposed to vehicle (4% EtOH) or auxin (1 mM in 4% EtOH; P = 0.54). (F and G) Representative confocal photomicrographs detecting MIG-15 (green) and the mCherry::HIS-11 nuclear marker coexpressed with TIR1 (magenta). This mCherry::HIS-11 nuclear marker is not conditionally degraded, in contrast to the blue internal control marker in (H and I). The internal control marker was not available for VPCs. (H and I) Epithelial-specific depletion of AID*-tagged endogenous MIG-15 failed to increase induction of ectopic 2˚ cells in the lin-12(n379d) mutant background. (H and I) Representative confocal photomicrographs detecting MIG-15 (green) and the AID*-tagged TagBFP2-NLS nuclear marker coexpressed with TIR1 (blue) as internal control for epithelial-specific auxin-dependent degradation (Ashley et al., 2020). Note blue nuclei in vehicle- (H) but not auxin-treated epithelial cells (I). Blue background is intestinal autofluorescence. Solid arrows indicate VPC nuclei; hollow arrows indicate non-VPC epithelial neighbors expressing targeted nuclear BFP. Statistical analyses were performed using the t-test. Error bars = SE. (All scale bars, 10 µm.)
Fig. 5.
Fig. 5.
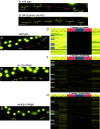
Regulation of expression of the YFP 3˚ fate marker. A, B, C, E, and G) Epifluorescent photomicrographs of the arIs101(acds-10p>nls-yfp) 3˚ fate marker. (A) Expression of the 3˚ fate marker is restricted to 3˚ cells in the WT. (B) The hlh-2(ar614[∆prox]) mutation abolishes development of the AC. Resulting animals (20 of 20) were vulvaless but expressed the arIs101(acds-10p>nls-yfp) marker in all VPC daughters. (C) 3˚ marker in the WT background and (D) heat map representation. (E) 3˚ marker in lin-12(n379d) mutant background and (F) heat map representation reveal that constitutive LIN-12 signaling suppresses expression of the 3˚ marker despite low-level fate transformation in this background (N = 28). (G) 3˚ marker in let-60(n1046gf) mutant background and (H) heat map representation reveal that constitutive LET-60 signaling suppresses expression of 3˚ marker (N = 28). In this latter case, three vulval lineages per animal plus ~1.2 3˚>1˚ transformed VPCs should not express marker. But at least some residual untransformed 3˚ cells were expected to express but were never observed. Statistical analysis was performed using the t-test and ANOVA. (Scale bars = 10 µm.)

Similar articles

References

    1. Sjoqvist M., Andersson E. R., Do as I say, Not(ch) as I do: Lateral control of cell fate. Dev. Biol. 447, 58–70 (2019). - PubMed
    1. Cheung L. S., Schupbach T., Shvartsman S. Y., Pattern formation by receptor tyrosine kinases: Analysis of the gurken gradient in Drosophila oogenesis. Curr. Opin. Genet. Dev. 21, 719–725 (2011). - PMC - PubMed
    1. Voas M. G., Rebay I., Signal integration during development: Insights from the Drosophila eye. Dev. Dyn. 229, 162–175 (2004). - PubMed
    1. Corson F., Siggia E. D., Gene-free methodology for cell fate dynamics during development. eLife 6, e30743 (2017). - PMC - PubMed
    1. Hall B. A., Piterman N., Hajnal A., Fisher J., Emergent stem cell homeostasis in the C. elegans germline is revealed by hybrid modeling. Biophys. J. 109, 428–438 (2015). - PMC - PubMed