. 2024 Dec 31;19(12):e0316179.
doi: 10.1371/journal.pone.0316179. eCollection 2024.

Identifying the NEAT1/miR-26b-5p/S100A2 axis as a regulator in Parkinson's disease based on the ferroptosis-related genes

Affiliations

Identifying the NEAT1/miR-26b-5p/S100A2 axis as a regulator in Parkinson's disease based on the ferroptosis-related genes

Taole Li et al. PLoS One. .

Abstract

Objectives: Parkinson's disease (PD) is a complex neurodegenerative disease with unclear pathogenesis. Some recent studies have shown that there is a close relationship between PD and ferroptosis. We aimed to identify the ferroptosis-related genes (FRGs) and construct competing endogenous RNA (ceRNA) networks to further assess the pathogenesis of PD.

Methods: Expression of 97 substantia nigra (SN) samples were obtained and intersected with FRGs. Bioinformatics analysis, including the gene set enrichment analysis (GSEA), consensus cluster analysis, weight gene co-expression network analysis (WGCNA), and machine learning algorithms, were employed to assess the feasible differentially expressed genes (DEGs). Characteristic signature genes were used to create novel diagnostic models and construct competing endogenous RNA (ceRNA) regulatory network for PD, which were further verified by in vitro experiments and single-cell RNA sequencing (scRNA-seq).

Results: A total of 453 DEGs were identified and 11 FRGs were selected. We sorted the entire PD cohort into two subtypes based on the FRGs and obtained 67 hub genes. According to the five machine algorithms, 4 features (S100A2, GNGT1, NEUROD4, FCN2) were screened and used to create a PD diagnostic model. Corresponding miRNAs and lncRNAs were predicted to construct a ceRNA network. The scRNA-seq and experimental results showed that the signature model had a certain diagnostic effect and lncRNA NEAT1 might regulate the progression of ferroptosis in PD via the NEAT1/miR-26b-5p/S100A2 axis.

Conclusion: The diagnostic signatures based on the four FRGs had certain diagnostic and individual effects. NEAT1/miR-26b-5p/S100A2 axis is associated with ferroptosis in the pathogenesis of PD. Our findings provide new solutions for treating PD.


Conflict of interest statement

The authors declare that there are no competing interests associated with the manuscript.

Figures

Fig 1
Fig 1. Flowchart of this research.
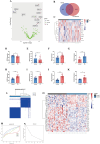
Fig 2
Fig 2. Expression profile of DEGs and consensus clustering of FRGs.
(A) Volcano plot of FRGs between PD vs Control. (B) Venn diagram of FRGs between DEGs and FerrDB. (C) Heatmap of FRGs in PD. (D-K) Validation the expression of FRGs. (L) Consensus clustering at the index k = 2. (M) CDF of clustering (k = 2–5). (N) Delta area under the CDF curve. (O) Heatmap of FRGs in Clusters.
Fig 3
Fig 3. Identification of DEGs and GSEA in two groups.
(A) Volcano plot of DEGs between PD vs Control. (B) Volcano plot of DEGs between cluster1 vs cluster2. (C) Heatmap of top 100 DEGs in two groups. (D-I) Biological functions and pathways of genes between PD vs Control. (J-O) Biological functions and pathways of genes between cluster1 vs cluster2.
Fig 4
Fig 4. WGCNA and enrichment analysis.
(A,B) Estimation of the independence degree and soft threshold power. (C) Cluster dendrogram of DEGs. (D) Correlation between modules and phenotypes of PD. (E,F) Scatterplot of GS vs MM in the green and darkgreen. (G) GO enrichment analysis of hub genes. (H) KEGG enrichment analysis of hub genes.
Fig 5
Fig 5. Machine learning and construction of PD diagnostic model.
(A) Venn diagram of hub genes. (B) PPI network construction base on the hub genes. (C,D) LASSO coefficient profiles and cross validation for turning parameter(λ) of hub genes. (E) Hub genes selected from RF algorithm. (F) Screening conditions of SVM model. (G,H) Hub genes calculated by XGBoost and GBM algorithm and automatically rank. (I) Venn diagram of 4 features in five machine learning algorithms. (J-L) ROC curves shown the diagnostic value of 4 signature genes in training set, test set and external validation set.
Fig 6
Fig 6. Validation of the PD diagnostic model in vitro.
(A-D) The expression level of 4 features in PD. (E-J) Western blot analysis the expression of TH, TFR, FTH, ACSL4 and GPX4 in SH-SY5Y cells treated by the 6-OHDA. (K-M) The levels of iron, MDA and GSH in SH-SY5Y cells treated by the 6-OHDA. (N-Q) The mRNA relative expression levels of GNGT1, FCN2, S100A2 and NEUROD4 in SH-SY5Y cells. (N = 3, *p < 0.05 vs Ctrl group, **p < 0.01 vs Ctrl group, ***p < 0.001 vs Ctrl group. #p < 0.05 vs 6-OHDA group, ##p < 0.01 vs 6-OHDA group, ###p < 0.001 vs 6-OHDA group).
Fig 7
Fig 7. Construction of ceRNA network and validation of NEAT1/miR-26b-5p/S100A2 axis in vitro.
(A) Prediction of miRNAs and lncRNAs based on the signature genes and construction of ceRNA network. (B) construction of primary ceRNA network based on the NEAT1. (C-F) The relative expression levels of NEAT1, S100A2, miR-26b-5p and miR-7b-5p in SH-SY5Y cells after NEAT1 knockdown. (G) The relative expression levels of S100A2 in SH-SY5Y cells after miR-26b-5p inhibition. (H, J) The levels of ROS were quantified by measuring the fluorescence of DCFH-DA in SH-SY5Y cells after NEAT1 knockdown, scale bar = 100μm. (I, K-O) Western blot analysis the expression of TH, TFR, FTH, ACSL4 and GPX4 in SH-SY5Y cells after NEAT1 knockdown. (N = 3, *p < 0.05 vs Ctrl group, **p < 0.01 vs Ctrl group, ***p < 0.001 vs Ctrl group. #p < 0.05 vs 6-OHDA +si-NC group, ##p < 0.01 vs 6-OHDA+si-NC group, ###p < 0.001 vs 6-OHDA+si-NC group).
Fig 8
Fig 8. scRNA-seq analysis of NEAT1.
(A) The cellular landscape of PD and normal samples. (B) TSNE map of 22 clusters. (C,D) TSNE map of nine cell populations classified by genetic marker in PD and normal samples. (E) Expression of NEAT1 at the cellular level of the control and PD group. (F) The expression level of NEAT1 in nine cell populations. (G) Dot plot of NEAT1 levels in cell populations between PD and control.

Similar articles

References

    1. Tolosa E, Wenning G, Poewe W. The diagnosis of Parkinson’s disease. Lancet Neurol. 2006; 5, 75–86. doi: 10.1016/S1474-4422(05)70285-4 - DOI - PubMed
    1. Goldman SM. Environmental toxins and Parkinson’s disease. Annu Rev Pharmacol Toxicol. 2014; 54, 141–164. doi: 10.1146/annurev-pharmtox-011613-135937 - DOI - PubMed
    1. Doroszkiewicz J, Farhan JA, Mroczko J, Winkel I, Perkowski M, Mroczko B. Common and Trace Metals in Alzheimer’s and Parkinson’s Diseases. Int J Mol Sci. 2023; 24, 15721. doi: 10.3390/ijms242115721 - DOI - PMC - PubMed
    1. Thomas GEC, Zarkali A, Ryten M, Shmueli K, Gil-Martinez AL, Leyland LA, et al.. Regional brain iron and gene expression provide insights into neurodegeneration in Parkinson’s disease. Brain. 2021; 144, 1787–1798. doi: 10.1093/brain/awab084 - DOI - PMC - PubMed
    1. Chen L, Min J, Wang F. Copper homeostasis and cuproptosis in health and disease. Signal Transduct Target Ther. 2022; 7, 378. doi: 10.1038/s41392-022-01229-y - DOI - PMC - PubMed