. 2025 Jan;603(2):507-527.
doi: 10.1113/JP287243. Epub 2024 Dec 30.

An α7 nicotinic and GABAB receptor-mediated pathway controls acetylcholine release in the tripartite neuromuscular junction

Affiliations

An α7 nicotinic and GABAB receptor-mediated pathway controls acetylcholine release in the tripartite neuromuscular junction

Konstantin Petrov et al. J Physiol. 2025 Jan.

Abstract

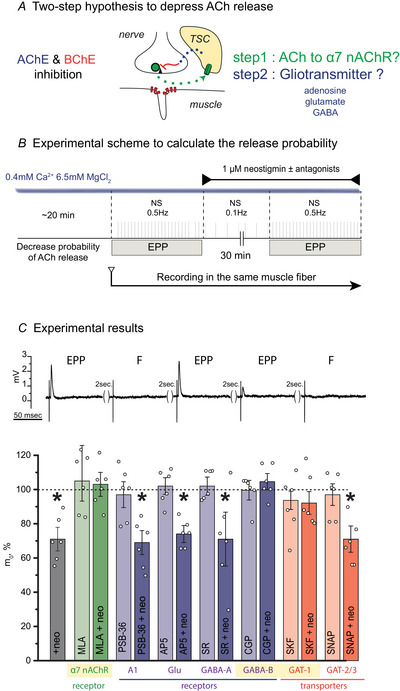
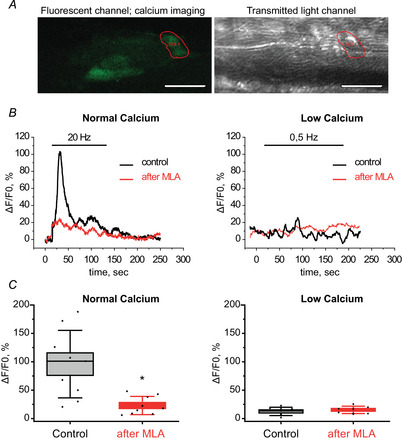
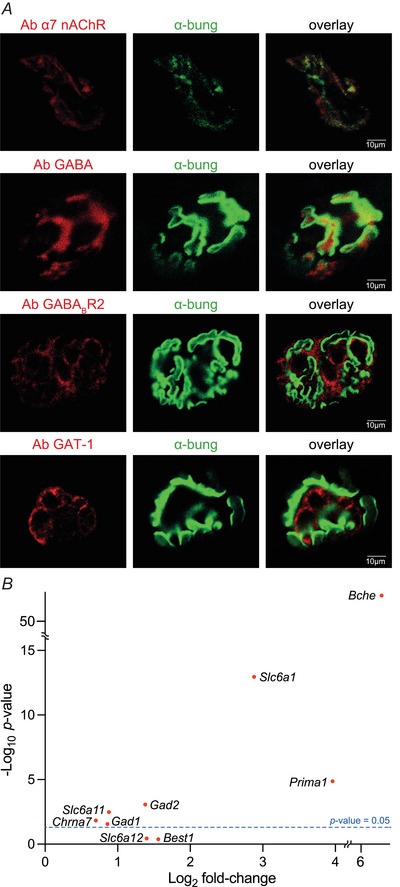
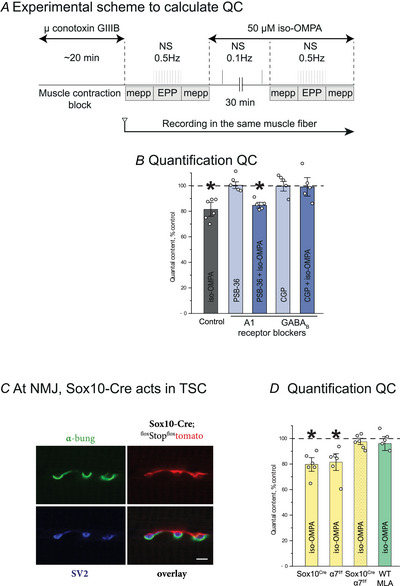
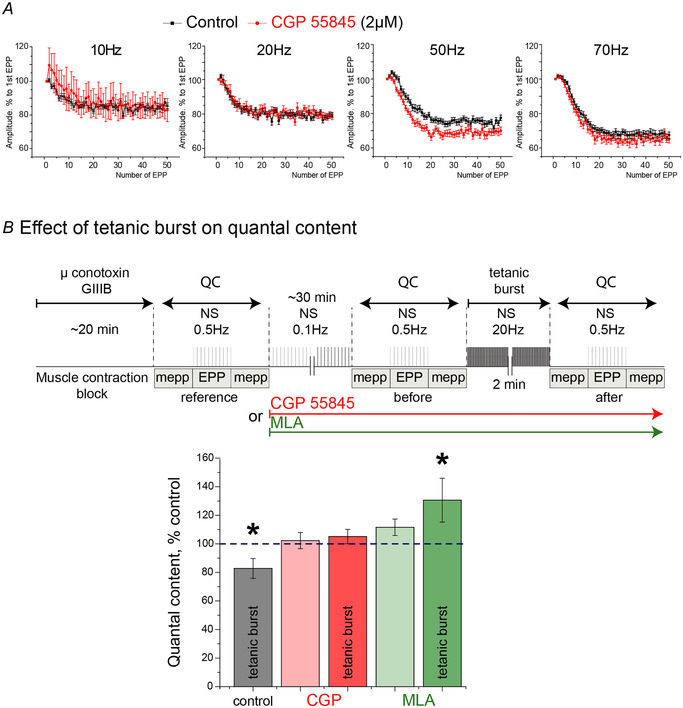
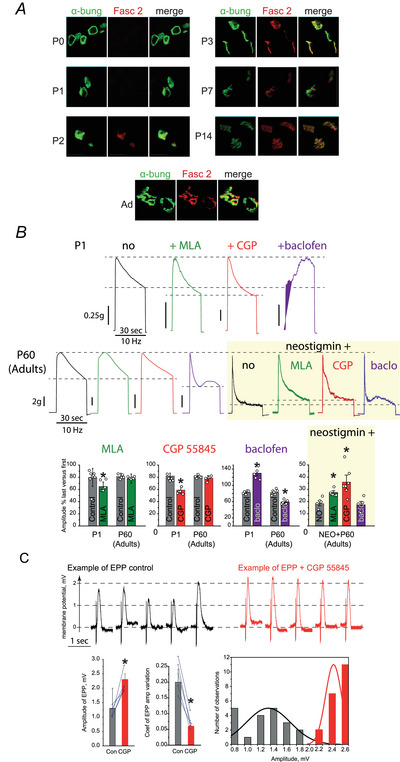
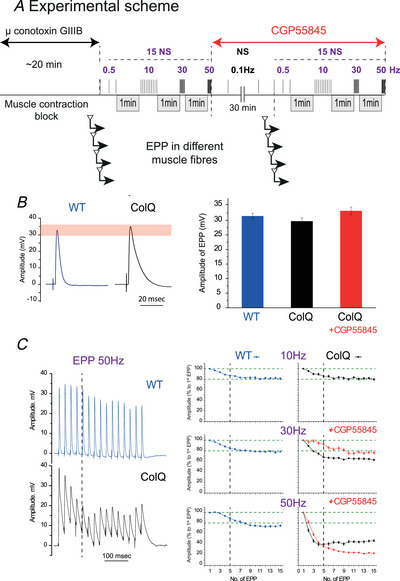
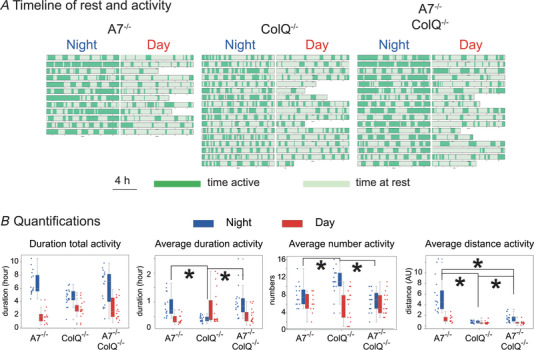
Terminal Schwann cells (TSCs) are capable of regulating acetylcholine (ACh) release at the neuromuscular junction (NMJ). We have identified GABA as a gliotransmitter at mouse NMJs. When ACh activates α7 nicotinic ACh receptor (nAChRs) on TSCs, GABA is released and activates GABAB receptors on the nerve terminal that subsequently reduce ACh release. Indeed, specific deletion of the α7 nAChR in TSCs or inhibition of the metabotropic GABAB receptor prevents the reduction in the quantal content of the end-plate potential induced by cholinesterase inhibitors. The α7/GABAB receptor-mediated pathway is activated when ACh that escapes from collagen Q (ColQ) anchored AChE in the synaptic cleft and from PRiMA-anchored butyrylcholinesterase on the TSC activates α7 nAChRs on the TSC. Consequently, prolonged tetanic stimulation of isolated muscle activates the α7/GABAB receptor pathway, which reduces post-tetanic ACh release. When AChE levels are low in neonatal mice, the α7/GABAB receptor-mediated pathway decreases ACh release and reduces ex vivo muscle fatigue. For ColQ-deficient mice where AChE is not clustered, the decrease in AСh release following activation of this pathway contributes to mouse fatigue in vivo. KEY POINTS: Acetylcholine (ACh) released from the nerve terminal at the neuromuscular junction (NMJ) can activate α7 nicotinic ACh receptor (nAChR) on terminal Schwann cells, releasing gamma-aminobutyric acid (GABA) that activates metabotropic GABAB receptors on the nerve terminal which then reduces further ACh release from the nerve. At the mature NMJ, before reaching α7 nAChRs on terminal Schwann cells ACh is normally hydrolyzed by AChE clustered in the synaptic cleft and by BChE anchored to the TSC. ACh can activate the α7/GABAB receptor-mediated pathway and depress subsequent ACh release when AChE at the NMJ is low, either during development or in congenital myasthenic syndrome. In the latter case, this pathway contributes to muscle fatigue.

Keywords: acetylcholine; acetylcholinesterase; aminobutyric acid; neuromuscular junction.


Conflict of interest statement

The authors declare that they have no competing interests.

Figures

Figure 1
Figure 1. Strategy for quantifying mouse resting time in the breeding cage
The experiment considers an index that distinguishes between mice with different levels of fatigability when in their cage. We expect that mice with greater fatigability will have shorter periods of generalized activity, whatever their activity, defined when the signal from the force sensors rises above a defined threshold. An illustration is provided of the different steps involved in determining the rest and activity periods of a mouse in a breeding cage as described in the Methods. The cage is placed on the four sensors that record the force over time. The signal at the top represents the raw data recorded at 10 Hz for the four sensors S 1, S 2, S 3 and S 4. The sum of the values is shown below. The threshold for activity for the entire recording is obtained by transforming the crude data by the SD (see Methods). If the signal is below the threshold (orange mark), the value is assigned as –1 (rest); if the signal is above, the value is assigned as +1. The integration of the data allows us to create a random walk. As described in the text, the automatic segmentation of the cumulative curve assigns its decrease to a rest period; similarly, if the curve increases, the mouse is in an active period. The method describes the automatic segmentation of this curve. In addition, we can know the position of the mouse (see Methods). Because of the translation of the signal, we are not able to calculate the trajectory of the mouse directly, but we are able to derive its average speed over time and therefore the distance covered during that time, represented by the green curve (see Methods). The integration of this value allows us to calculate the distance travelled during the period represented by the red curve (rest period and active period). [Colour figure can be viewed at wileyonlinelibrary.com]
Figure 2
Figure 2. Search for gliotransmitters that could reduce the release of ACh
A, two‐step hypothesis: If the ACh released by the nerve activates the α7 nAChR, which is presumably localized on the TSC, the number of vesicles that are subsequently released is reduced. We are looking for a gliotransmitter to explain how the TSC communicates with the nerve terminal. B, experimental protocol. If the number of ACh vesicles that are released by the nerve is reduced, we would expect that the probability of release would be reduced as well. The probability of ACh release (m0 ) was estimated in low Ca2+ (0.4 mm) and high Mg2+ (6.5 mm) Kreb–Ringer solution by the method of failures. Under these conditions, the reduced entry of Ca2+ ions into the nerve ending means that some fraction of nerve action potentials will not cause the release of ACh quanta (i.e. failure) and, when ACh release does occur, it is limited to one to three quanta. The probability of ACh release in this experimental condition is an index of the efficacy of the release. To allow ACh released from a small number of vesicles, to reach the α7 nAChR on the TSC, we inhibited both AChE and BChE with neostigmine (1 µm). We recorded the number of failures and the EPP in the same muscle fibre in response to 100 motor nerve stimuli at a frequency of 0.5 Hz in the control (before the application of the tested compounds) and 30 min after the application of the tested compounds. The tested compounds were added to the Ringer buffer and the nerve was stimulated at 0.1 Hz during the incubation, with the recording microelectrode left in place. C, experimental results: Upper: examples of successive nerve stimulations and recoding membrane potential in LAL muscle in the low Ca2+ (0.4 mm) and high Mg2+ (6.5 mm) Kreb–Ringer solution. EPP, end‐plate potentials, and F, ‘failures’, are noted. The empty parenthesis in the original version was an error. Lower: quantification of ACh release probability (mo ) at the NMJs of LAL after incubation with ChE inhibitor neostigmine (neo) and after pre‐incubation with α7 nAChRs blocker (MLA, 10 nm), A1 adenosine receptors blocker (PSB‐36, 5 nm), glutamate receptor blocker (AP5, 25 µm), GABAA receptors blocker (SR 95531, 10 µm), GABAB receptors blocker (CGP 55845, 2 µm), GAT‐1 transporter blocker (SKF 89976, 100 µm) and GAT‐2/3 transporter blocker (SNAP 5114, 100 µm). Data presented as a percentage of mo estimated in the same NMJ before application of the tested compounds. N = 6 muscle. *P < 0.05 compared to control, paired Student's t test. [Colour figure can be viewed at wileyonlinelibrary.com]
Figure 3
Figure 3. An α7 nAChR‐mediated oscillatory Ca2+ response in TSC of LAL muscle
Continuous motor nerve stimulation (20 Hz, 120 s) in Krebs–Ringer solution with normal Ca2+ levels elicited a phasic Ca2+ response in TSC. These oscillatory Ca2+ responses were partially blocked by the α7 nAChRs blocker (MLA, 10 nm). However, at 0.5 Hz frequency of nerve stimulation with low Ca2+ and high Mg2+ levels in Krebs–Ringer solution, no significant increase in the Ca2+ responses in TSC was observed with the onset of nerve stimulation. Spontaneous increases in cytoplasmic Ca2+ levels were observed to occur infrequently, at a rate of two or three times per minute. The amplitude of these Ca2+ oscillations remained unchanged after neostigmine administration. A, locating a region of interest (ROI). Image of a fluorescence channel (left) and a transmitted light channel (right) of confocal microscope with TSC as a ROI. B, experimental data: evolution of Ca2+signal over time. Left panel, example of Ca2+ responses elicited in the same TSC of LAL muscle in Krebs‐Ringer solution with normal Ca2+ level before (black line) and after α7 nAChRs blocker (MLA, 10 nM) (red line). Right: example of Ca2+ responses elicited in TSC of LAL muscle in the low calcium (0.4 mm) high magnesium (6.5 mm) Krebs–Ringer solution before (black line) and after treatment with neostigmine (red line). C, quantification of the Ca2+ signal. Left: quantification of Ca2+ responses in TSC of LAL muscle in Krebs–Ringer solution with normal Ca2+ level before and after α7 nAChRs blocker (MLA, 10 nm) (N = 9 muscles). Right: quantification of Ca2+ responses elicited in TSC of LAL muscle in the low Ca2+ (0.4 mm) high Mg2+ (6.5 mm) Krebs–Ringer solution before and after neostigmine treatment (N = 6 muscles). *P < 0.05 compared to control, Mann–Whitney test. [Colour figure can be viewed at wileyonlinelibrary.com]
Figure 4
Figure 4. Identification of molecular actor at the NMJ
A, immunostaining for α7 nAChRs, GABA, GABAB receptors and GAT‐1 at the NMJs of the mouse levator auris longus (LAL). Muscles were incubated with the antibodies (red labelling) directed against α7 nAChR (first panel), GABA (second panel), R2 subunit of GABAB receptor (third panel) and GAT‐1 transporter of GABA (fourth panel). The NMJs were identified with labelled α‐bungarotoxin (green labelling). B, RNA seq analysis. Scatter plot of log2 of fold‐change (TSCs/muscle) and –log10 of the value of genes of our interest based on RNA‐seq of triplicated triceps brachii muscle and sextuplicated TSCs in adult mice. The fold‐change of Slc32a1 is infinity, and is not plotted. For differential gene expression, see Table 1. [Colour figure can be viewed at wileyonlinelibrary.com]
Figure 5
Figure 5. The α7/GABAB receptor‐mediated pathway reduces the quantal content of EPP in the diaphragm of WT mice when BChE is inhibited
To confirm the characteristics of the α7/GABAB receptor pathway, we directly calculated the number of vesicles released in the diaphragm muscle. To allow ACh that escapes from AChE clustered in the synaptic cleft (spillover) to reach the α7 nAChR on the TSC covered by BChE, we inhibited BChE with iso‐OMPA (50 µm). A, experimental protocol. Diaphragm muscle contraction was blocked by inhibition of the muscle voltage‐gated sodium channels with µ‐conotoxin GIIIB. A sharp microelectrode was inserted close to a NMJ to record focal mEPPs and EPPs. A first recording was obtained for the mEPPs (no nerve stimulation), a second for EPPs (0.5 Hz nerve stimulations) and a third for the mEPPs (no stimulation). BChE inhibitor (iso‐OMPA, 50 µm), A1 adenosine receptor blocker (PSB‐36, 5 nm) or GABAB receptor blocker (CGP 55845, 2 µm) were added to the Ringer buffer and the nerve was stimulated at 0.1 Hz during the incubation. The recording microelectrode was maintained in place. All recording were obtained in 30–40 min. The quantal content was obtained by dividing the mean amplitude of the EPPs by the mean amplitude of the mEPPs. B, quantification of quantal content (QC). The effect of BChE inhibition on quantal content of EPP after pre‐incubation with A1 adenosine receptor blocker (PSB‐36, 5 nm) or GABAB receptor blocker (CGP 55845, 2 µm). Inhibition of BChE with iso‐OMPA (50 µm) did not reduce the quantal content when GABAB receptors were blocked. Data are presented as a percentage of quantal content estimated in the same NMJ before application of iso‐OMPA and receptor blockers. N = 5 muscles. *P < 0.05 compared to control, paired Student's t test. C, tissue‐specific expression of SOX10‐Cre in the TSC. The reporter genes Tomato (a cytoplasm‐soluble red fluorescent protein) is highly expressed in the TSC, but not in muscle fibres or in the nerve. The endplate area was identified with labelled α‐bungarotoxin (α‐Bung). The nerve ending was identified with labelled vesicular ACh transporter (vAChT) and synaptophysin (SV2) (N = 6 muscles, 10 NMJ). D, quantification of quantal content (QC). Quantification of the quantal content of EPP after inhibition of BChE in diaphragm muscle of WT mice and mutants with specific deletion of α7 nAChRs in TSCs. Inhibition of BChE with iso‐OMPA (50 µm) did not reduce the quantal content in mice lacking α7 nAChRs in TSCs. Data presented as percentage of quantal content estimated in the same NMJ before application of iso‐OMPA. N = 6 muscles. *P < 0.05 compared to control, paired Student's t test. [Colour figure can be viewed at wileyonlinelibrary.com]
Figure 6
Figure 6. With fully active ChE, the α7/GABAB receptor‐mediated pathway decreases ACh release under extreme circumstances
To evaluate how this pathway contributes to the normal NMJ, we analysed the consequences of short burst nerve discharges or the consequences after long tetanic stimulation. A, bursts of nerve discharges change the amplitudes of the EPP independent of the α7/GABAB receptor‐mediated pathway. Quantification of the effect of inhibition of GABAB receptors on the decrement of EPP amplitudes. The motor nerve was stimulated at a frequency of 10, 20, 50 and 70 Hz (50 stimuli), with 1 min of rest between each set of stimuli. In each muscle, as a control, recordings were made in five or six NMJs before application of GABAB receptor blocker. The tested compound was then applied for 30 min, after which recordings were made in another set of five or six NMJs using the same stimulation protocol. Data are presented as a percentage of EPP amplitude during the train compared to the amplitude of the first EPP. N = 25–30 NMJs from five muscles. B, tetanic stimulation activates the α7/GABAB receptor‐mediated pathway. The upper part shows the experimental scheme to calculate the quantal content (QC) of EPP. QC was calculated repeatedly, before incubation with α7 nAChRs blocker (MLA, 10 nm) or GABAB receptor blocker (CGP 55845, 2 µm), before tetanic stimulation and after tetanic stimulation. The lower part shows the variation of quantal content before and after tetanic stimulations. Under the control condition, the quantal content decreased to 83%, whereas, when GABAB or α7 nAChRs receptors are blocked, QC is not reduced. [Colour figure can be viewed at wileyonlinelibrary.com]
Figure 7
Figure 7. The α7/GABAB receptor‐mediated pathway reduces ACh release in diaphragm muscle of newborn mice
A, quantification of AChE with fluorescent Fasciculin‐2. Labelling of synaptic AChE with red fluorescent Fasciculin‐2 (Fasc 2) in the diaphragm muscle of newborn (P0–14) and adult (Ad) mice. The endplate area was identified with green labelled α‐bungarotoxin (α‐bung). B, diaphragm fatigue. Upper: representative contractions of diaphragm muscle of newborn (P1) and adult (P60) mice during a 30 s train of motor nerve stimulation at the frequency of 10 Hz. Lower: quantification of the relative changes of contraction force during the train (10 Hz, 30 s) in control and in the presence of α7 nAChRs blocker (MLA, 10 nm), GABAB receptor blocker (CGP 55845, 2 µm), agonist of GABAB receptor (Baclofen) and cholinesterases inhibitor neostigmine (1 µm). Data are presented as a percentage of the force of the last contraction during the tetanus compared to the force of the first contraction. N = 5 muscles. *P < 0.05 compared to control, Mann–Whitney test. C, EPP properties recorded in P2 mouse diaphragm. Upper: example of EPP trace recorded before and after incubation with GABAB receptor blocker (CGP 55845, 2 µm). Lower: mean of EPP parameters (amplitude, coefficient of variation of EPP amplitude) before black or red after GABAB receptor blocker (CGP 55845, 2 µm). An example of changes in the number of EPP with different amplitudes during the experiment is shown on the right. [Colour figure can be viewed at wileyonlinelibrary.com]
Figure 8
Figure 8. The α7/GABAB receptor‐mediated pathway can be activated by endogenous ACh when AChE is absent at the NMJs as a result of mutation in the ColQ gene
A, experimental protocol. Diaphragm muscle contraction was blocked by µ‐conotoxin GIIIB. A sharp microelectrode was inserted near a NMJ to record EPPs. The motor nerve was stimulated at a frequency of 0.5, 10, 20, 50 and 70 Hz (15 stimuli) with 1 min of rest between each set of stimuli. In each muscle, recordings were made at five or six NMJs before application of GABAB receptors blocker. These data were used as a control. Then GABAB receptor blocker was applied for 30 min, after which recordings were made in another five or six NMJs using the same stimulation protocol. B, properties of single EPP. Left: representative EPPs recorded in the diaphragm muscle of WT mice and ColQ −/− mice with endplate AChE deficiency when the motor nerve was stimulated at a frequency of 0.5 Hz. Right: quantification of the mean amplitude of EPPs at 0.5 Hz nerve stimulation before and after application of the GABAB receptors blocker (CGP 55845, 2 µm). C, quantification on the decrement of EPP amplitudes at high frequency nerve stimulations. Left: representative EPPs recorded in diaphragm muscle of WT mice and ColQ −/− mice when the motor nerve was stimulated at a frequency of 50 Hz. Right: quantification of the decrease in amplitudes of EPPs in diaphragm of WT and ColQ −/− mutant mice during high frequency of nerve stimulation. Quantification of the successive EPPs at 10, 30 or 50 Hz nerve stimulation before (black) and after (red) application of the GABAB receptors blocker (CGP 55845, 2 µm). Data are presented as percentage of EPP amplitude during the train compared to the amplitude of the first EPP. N = 25–30 NMJs from five muscles. [Colour figure can be viewed at wileyonlinelibrary.com]
Figure 9
Figure 9. The α7/GABAB receptor‐mediated pathway contributes to fatigue in the ColQ−/− mouse model
This experiment was designed to assess fatigability in severely debilitated mice. A sign of fatigability can be the duration of each activity period, thus the more fatigable the shorter the activity period. A second parameter is the distance travelled during the day and night. By placing the cage with a mouse on an electronic scale, we quantified the duration of rest, the duration of activity and the distance travelled by a mouse in its home cage (see Methods). A, timeline of rest and activity. The timelines show the time course for periods of rest (light green) and activity (dark green) for consecutive night and day periods for Chrna7−/− mice (n = 6), ColQ−/− mice (n = 8) and Chrna7−/−;ColQ−/− mice (n = 8). B, quantification of mouse rest. The plots present the duration of total activity, the mean of activity duration (in hours), the mean of distance activity and the mean of number activity during the night (blue) or the day (red) for Chrna7−/− mice (n = 6), ColQ−/− mice (n = 8) and Chrna7−/−;ColQ−/− mice (n = 8). [Colour figure can be viewed at wileyonlinelibrary.com]

Similar articles

References

    1. Anderson, M. J. , & Cohen, M. W. (1974). Fluorescent staining of acetylcholine receptors in vertebrate skeletal muscle. The Journal of Physiology, 237, 385–400. - PMC - PubMed
    1. Araque, A. , Carmignoto, G. , Haydon, P. G. , Oliet, S. H. R. , Robitaille, R. , & Volterra, A. (2014). Gliotransmitters travel in time and space. Neuron, 81(4), 728–739. - PMC - PubMed
    1. Bernard, V. , Girard, E. , Hrabovska, A. , Camp, S. , Taylor, P. , Plaud, B. , & Krejci, E. (2011). Distinct localization of collagen Q and PRiMA forms of acetylcholinesterase at the neuromuscular junction. Molecular and Cellular Neuroscience, 46(1), 272–281. - PMC - PubMed
    1. Blotnick‐Rubin, E. , & Anglister, L. (2018). Fine localization of acetylcholinesterase in the synaptic cleft of the vertebrate neuromuscular junction. Frontiers in Molecular Neuroscience, 11, 123. - PMC - PubMed
    1. Brown, M. C. , Jansen, J. K. , & van Essen, D. (1976). Polyneuronal innervation of skeletal muscle in new‐born rats and its elimination during maturation. The Journal of Physiology, 261(2), 387–422. - PMC - PubMed

MeSH terms

LinkOut - more resources