. 2025 Feb:112:105535.
doi: 10.1016/j.ebiom.2024.105535. Epub 2024 Dec 30.

Clonal GZMK+CD8+ T cells are identified as a hallmark of the pathogenesis of cGVHD-induced bronchiolitis obliterans syndrome after allogeneic hematopoietic stem cell transplantation

Affiliations

Clonal GZMK+CD8+ T cells are identified as a hallmark of the pathogenesis of cGVHD-induced bronchiolitis obliterans syndrome after allogeneic hematopoietic stem cell transplantation

Yang Gao et al. EBioMedicine. 2025 Feb.

Abstract

Background: Bronchiolitis obliterans syndrome (BOS) is one of the most devastating outcomes of chronic graft-versus-host disease (cGVHD) after allogeneic hematopoietic stem cell transplantation (allo-HSCT). This remains an area of unmet clinical need for optimal therapy for BOS patients partly due to the limited understanding of pathogenic mechanisms.

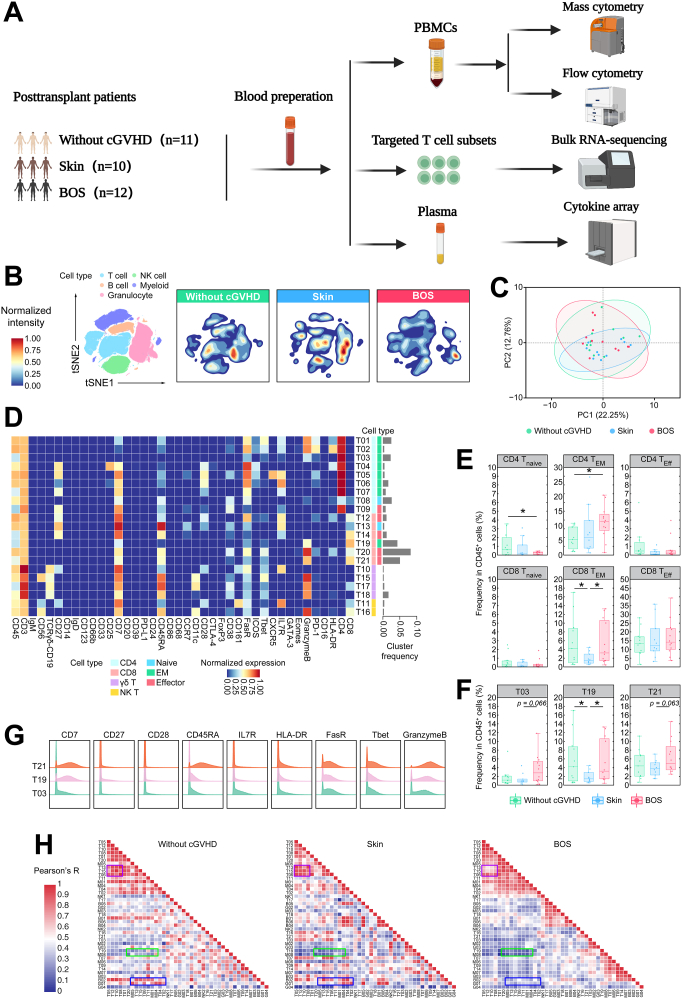
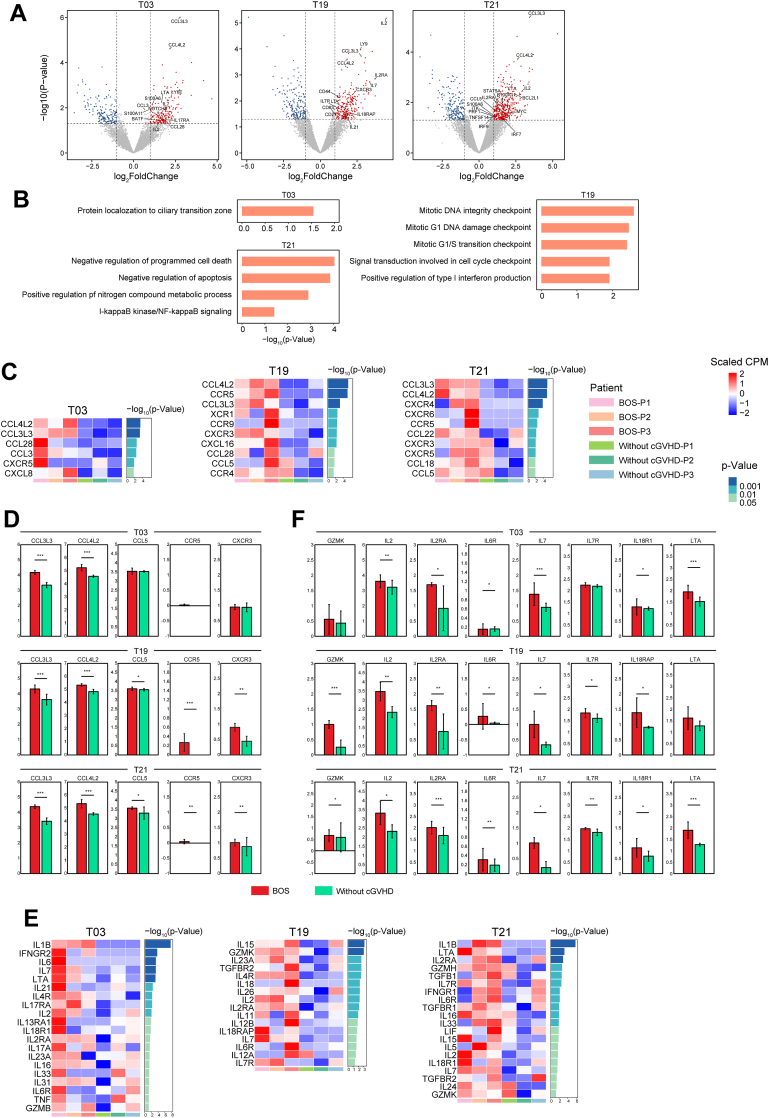
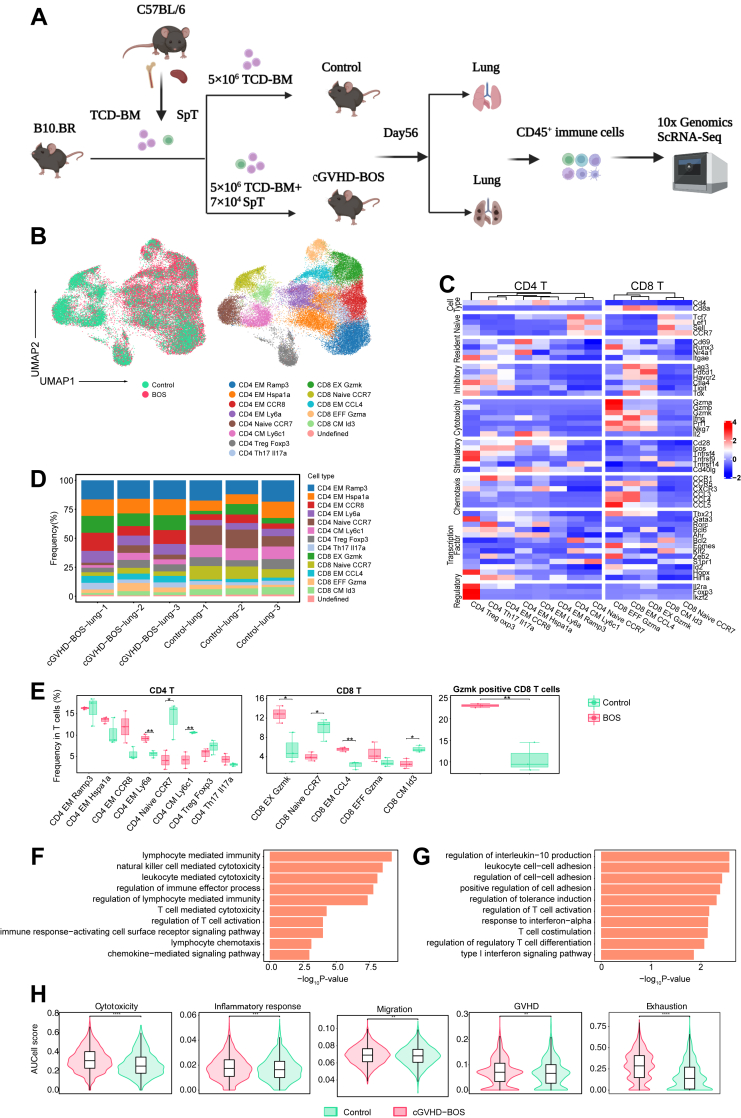
Methods: We collected blood samples from 22 patients with cGVHD and 11 patients without cGVHD following allo-HSCT. By applying a combination of mass cytometry (CyTOF), RNA-sequencing and the quantitative cytokine array, we discovered a new cellular hallmarker of patients with cGVHD-BOS. This finding was further validated in cGVHD-BOS murine models by using single-cell RNA sequencing (scRNA-seq) and paired single-cell V(D)J sequencing analyses.

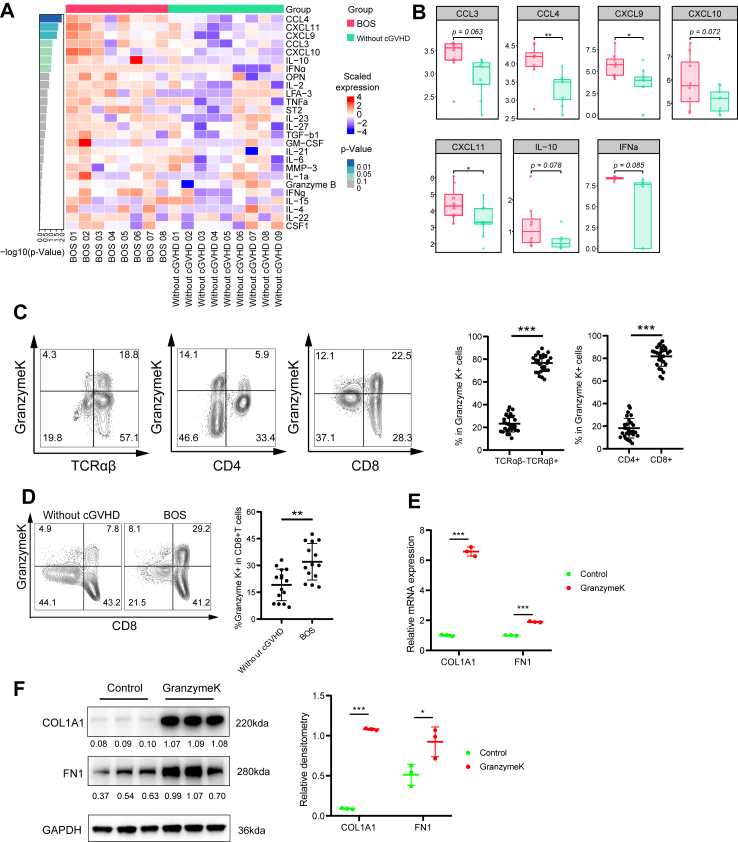
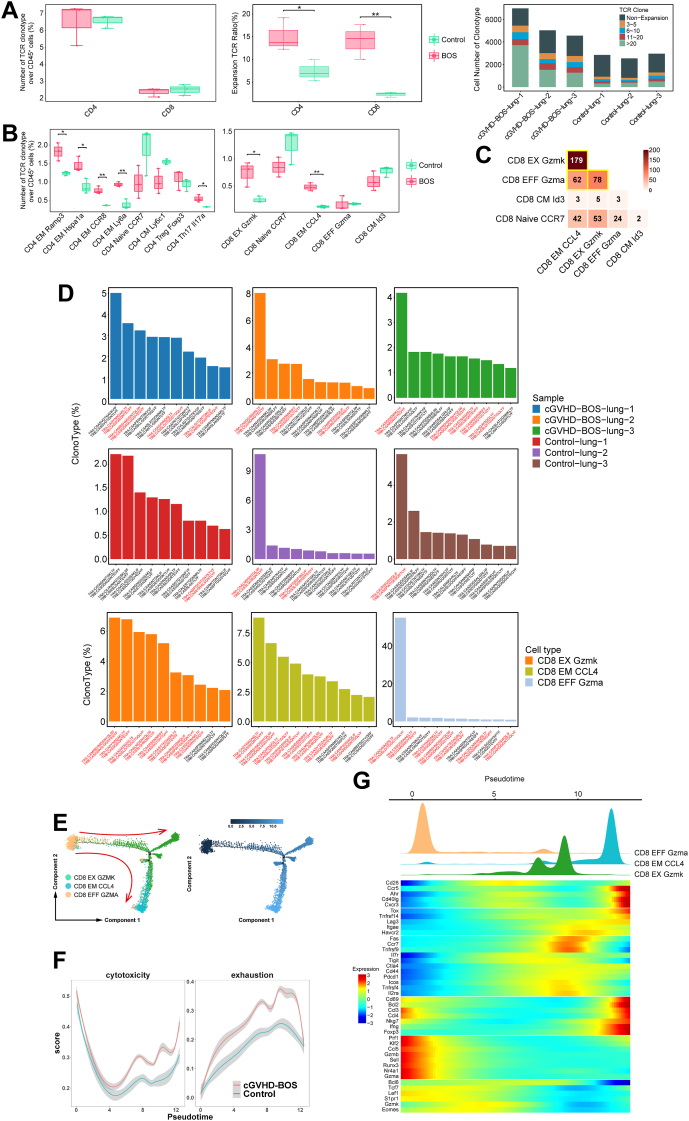
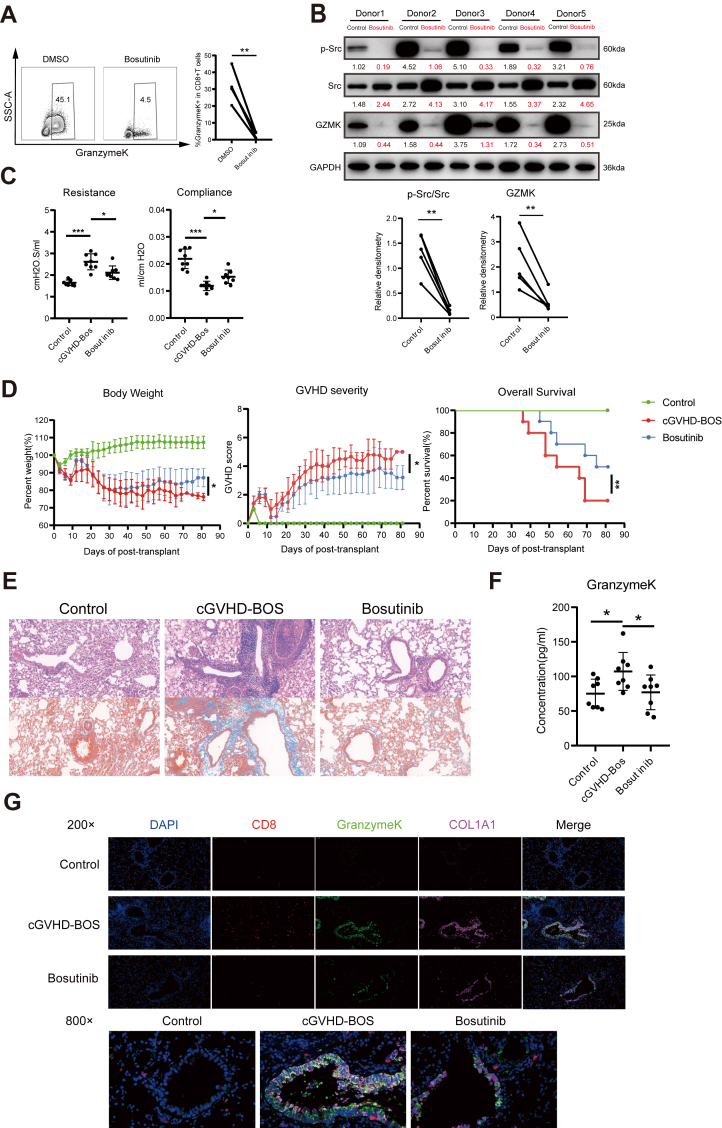
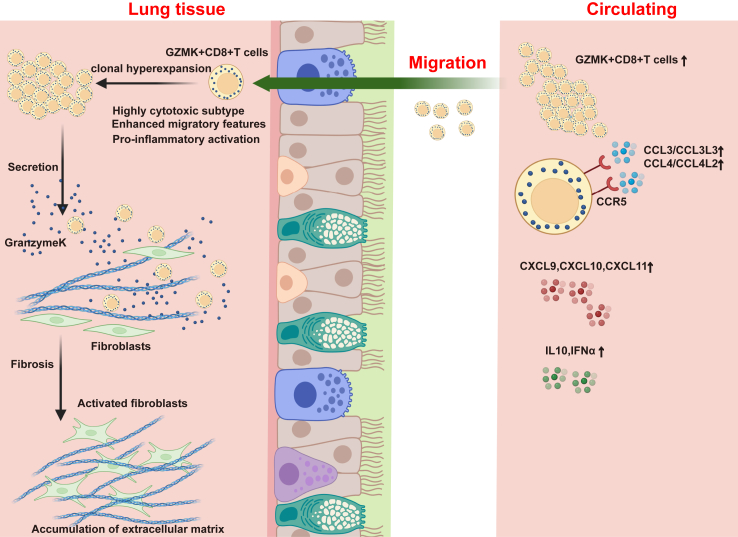
Findings: We revealed that circulating Granzyme K (GZMK)-expressing CD8+ T cells with increased expression of CCR5 were accumulated in cGVHD-BOS patients, and GZMK can induce the expression of fibrosis-essential proteins, collagen type I alpha 1 chain (COL1A1) and fibronectin (FN1), in human fibroblasts. As compared to those of control mice, GZMK+CD8+ T cells in the lungs of cGVHD-BOS mice were undergoing significant infiltration and clonal hyperexpansion, with more cytotoxic, pro-inflammatory, migratory and exhausted phenotypes. Moreover, we screened small-molecule drugs and revealed that Bosutinib, the second-generation BCR-ABL1-targeting tyrosine kinase inhibitor (TKI), could inhibit GZMK expression in CD8+ T cells and reduce lung stiffness and pulmonary fibrosis in cGVHD-BOS mice.

Interpretation: This study provides proof-of-principle evidence for clonal GZMK+CD8+ T cells as an unexplored contributor to the pathogenesis of cGVHD-BOS, which can be an underlying biomarker for treatment.

Funding: This work was supported by the National Natural Science Foundation of China (No. 82170141, 82100123, 81870136), and "Pioneer" and "Leading Goose" R&D Program of Zhejiang (grant No. 2022C03012).

Keywords: Allogeneic hematopoietic stem cell transplantation; Bosutinib; Bronchiolitis obliterans syndrome; Chronic graft-versus-host disease; Granzyme K.


Conflict of interest statement

Declaration of interests The authors declare no competing interests.

Figures

Fig. 1
Fig. 1
Single-cell CyTOF analysis reveals distinct circulating T-cell subsets among patients without cGVHD, cGVHD-skin and cGVHD-BOS patients. (A) Schematic representation of the experimental strategy, the clinical sample collection and analysis. The numbers (n) of patients in each subgroup are provided in the figure. (B) The t-SNE plots of immune cells randomly sampled from without cGVHD, cGVHD with only skin involvement (cGVHD-skin) and cGVHD-BOS groups, colored by major immune cell subsets (left). Contours of cell density distributions in each group (right). (C) The PCA projection of without cGVHD, cGVHD-skin and cGVHD-BOS samples, colored by groups, and each ellipse plot represents the CI of 95% confidence coefficient for individual groups. (D) Heatmap displaying normalized median marker expressions of the 21 identified T-cell subsets. The barplot on the right represents the relative frequencies of T-cell subsets. The annotated lineage and functional cell types are color-labeled on the right correspondingly. (E) Comparisons of the frequencies of identified CD4+ T-cell and CD8+ T-cell functional subsets across groups. Unpaired Student T-test was used to compare the pairwise differences among the three groups. (F) Comparisons of the frequencies of identified T03, T19, T21 T-cell subsets across groups. Unpaired Student T-test was used to compare the pairwise differences among the three groups. (G) Histograms of selected functional marker expression on the identified T03, T19, T21 T-cell subsets. (H) Heatmaps of the Pearson correlation coefficients between immune cell subsets across groups. Red color squares indicate the positive correlation patterns between immune clusters. Blue color squares indicate the negative relationships between immune clusters. Typical changes of positive correlation across three clinical groups are shown in the purple and blue boxes. Typical changes of negative correlation across three clinical groups are shown in the green boxes. Spearman's correlation was used to assess correlation. ∗p < 0.05; ∗∗p < 0.01; ∗∗∗p < 0.001. cGVHD, chronic graft-versus-host disease; BOS, bronchiolitis obliterans syndrome; PBMC, peripheral blood mononuclear cell; NK, natural killer; t-SNE, t-distributed stochastic neighbor embedding; Tnaïve, naïve T cell; TEM, effector memory T cell; TEff, effector T cell.
Fig. 2
Fig. 2
Functional analysis of T cell subsets enriched in cGVHD-BOS patients§. (A) Volcano plot showing the major genes involving immune responses differentially expressed (fold change ≥2, p < 0.05) in T03, T19, T21 T-cell subsets between patients with cGVHD-BOS (n = 3) and patients without cGVHD (n = 3). (B) Bar chart showing the enrichment of specific pathways, based on the HALLMARK gene set of upregulated genes in T03, T19, T21 T-cell subsets in patients with cGVHD-BOS (n = 3) compared with those in patients without cGVHD (n = 3). (C–D) Heatmap and Boxplots# showing the chemokine and chemoattractant receptor genes with significantly higher expression levels in T03, T19, T21 T-cell subsets in patients with cGVHD-BOS (n = 3) compared with those in patients without cGVHD (n = 3). (E–F) Heatmap and Boxplots# showing the cytokine and cytokine receptor genes with significantly higher expression levels in T03, T19, T21 T-cell subsets in patients with cGVHD-BOS (n = 3) compared with those in patients without cGVHD (n = 3). §Patients in Fig. 2A–F were obtained from Cohort 1. #The Limma-voom method is to conduct differential gene expression analysis, and is implemented by the limma package (v3.46.0). The p-values are FDR adjusted p-values. ∗p < 0.05; ∗∗p < 0.01; ∗∗∗p < 0.001.
Fig. 3
Fig. 3
Circulating GZMK+CD8+T cells were accumulated in cGVHD-BOS patients, and GZMK can induce the expression of fibrosis-essential proteins. (A) Heatmap showing 26 chemokines and cytokines with significance (p < 0.05, colored in blue bars) or a trend (0.05< p < 0.1, colored in green bars) of higher serum concentration levels in patients with cGVHD-BOS (n = 8) compared with those in patients without cGVHD (n = 9). (B) Scatter plot graphs showing chemokines (CCL3, CCL4, CXCL9, CXCL10, CXCL11) and cytokines (IL-10 and IFNα) significantly increased or having a trend to increase in patients with cGVHD-BOS (n = 8) compared with those in patients without cGVHD (n = 9). (C) Representative flow cytometry plots of GZMK-expressing cells (left). Comparison of the frequency of GZMK-expressing cells in TCRαβ+ cells with that in TCRαβ cells (middle), as well as comparison of GZMK-expressing cells in CD4+ T cells with that in CD8+ T cells (right). The numbers in flow cytometry plots means the percentages of relevant cells. The percentage of GZMK+ TCRαβ+ cells in all GZMK+ cells was calculated as, 18.8/(18.8 + 4.3) = 81.4%, where 18.8% was the percentage of TCRαβ+ GranzymeK+ cells, and 4.3% was the percentage of TCRαβ GranzymeK+ cells. The percentage of GZMK+ CD4+ T cells in GZMK+ T cells = (GZMK+ CD4+/total GZMK+T cells) × 100. The same is for the percentage of GZMK+ CD8+ T cells in GZMK+ T cells. (D) Flow cytometry analysis (left) and comparison (right) of the frequency of cycling GZMK+ CD8+ T cells in cGVHD-BOS patients (n = 14) and patients without cGVHD (n = 15). (E) Human embryonic lung fibroblast HFL-1 cells were cultured in vitro in the presence or absence of 100 ng/ml human GZMK cytokine for 48 h. RT-qPCR showing the expression levels of COL1A1 and FN1 genes in HFL-1 cells (n = 3). (F) Human embryonic lung fibroblast HFL-1 cells were cultured in vitro in the presence or absence of 100 ng/ml human GZMK cytokine for 48 h. Western-Blot showing the protein expression levels of COL1A1 and FN1 in HFL-1 cells (n = 3). GAPDH was used as a loading control. Numbers indicate the relative optical density of target protein levels to GAPDH. The statistical analyses were performed using unpaired Wilcoxon rank-sum tests. ∗p < 0.05; ∗∗p < 0.01; ∗∗∗p < 0.001. Patients in Fig. 3A–B were obtained from Cohort 2. Patients in Fig.3D were obtained from Cohort 1 and Cohort 2.
Fig. 4
Fig. 4
ScRNA-seq profiling of T cells in the lungs of cGVHD-BOS mice. (A) Schematic representation of the experimental strategy. (B) U-MAP plots showing T-cell distribution in the lungs of cGVHD-BOS mice (n = 3) and control mice (n = 3), colored by groups (left) and cell clusters (right), respectively. (C) Heatmap showing the typical marker gene expression levels in the identified T cell subsets. (D) Stack barplots showing the frequency composition of T cells in the lungs of individual cGVHD-BOS mice (n = 3) and control mice (n = 3). (E) Boxplot showing the frequency comparison of CD4+ (left) and CD8+ (middle) T cell subsets in the lungs of cGVHD-BOS mice (n = 3) and control mice (n = 3). Boxplot on the right showing the frequency comparison of the total Gzmk+ CD8+ T cells in the lungs of cGVHD-BOS mice and controls mice. (F) Gene enrichment analyses of differentially expressed genes (DEGs) in Gzmk+CD8+ T cells compared with those in Gzmk CD8+ T cells in the lungs of cGVHD-BOS mice. (G) Gene enrichment analyses of DEGs in Gzmk+CD8+ T cells from the lungs of cGVHD-BOS mice compared with those from control mice. (H) Boxplots showing the score comparisons of GVHD, inflammatory response, migration, cytotoxicity and exhaustion of Gzmk+CD8+ T cells in the lungs of cGVHD-BOS mice and those in controls mice. All statistical analyses are unpaired Wilcoxon rank-sum tests. The p-values are FDR adjusted p-values in Fig. 4F–G. ∗p < 0.05; ∗∗p < 0.01; ∗∗∗p < 0.001; ∗∗∗∗p < 0.0001.
Fig. 5
Fig. 5
Analysis of TCR, cell transition and states of Gzmk+CD8+T cells in the lungs of cGVHD-BOS mice. (A) Boxplots showing TCR diversity (left, identified by the ratio of the total TCR clonotype number to the total number of CD45+ immune cells detected in each sample) and the ratios of TCR clonal expansion (middle, identified by the ratio of expanded clonotype number to the total clonotype number) in CD4+ and CD8+ T cells in the lungs from cGVHD-BOS mice and control mice. Stacked bar plots showing the numbers of T cells with different clonal expansion levels in the lungs from cGVHD-BOS mice and control mice (right), TCR clonal expansion levels are labeled using different colors. For clonal expansion, those TCR clonotypes expressed in three or more cells were annotated as expanded TCR clonotypes. (B) Boxplots showing TCR diversity in each subtype of CD4+ T cells and CD8+ T cells in the lungs from cGVHD-BOS mice compared with those from control mice. (C) Heatmap showing the number of TCRs shared across CD8+ T-cell subtypes. The number of sharing TCRs with significance is indicated in yellow box. (D) The paired TRA and TRB sequences of the top-10 abundant CDR3 sequences in each lung samples from cGVHD-BOS mice (top) and from control mice (middle), respectively. Each bar is colored by sample. Shared CDR3 sequences are colored in red. The paired TRA and TRB sequences of the top-10 abundant CDR3 sequences in the three Gzmk+CD8+ T-cell subtypes in lungs of cGVHD-BOS mice (bottom), colored by Gzmk+CD8+ T-cell subtypes. Shared CDR3 sequences are colored in red. (E) Pseudo time-ordered analysis of the three Gzmk+CD8+ T cell subtypes, colored by T cell subtypes (left) and the calculated pseudo-time (right). For cell fate transition analysis, the T cell subtypes with at least 2 shared TCR clonotypes were shown. (F) Two-dimensional plots showing the expression scores for genes related to cytotoxicity (left) and exhaustion (right), in Gzmk+ CD8+ T cells from the lungs of cGVHD-BOS mice and from control mice, along with the pseudotime. (G) Heatmap showing the dynamic changes of the expression levels of typical marker genes along the calculated pseudo-time (lower panel) and the distribution of Gzmk+CD8+ T cell subtypes along with the pseudo-time (upper panel). All statistical analyses are unpaired Wilcoxon rank-sum tests. ∗p < 0.05; ∗∗p < 0.01; ∗∗∗p < 0.001.
Fig. 6
Fig. 6
Bosutinib inhibits GZMK+CD8+T cells in vitro and alleviates lung fibrosis in murine cGVHD-BOS model. (A–B) Human T cells were incubated with 1ug/ml lipopolysaccharide in the presence of 10 μM Bosutinib or DMSO control for 48 h. The frequencies of GZMK+ cells in CD8+ T cells were detected by flow cytometry (n = 4) (A). Western-Blot detected the protein expression levels of phosphorylated-Src, Src and GZMK (n = 5). GAPDH was used as a loading control. Numbers indicate the relative optical density of target protein levels to GAPDH. The relative p-Src/Src and GZMK values were calculated and compared between two groups using a paired T-test (B). (C) Pulmonary function analysis of resistance and compliance of mice in control, cGVHD-BOS group and Bosutinib group on day 56 after transplantation. (D) Body weight, GVHD severity and overall survival rate of mice in without cGVHD group (abbreviated as control here), cGVHD-BOS group and cGVHD-BOS with Bosutinib treatment group (abbreviated as Bosutinib here). The cGVHD-BOS mice were randomly assigned to the treatment group with intraperitoneal injection of Bosutinib as 100 mg/kg every 3 days during days 28–56 post-transplantation. (E) HE (upper) and Masson staining (lower) of lung tissues of mice from control, cGVHD-BOS group and Bosutinib group on day 56 after transplantation. (F) Culture supernatant concentration levels of Granzym K secreted by CD8+ T cells sorted from the lung tissues of mice from control, cGVHD-BOS group and Bosutinib group on day 56 after transplantation. CD8+ T cells were stimulated by PMA and ionomycin for 24 h in vitro. (G) Multiple Immunofluorescence staining of the lung tissues of mice from control, cGVHD-BOS group and Bosutinib group on day 56 after transplantation. (DAPI-blue, CD8-red, GranzymeK-green, CollegenI-pink). Data in C, D, F represent 3 independent experiments (control, n = 8; cGVHD-BOS group, n = 8; Bosutinib group, n = 8). Comparisons of body weight and GVHD severity between two groups were performed using ANOVA test. Difference of overall survival rate between two groups was performed using log-rank test. ∗p < 0.05; ∗∗p < 0.01; ∗∗∗p < 0.001.
Fig. 7
Fig. 7
Working model of GZMK+CD8+T cells in cGVHD-BOS pathogenesis. During cGVHD-BOS development, circulating GZMK+CD8+ T cells are recruited to the lungs by serum chemokines. GZMK+CD8+ T cells are undergoing significant infiltration, activation and clonal hyperexpansion in the lungs of cGVHD-BOS and promote lung fibrosis through secretion of GZMK.

Similar articles

Cited by

References

    1. Arai S., Arora M., Wang T., et al. Increasing incidence of chronic graft-versus-host disease in allogeneic transplantation: a report from the Center for International Blood and Marrow Transplant Research. Biol Blood Marrow Transplant. 2015;21(2):266–274. - PMC - PubMed
    1. Anasetti C., Logan B.R., Lee S.J., et al. Peripheral-blood stem cells versus bone marrow from unrelated donors. N Engl J Med. 2012;367(16):1487–1496. - PMC - PubMed
    1. Zaiken M.C., Flynn R., Paz K.G., et al. BET-bromodomain and EZH2 inhibitor-treated chronic GVHD mice have blunted germinal centers with distinct transcriptomes. Blood. 2022;139(19):2983–2997. - PMC - PubMed
    1. Blazar B.R., Murphy W.J., Abedi M. Advances in graft-versus-host disease biology and therapy. Nat Rev Immunol. 2012;12(6):443–458. - PMC - PubMed
    1. Remberger M., Beelen D.W., Fauser A., Basara N., Basu O., Ringden O. Increased risk of extensive chronic graft-versus-host disease after allogeneic peripheral blood stem cell transplantation using unrelated donors. Blood. 2005;105(2):548–551. - PubMed

MeSH terms