. 2024 Dec 31;10(4):e004567.
doi: 10.1136/rmdopen-2024-004567.

Induction of interleukin 21 receptor expression via enhanced intracellular metabolism in B cells and its relevance to the disease activity in systemic lupus erythematosus

Affiliations

Induction of interleukin 21 receptor expression via enhanced intracellular metabolism in B cells and its relevance to the disease activity in systemic lupus erythematosus

Masanobu Ueno et al. RMD Open. .

Abstract

Objective: To elucidate the association between the changes in intracellular metabolism in the early stage of B cell activation and systemic lupus erythematosus (SLE) pathogenesis.

Methods: CD19+ or CD19+CD27- (naïve) cells from the peripheral blood of healthy controls and lupus patients were cultured under different stimuli. The changes in intracellular metabolism and signalling pathways in these cells were evaluated.

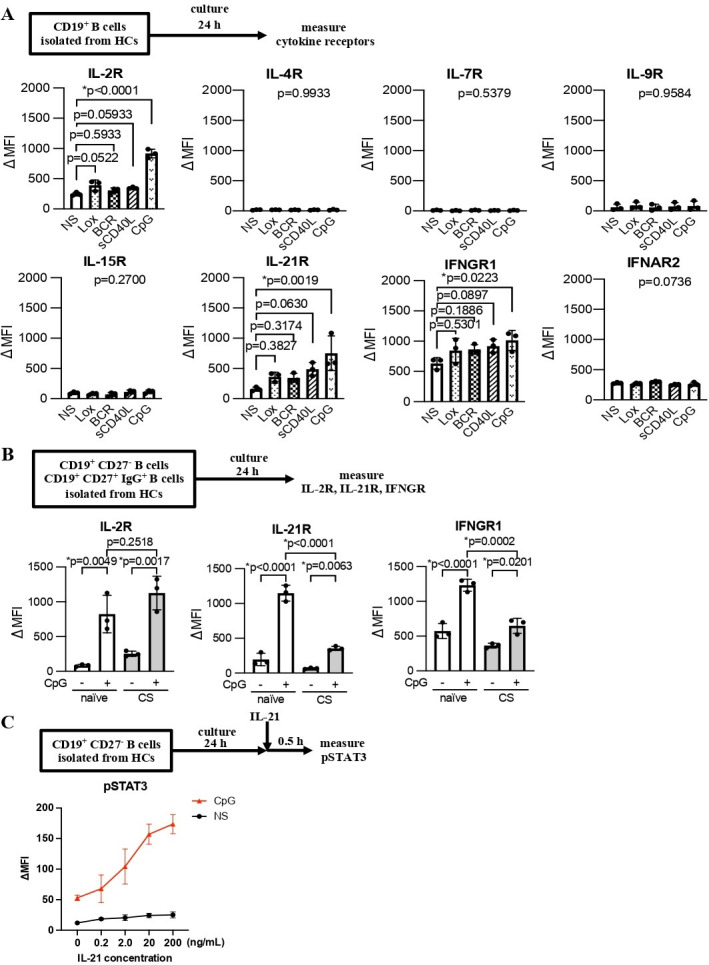
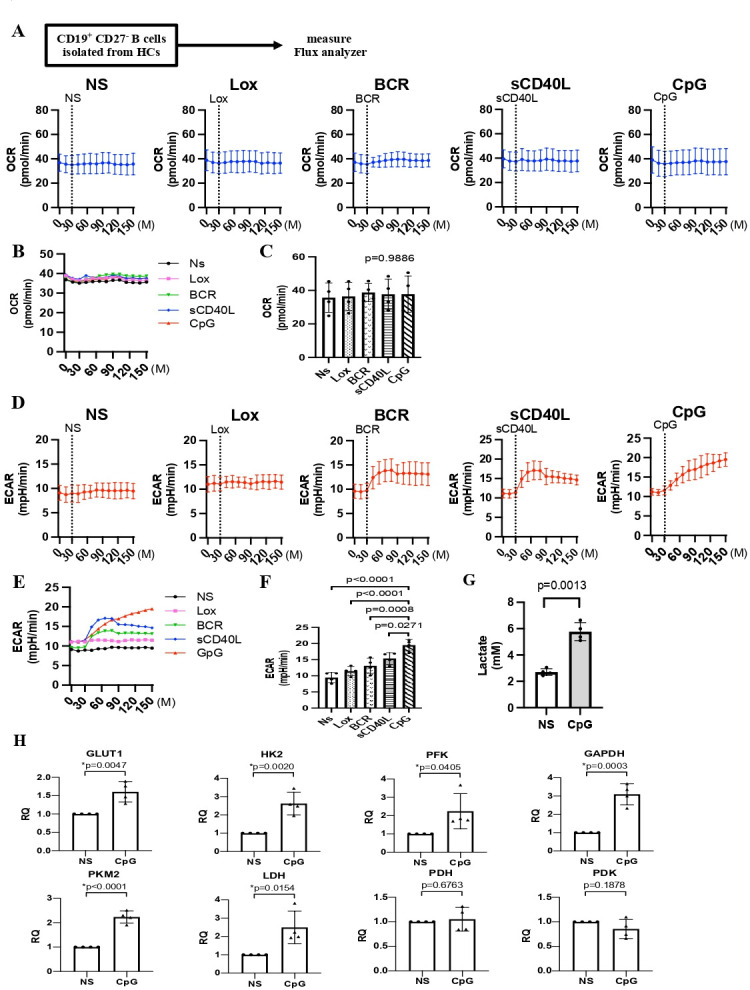
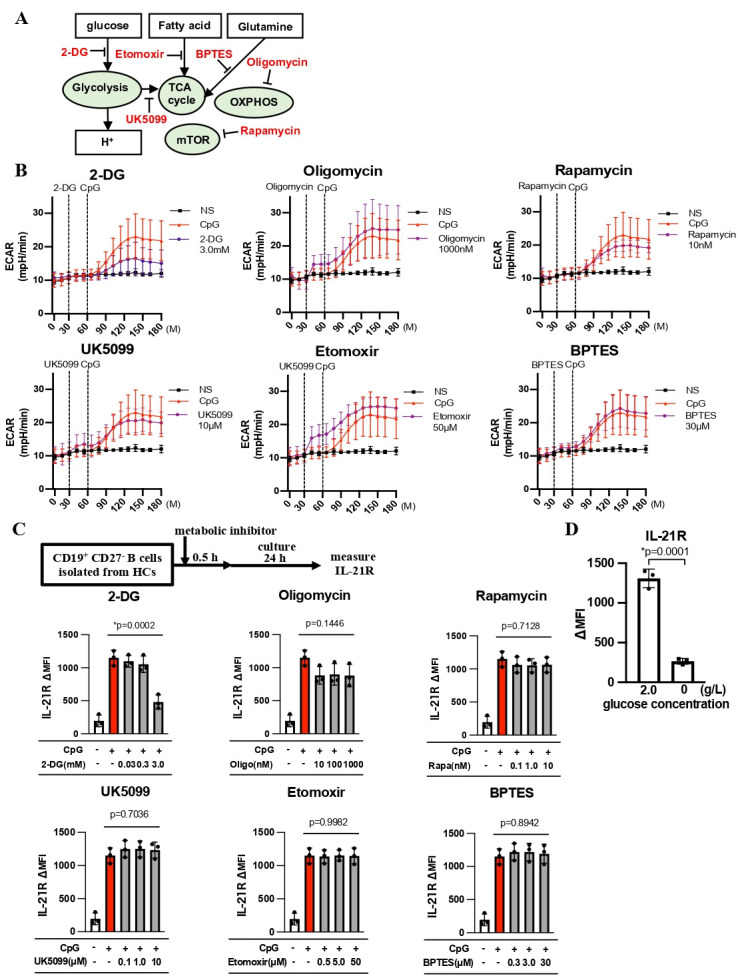
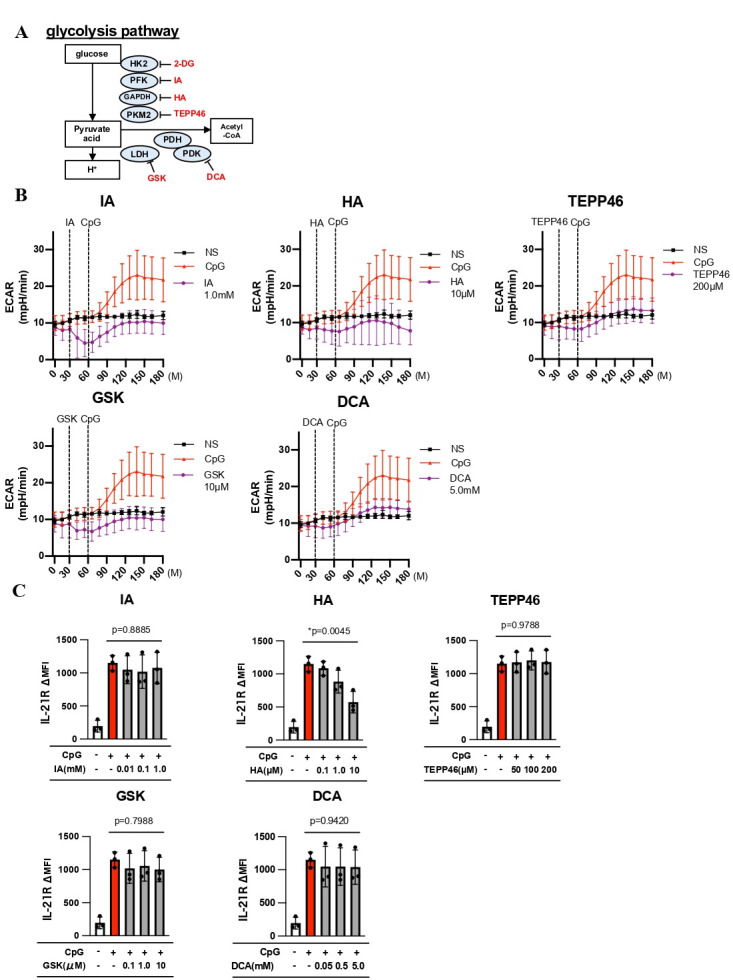
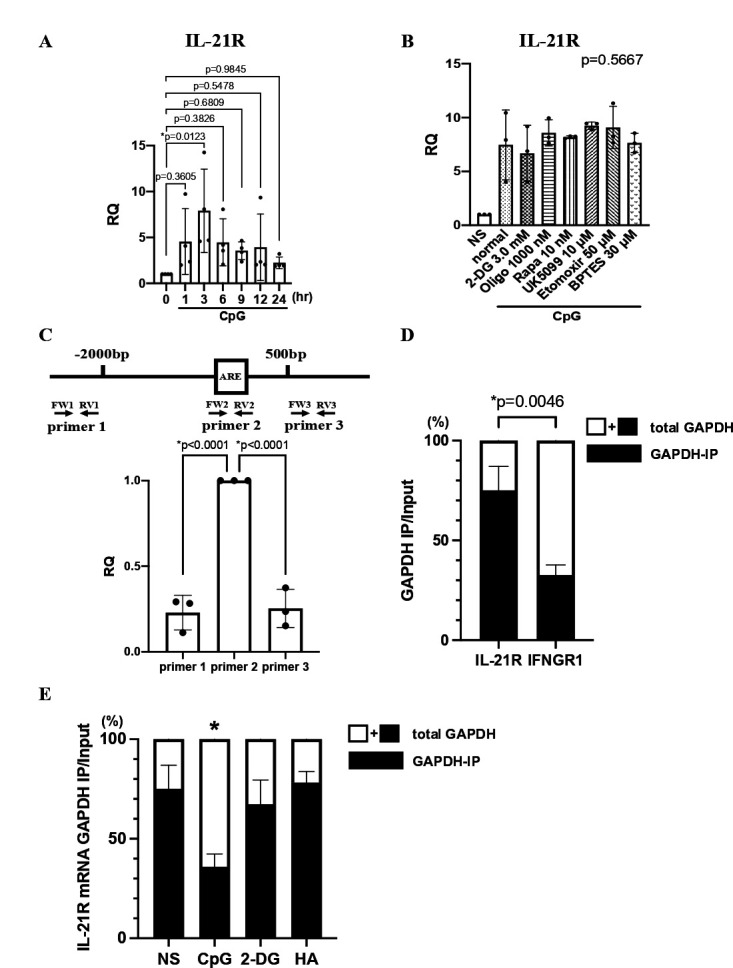
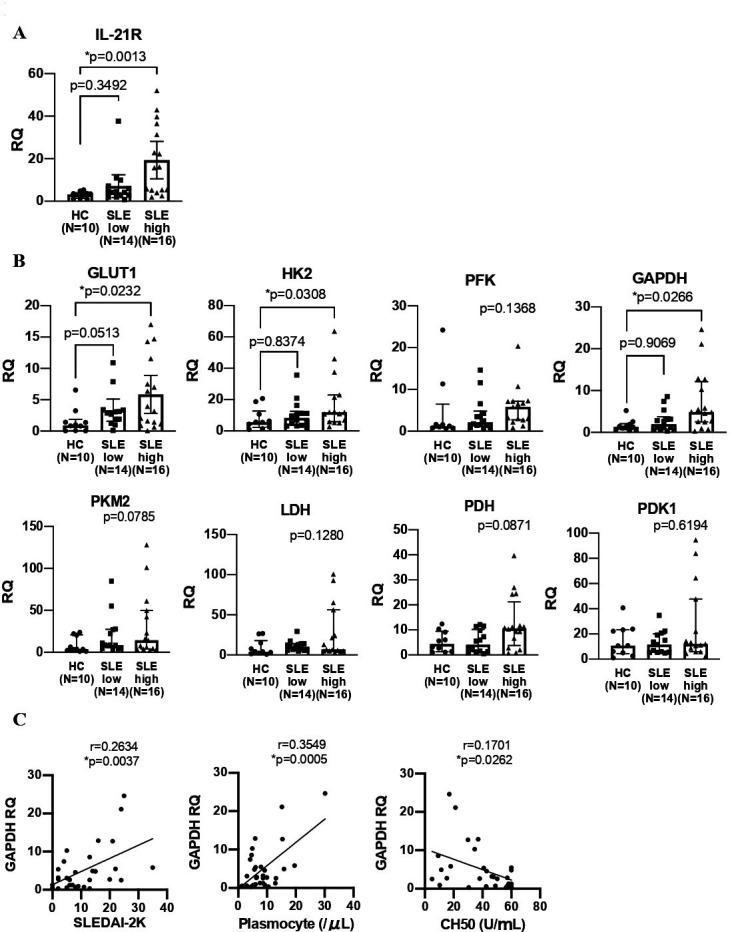
Results: Stimulation with CpG (Toll-like receptor 9 (TLR9) ligand) in vitro induced enhanced interleukin 21 (IL-21) receptor expression in CD19+CD27- cells after 24 hours. The addition of IL-21 to the CpG stimulation enhanced the extracellular acidification rate, which indicates glycolysis, within 30 min. IL-21 receptor (IL-21R) expression induced by CpG stimulation was selectively inhibited by 2-deoxy-D-glucose (hexokinase 2 (HK2) inhibitor) and heptelidic acid (glyceraldehyde 3-phosphate dehydrogenase (GAPDH) inhibitor). RNA immunoprecipitation with anti-GAPDH antibody revealed that CpG stimulation dissociated the binding between IL-21R messenger RNA (mRNA) and GAPDH under no stimulation. HK2 and GAPDH expression were higher in CD19+CD27- cells of lupus patients than in those of healthy controls, and GAPDH expression was correlated with the plasmocyte count and disease activity score.

Conclusion: IL-21R mRNA-GAPDH binding dissociation associated with rapid glycolytic enhancement by the TLR9 ligand in B cells may induce plasmocyte differentiation through IL-21 signals and be involved in exacerbating SLE.

Keywords: Autoimmune Diseases; Immune System Diseases; Lupus Erythematosus, Systemic.


Conflict of interest statement

Competing interests: MU has received speaking fee and honoraria from GlaxoSmithKline. SI has received consulting fees, speaking fees and honoraria from Ono, Taisho, Janssen, UCB, AstraZeneca, Pfizer, GlaxoSmithKline, Astellas, Asahi Kasei, Teijin, Eli Lilly, Nippon-Shinyaku, Daiichi-Sankyo, AbbVie, Eisai, Mitsubishi-Tanabe and Chugai. KS has received speaking fee from Chugai, Astellas, AbbVie, Taisho, Janssen, Eli Lilly Japan, Ayumi and Gilead Sciences and has received research funding from UCB Japan. SK has received consulting fees, speaking fees and honoraria from Eli Lilly, Bristol-Myers and GlaxoSmithKline and has received research grants from Daiichi-Sankyo, AbbVie, Behringer-Ingelheim and Astellas. YM has received consulting fees, speaking fees and honoraria from Eli Lilly and has received research grants from GlaxoSmithKline. SN has received consulting fees, speaking fees, lecture fees and/or honoraria from AstraZeneca, GlaxoSmithKline, Pfizer, Bristol-Myers, Astellas, Asahi Kasei, AbbVie, Chugai, Sanofi, Eisai, Gilead Sciences, Mitsubishi-Tanabe, Janssen, Eli Lilly and Ayumi. YT has received consulting fees, speaking fees and honoraria from Behringer-Ingelheim, Eli Lilly, AbbVie, Gilead, AstraZeneca, Bristol-Myers, Chugai, Daiichi-Sankyo, Eisai, Pfizer, Mitsubishi-Tanabe and GlaxoSmithKline and has received research grants from Asahi Kasei, AbbVie, Chugai, Eisai, Takeda, Daiichi-Sankyo and Behringer-Ingelheim.

Figures

Figure 1
Figure 1. The stimulation by CpG induces IL-21R. CD19+ B cells (Pan B cells), CD19+CD27- B cells (naïve B cells) and CD19+CD27+IgG+ B cells (class-switched (CS) memory B cells) were cultured with Lox 1.0 mM, BCR 1.0 μg/mL, sCD40L 1.0 μg/mL and CpG 0.5 μM for 24 hours. (A) Expression level of IL-2R, IL-4R, IL-7R, IL-9R, IL-15R, IL-21R, IFNGR1 and IFNAR2 in cultured CD19+ B cells (Pan B cells) (n=3). (B) Expression level of IL-2R, IL-21R and IFNGR1 in cultured CD19+CD27- B cells (naïve B cells) and CD19+CD27+IgG+ B cells (CS memory B cells) (n=3). (C) After the CD19+CD27- B cells (naïve B cells) were cultured under CpG stimulation for 24 hours, they were separately stimulated with IL-21 (0 ng/mL, 0.2 ng/mL, 2.0 ng/mL, 20 ng/mL, 200 ng/mL) and cultured for 0.5 hours. Then, pSTAT3 was measured using flow cytometry (n=4). The bars indicate the mean±SD from three or four independent experiments using CD19+ B cells (Pan B cells), CD19+CD27- B cells (naïve B cells) and CD19+CD27+IgG+ B cells (CS memory B cells) from healthy controls. ΔMFI indicates the difference from the isotype control. P values were determined using the analysis of variance (A), Tukey–Kramer (A) or Student’s t-test after false discovery rate correction (B). *p<0.05. HCs, healthy controls; NS, not stimulated; BCR, B cell receptor; IFN, interferon; IFNAR2, IFN-α receptor 2; IFNGR1, IFN-γ receptor 1; IL, interleukin; Lox, loxoribine; pSTAT3, phosphorylated signal transducer and activator of transcription 3; sCD40L, soluble CD40 ligand.
Figure 2
Figure 2. ECAR rapidly increased BCR, sCD40L and TLR9 (CpG) stimuli in CD19+CD27- B cells (naïve B cells) (A)-(F) CD19+CD27- B cells (naïve B cells) from healthy controls were stimulated with Lox 1.0 mM, BCR 1.0 μg/mL, sCD40L 1.0 μg/mL and CpG 0.5 μM. Metabolic function was evaluated with the flux analyser (OCR and ECAR) (n=4). (G) After CD19+CD27- B cells (naïve B cells) from healthy controls were stimulated with CpG 0.5 µM for 24 hours, lactic acid in supernatant was measured (n=4). (H) Gene expression in CD19+CD27- B cells (naïve B cells) after stimulation with CpG for 24 hours, as determined by the RT-PCR (n=4). (A)(B) Changes in the OCR. (C) Comparison of the OCR at 150 min after each stimulation. (D)(E) Changes in the ECAR. (F) Comparison of the ECAR at 150 min after each stimulation. (G) Concentration of lactic acid in supernatant. (H) Gene expression of GLUT1, HK2, PFK, GAPDH, PKM2, LDH, PDH and PDK. (A)–(H) The bars indicate the mean±SD from four independent experiments using CD19+CD27- B cells (naïve B cells) from healthy controls. P values were determined using the analysis of variance (C), Tukey–Kramer (F) or Student’s t-test (G,H). p*<0.05. HCs, hearty controls; NS, not stimulated; BCR, B cell receptor; ECAR, extracellular acidification rate; GAPDH, glyceraldehyde 3-phosphate dehydrogenase; GLUT1, glucose transporter 1; HK2, hexokinase2; LDH, lactate dehydrogenase; Lox, loxoribine; OCR, oxygen consumption rate; PDH, pyruvate dehydrogenase; PDK1, pyruvate dehydrogenase kinase; PFK, phosphofructokinase; PKM2, pyruvate kinase M2; RT-PCR, real-time PCR; RQ, relative quantification; sCD40L, soluble CD40 ligand.
Figure 3
Figure 3. The alteration of IL-21R expression by metabolic inhibitors in naïve B cells After CD19+CD27- B cells (naïve B cells) were pretreated with each metabolic inhibitor for 30 min; they were cultured with CpG stimulation for 24 hours. The expression level of IL-21R was measured using flow cytometry. (A) Overview of metabolic inhibitors. (B) Changes in the ECAR in CD19+CD27- B cells (naïve B cells) after pretreatment with each metabolic inhibitor (n=3). (C) IL-21R expression in CD19+CD27- B cells (naïve B cells) (n=3). (D) CD19+CD27- B cells (naïve B cells) were cultured with CpG stimulation in glucose 2.0 g/L medium or glucose-free medium for 24 hours. IL-21R expression in CD19+CD27- B cells (naïve B cells) (n=3). (A)–(C) The bars indicate the mean±SD from three independent experiments using CD19+CD27- B cells (naïve B cells) from healthy controls. ΔMFI indicates the difference from the isotype control. P values were derived using the analysis of variance (C) or Student’s t-test (D). *p<0.05, **p<0.01. HCs, healthy controls; NS, not stimulated; OXPHOS, oxidative phosphorylation; 2-DG, 2-deoxy-D-glucose; BPTES, bis-2-(5-phenylacetamido-1,2,4-thiadiazol-2-yl)ethyl sulphide; ECAR, extracellular acidification rate; IL-21R, interleukin 21 receptor; mTOR, mammalian target of rapamycin; TCA, tricarboxylic acid.
Figure 4
Figure 4. The alteration of IL-21R expression by glycolytic enzyme inhibitors in naïve B cells. First, CD19+CD27- B cells (naïve B cells) from healthy controls were pretreated with each glycolytic enzyme inhibitor for 30 min, followed by culture with CpG stimulation for 24 hours. The expression level of IL-21R was measured using flow cytometry. (A) Overview of glycolytic enzyme inhibitors. (B) Changes in the ECAR in CD19+CD27- B cells (naïve B cells) after pretreatment with each glycolytic enzyme inhibitor (n=3). (C) IL-21R expression in CD19+CD27- B cells (naïve B cells) (n=3). (A)–(C) The bars indicate the mean±SD derived from three independent experiments using CD19+CD27- B cells (naïve B cells) from healthy controls. ΔMFI indicates the difference from the isotype control. P values were derived using the analysis of variance test (C).*p<0.05, **p<0.01. NS, not stimulated; ECAR, extracellular acidification rate; GAPDH, glyceraldehyde 3-phosphate dehydrogenase; IA, itaconic acid; HA, heptelidic acid; GSK, GSK2837808A; DCA, dichloroacetate; HK2, hexokinase 2; IL-21R, interleukin 21 receptor; LDH, lactate dehydrogenase; PDH, pyruvate dehydrogenase; PDK, pyruvate dehydrogenase; PFK, phosphofructokinase; PKM2, pyruvate kinase M2.
Figure 5
Figure 5. GAPDH binding to IL-21R mRNA inhibits protein translation IL-21R gene expression in CD19+CD27- B cells (naïve B cells) and was measured by RIP-PCR using the anti-GAPDH antibody. (A) IL-21R gene expression in CD19+CD27- B cells (naïve B cells) was measured using RT-PCR at 1, 3, 6, 9, 12 and 24 hours after CpG stimulation (n=4). (B) After pretreatment with each metabolic inhibitor for 30 min followed by culture with CpG stimulation for 3 hours, IL-21R gene expression in CD19+CD27- B cells (naïve B cells) was measured by RT-PCR (n=3). (C) Comparison of the gene expression levels determined by RIP-PCR using primers 1 to 3 for IL-21R mRNA (n=3). (D) Comparison of the gene expression of IL-21R mRNA and IFNGR1 mRNA determined by RIP-PCR (n=3). Black bars (GAPDH-IP) show percentages of IL-21R and IFNGR1 mRNA captured by anti-GAPDH antibody during RNA-IP, relative to total RNA as determined from input (black bar+white bar). (E) Comparison of IL-21R mRNA gene expression determined using RIP-PCR among the conditions of no stimulation, CpG stimulation and CpG stimulation after pretreatment with 2-DG and HA (n=3). Black bars (GAPDH-IP) show the percentage of IL-21R mRNA captured by anti-GAPDH antibody during RNA-IP, relative to total RNA as determined from input (black bar+white bar). (A) The bars indicate the mean±SD from four independent experiments using CD19+CD27- B cells (naïve B cells) from healthy controls. (B)–(E) The bars indicate the mean±SD from three independent experiments using CD19+CD27- B cells (naïve B cells) from healthy controls. P values were determined using the Dunnett test (A, E), analysis of variance test (B), or Student’s t-test (C, D). *p<0.05. NS, not stimulated; BPTES, bis-2-(5-phenylacetamido-1,2,4-thiadiazol-2-yl)ethyl sulphide; GAPDH, glyceraldehyde 3-phosphate dehydrogenase; HA, heptelidic acid; IFNGR1, interferon γ receptor 1; IL-21R, interleukin 21 receptor; mRNA, messenger RNA; RIP, RNA immunoprecipitation; IP, immunoprecipitation, RQ, relative quantification; RTPCR, real-time PCR.
Figure 6
Figure 6. GAPDH levels increase in SLE patients with high disease activity and correlate with disease activity CD19+CD27- B cells and were isolated from HCs and SLE patients. Metabolic function was evaluated with a flux analyser. The gene expression was evaluated using the RT-PCR. (A) Comparison of the gene expression level of IL-21R among HCs and SLE patients with low and high disease activity. (B) Comparison of the gene expression levels of GLUT1, HK2, PFK, GAPDH, PKM2, LDH, PDH and PDK1 in CD19+CD27- B cells among HCs and SLE patients with low and high disease activity. (C) Correlation between GAPDH gene expression in CD19+CD27- B cells and the clinical features of SLE patients. (A), (B) The bars indicate the mean±SD from healthy controls and SLE patients. *p<0.05. HC, healthy control; CH50, 50% haemolytic complement activity; GAPDH, glyceraldehyde 3-phosphate dehydrogenase; GLUT1, glucose transporter 1; HK2, hexokinase 2; IL-21R, interleukin 21 receptor; LDH, lactate dehydrogenase; PDH, pyruvate dehydrogenase; PDK1, phosphoinositide-dependent kinase 1; PFK, phosphofructokinase; PKM2, pyruvate kinase M2; RQ, relative quantification; SLE, systemic lupus erythematosus; SLEDAI-2K, SLE Disease Activity Index 2000.

Similar articles

References

    1. Tanaka Y, Kubo S, Iwata S, et al. B cell phenotypes, signaling and their roles in secretion of antibodies in systemic lupus erythematosus. Clin Immunol. 2018;186:21–5. doi: 10.1016/j.clim.2017.07.010. - DOI - PubMed
    1. Tanaka Y. Systemic lupus erythematosus. Best Pract Res Clin Rheumatol. 2022;36:101814. doi: 10.1016/j.berh.2022.101814. - DOI - PubMed
    1. Fanouriakis A, Tziolos N, Bertsias G, et al. Update οn the diagnosis and management of systemic lupus erythematosus. Ann Rheum Dis. 2021;80:14–25. doi: 10.1136/annrheumdis-2020-218272. - DOI - PubMed
    1. Parodis I, Long X, Karlsson MCI, et al. B Cell Tolerance and Targeted Therapies in SLE. J Clin Med. 2023;12:6268. doi: 10.3390/jcm12196268. - DOI - PMC - PubMed
    1. Yuan Y, Zhao L, Ye Z, et al. Association of toll-like receptor 9 expression with prognosis of systemic lupus erythematosus. Exp Ther Med. 2019;17:3247–54. doi: 10.3892/etm.2019.7290. - DOI - PMC - PubMed

MeSH terms