. 2025 Feb;57(1):59-71.
doi: 10.1038/s12276-024-01369-x. Epub 2025 Jan 1.

Single-cell RNA sequencing and spatial transcriptomics of esophageal squamous cell carcinoma with lymph node metastases

Affiliations

Single-cell RNA sequencing and spatial transcriptomics of esophageal squamous cell carcinoma with lymph node metastases

Wei Guo et al. Exp Mol Med. 2025 Feb.

Abstract

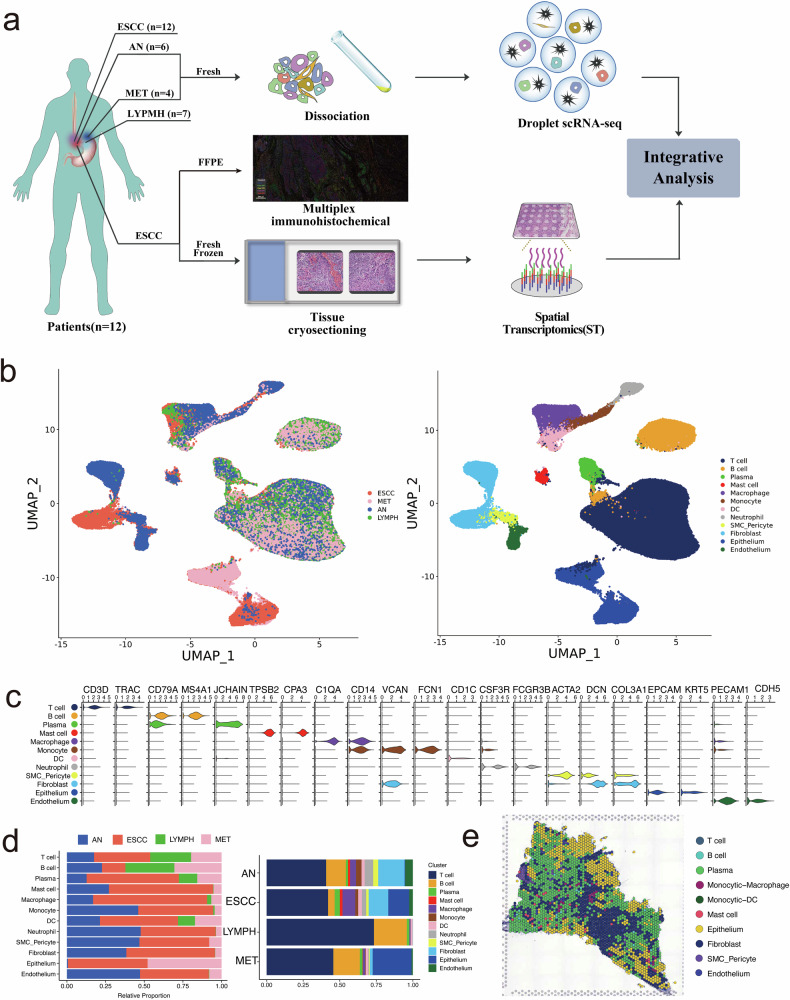
Esophageal squamous cell carcinoma (ESCC) patients often face a grim prognosis due to lymph node metastasis. However, a comprehensive understanding of the cellular and molecular characteristics of metastatic lymph nodes in ESCC remains elusive. In this study involving 12 metastatic ESCC patients, we employed single-cell sequencing, spatial transcriptomics (ST), and multiplex immunohistochemistry (mIHC) to explore the spatial and molecular attributes of primary tumor samples, adjacent tissues, metastatic and non-metastatic lymph nodes. The analysis of 161,333 cells revealed specific subclusters of epithelial cells that were significantly enriched in metastatic lymph nodes, suggesting pro-metastatic characteristics. Furthermore, stromal cells in the tumor microenvironment, including MMP3+IL24+ fibroblasts, APLN+ endothelial cells, and CXCL12+ pericytes, were implicated in ESCC metastasis through angiogenesis, collagen production, and inflammatory responses. Exhausted CD8+ T cells in a cycling status were notably prevalent in metastatic lymph nodes, indicating their potential role in facilitating metastasis. We identified distinct cell-cell communication networks and specific ligand-receptor pathways. Our findings were validated through a spatial transcriptome map and mIHC. This study enhances our comprehension of the cellular and molecular aspects of metastatic lymph nodes in ESCC patients, offering potential insights into novel therapeutic strategies for these individuals.


Conflict of interest statement

Competing interests: The author declares no competing interests. Ethics approval and consent to participate: This study was performed in accordance with the Declaration of Helsinki and was approved by the National Cancer Center/Cancer Hospital Ethics Committee (Approval number: 21/215-2886). All patients provided written informed consent.

Figures

Fig. 1
Fig. 1. The scRNA-seq and ST profiles of esophageal squamous cell carcinoma (n = 12), adjacent normal tissues (n = 6), metastatic lymph nodes (n = 4) and non-metastatic lymph nodes (n = 7).
a Schematic diagram depicting the design of this study. b UMAP plots of the 161,333 high-quality cells from all the 29 samples, with each color coded by either main annotated cell type (left) and corresponding sample type (right). c Violin plot depicting expression levels of the top genes across each main cell type. d Bar plots showing the proportion of each main cell type in different sample types. e The spot clustering of spatial features in the primary tumor sample obtained from one patient with metastatic ESCC. Each color represents one main cell type. The number of spots in the tumor sample is 2343.
Fig. 2
Fig. 2. Exploration of pro-metastatic characteristics of epithelial cells in metastatic ESCC.
a UMAP plots of the 16,416 high-quality cells from all the 21 samples, with each color coded by either cluster of epithelial cells. b The proportion of each epithelial cell cluster in different samples. c CNV scores of epithelial cells obtained from tumor samples, metastatic lymph nodes and adjacent tissues. d Heatmap depicting key marker genes for each subcluster of epithelial cells. e Heatmap showing relative expression levels of metastasis-related genes identified in metastatic ESCC. f Boxplot showing the malignant and non-malignant scores of each subcluster. g Specific GO functions enriched in epithelial cells obtained from metastatic lymph nodes in ESCC. h Representative H&E staining of tumor samples biopsied for spatial transcriptomics and spatial distribution of Metastatic Score, EPCAM, ASPH and TXNRD1 in the tumor site of one patient with metastatic lymph nodes. i The mIHC staining of EPCAM, DSP and TXNRD1 in the tumor site of one patient with metastatic lymph nodes. Scale bars: 100 μm.
Fig. 3
Fig. 3. Identification of cancer-associated fibroblasts correlated with collagen reduction and angiogenesis in metastatic ESCC.
a UMAP plots showing 14,248 high-quality cells from all the 29 samples, with each color coded by either main annotated cell type. b Bubble plot showing key marker genes for each subcluster of fibroblasts. c Heatmap comparing the proportion of fibroblasts among tumor samples, adjacent normal tissue, metastatic lymph nodes and non-metastatic lymph nodes. *P < 0.05; **P < 0.01; ***P < 0.001. d Violin plots showing the expression levels of markers correlated with collagen reduction and angiogenesis in different subpopulations. e Heatmap depicting the expression levels of angiogenesis correlated genes in different fibroblast subpopulations. f Bar plot showing the GO functions enriched in mCAF1 subpopulation. g Spatial distribution of mCAF1 subpopulation and MMP3, MMP1 and CXCL8 in the tumor site of one patient with metastatic lymph nodes. h The mIHC staining of MMP3, POSTN and IL-24 in the tumor site of one patient with metastatic lymph nodes. Scale bars: 100 μm.
Fig. 4
Fig. 4. Endothelial cells serving important roles in the metastasis of ESCC.
a UMAP plots of 3325 endothelial cells grouped into 8 subpopulations. b Heatmap showing the expression levels of marker genes in different endothelial cell subpopulations. c Heatmap comparing the proportion of endothelial cells among tumor samples, adjacent normal tissue, metastatic lymph nodes and non-metastatic lymph nodes. *P < 0.05; **P < 0.01; ***P < 0.001. d UMAP plots depicting the expression levels of KDR, APLN, COL4A1 and COL4A2 in endothelial cells. e The representative regulatory network of SOX4 and SOX11 revealed by SCENIC analysis. f The activity scores of SOX4 and SOX11 in different endothelial cell subpopulations. g The mIHC staining of SOX4, CXCR4, SPARC, SOX11, RGCC and APLN in the tumor site of one patient with metastatic lymph nodes. Scale bars: 50 μm. h Spatial distribution of CEC2 subpopulation and SOX4, RGCC and COL4A2 in the tumor site of one patient with metastatic lymph nodes. i The deconvolution analysis showing the distribution of CEC2 subpopulation in the tumor site of one patient with metastatic lymph nodes. j The mIHC staining of KDR, APLN, IGFBP5 in the tumor site of one patient with metastatic lymph nodes. Scale bars: 100 μm. AEC arterial endothelial cells, CEC capillary endothelial cells, VEC vascular endothelial cells, LEC lymphatic endothelial cells.
Fig. 5
Fig. 5. Metastatic lymph nodes of ESCC are composed of specific pericytes and smooth muscle cells (SMCs).
a UMAP plots of 2191 pericytes and SMCs grouped into 9 clusters. b Heatmap comparing the proportion of pericytes and SMCs among esophageal squamous cell carcinoma, adjacent normal tissue, metastatic lymph nodes and non-metastatic lymph nodes. *P < 0.05; **P < 0.01; ***P < 0.001. c Heatmap showing the selected marker genes of each pericyte and SMC subcluster. d UMAP plots depicting the expression levels of ABCC9, CCL19, CCL21 and CXCL12 in pericytes and SMCs. e Heatmap showing the gene set QuSAGE enrichment scores for different pericyte and SMC subcluster subclusters. f The mIHC staining of SDF1, ABCC9, MYH11 in the tumor site of one patient with metastatic lymph nodes. Scale bars: 100 μm. g Spatial distribution of PC1, CXCL12 and ABCC9 in the tumor site of one patient with metastatic lymph nodes. h The deconvolution analysis showing the distribution of PC1 subpopulation in the tumor site of one patient with metastatic lymph nodes.
Fig. 6
Fig. 6. Exhausted CD8+ T cells in cycling status in the pro-metastasis environment for ESCC metastasis.
a UMAP plots of CD8+ T cells into 6 clusters. b The relative proportion of exhausted CD8+ T cells (TEX) and exhausted CD8+ T cells in cycling status (Cycling-TEX) among esophageal squamous cell carcinoma, adjacent normal tissue, metastatic lymph nodes and non-metastatic lymph nodes. c Violin plot showing the expression levels of key marker genes of each CD8+ T cell subcluster. d Potential trajectory of differentiation from naïve CD8+ T cells (CD8-TN) into exhausted CD8+ T cells in cycling status (Cycling-TEX) inferred by analysis with Monocle 2. e Comparison of exhausted scores of each subcluster of CD8+ T cells. f Violin plots showing key marker genes of exhausted CD8+ T cells. g Bubble plots comparing ligand-receptor signaling pathways of immune cells between normal lymph nodes (left) and metastatic lymph nodes (right) in metastatic ESCC.

References

    1. Bray, F. et al. Global cancer statistics 2018: GLOBOCAN estimates of incidence and mortality worldwide for 36 cancers in 185 countries. CA Cancer J. Clin.68, 394–424 (2018). - PubMed
    1. Zhou, B. et al. Global burden and temporal trends in incidence and mortality of oesophageal cancer. J. Adv. Res., 10.1016/j.jare.2022.10.007 (2022). - PMC - PubMed
    1. Morgan, E. et al. The Global Landscape of Esophageal Squamous Cell Carcinoma and Esophageal Adenocarcinoma Incidence and Mortality in 2020 and Projections to 2040: New Estimates From GLOBOCAN 2020. Gastroenterology163, 649–658.e642 (2022). - PubMed
    1. Baba, Y. et al. Clinical and Prognostic Features of Patients With Esophageal Cancer and Multiple Primary Cancers: A Retrospective Single-institution Study. Ann. Surg.267, 478–483 (2018). - PubMed
    1. Liu, L. et al. TBL1XR1 promotes lymphangiogenesis and lymphatic metastasis in esophageal squamous cell carcinoma. Gut.64, 26–36 (2015). - PubMed

Substances