. 2024 Dec 31;26(1):192.
doi: 10.1186/s13058-024-01931-5.

Patient-derived response estimates from zero-passage organoids of luminal breast cancer

Affiliations

Patient-derived response estimates from zero-passage organoids of luminal breast cancer

Róża K Przanowska et al. Breast Cancer Res. .

Abstract

Background: Primary luminal breast cancer cells lose their identity rapidly in standard tissue culture, which is problematic for testing hormone interventions and molecular pathways specific to the luminal subtype. Breast cancer organoids are thought to retain tumor characteristics better, but long-term viability of luminal-subtype cases is a persistent challenge. Our goal was to adapt short-term organoids of luminal breast cancer for parallel testing of genetic and pharmacologic perturbations.

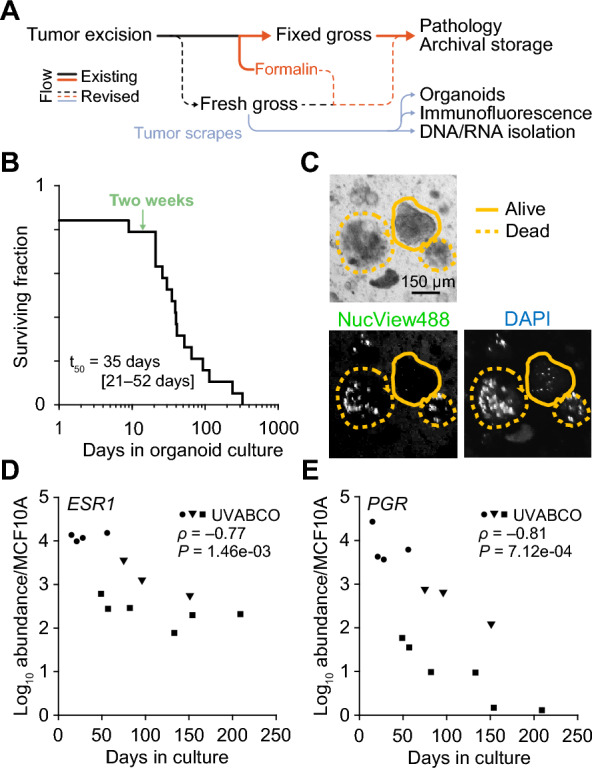
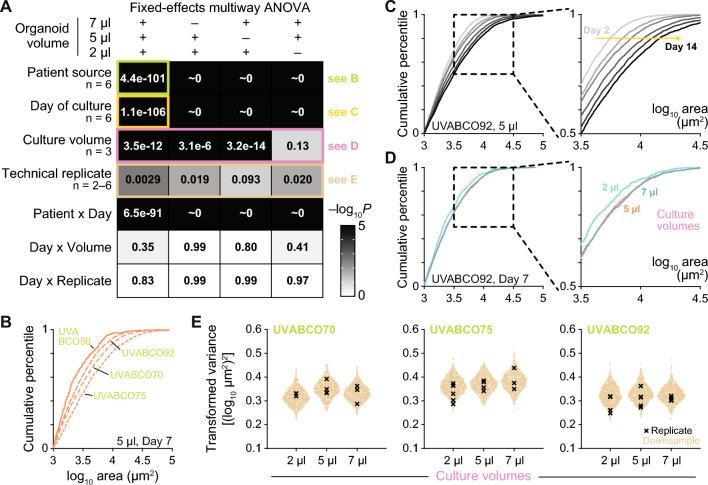
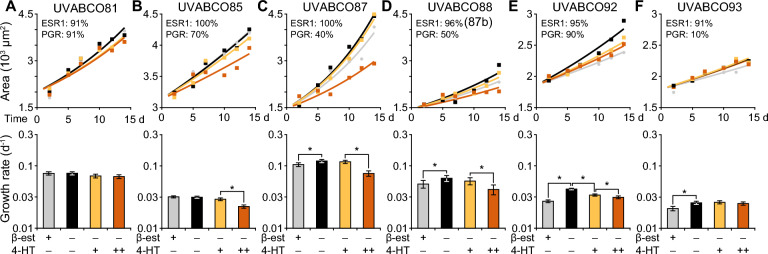
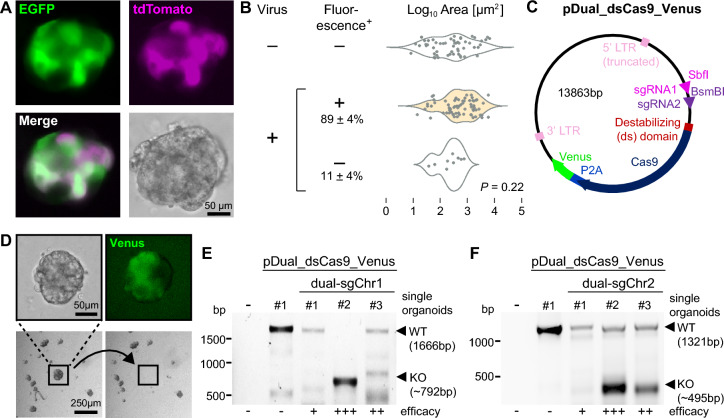
Methods: We freshly isolated patient-derived cells from luminal tumor scrapes, miniaturized the organoid format into 5 µl replicates for increased throughput, and set an endpoint of 14 days to minimize drift. Therapeutic hormone targeting was mimicked in these "zero-passage" organoids by withdrawing β-estradiol and adding 4-hydroxytamoxifen. We also examined sulforaphane as an electrophilic stress and commercial nutraceutical with reported anti-cancer properties. Downstream mechanisms were tested genetically by lentiviral transduction of two complementary sgRNAs and Cas9 stabilization for the first week of organoid culture. Transcriptional changes were measured by RT-qPCR or RNA sequencing (RNA-seq), and organoid phenotypes were quantified by serial brightfield imaging, digital image segmentation, and regression modeling of volumetric growth rates.

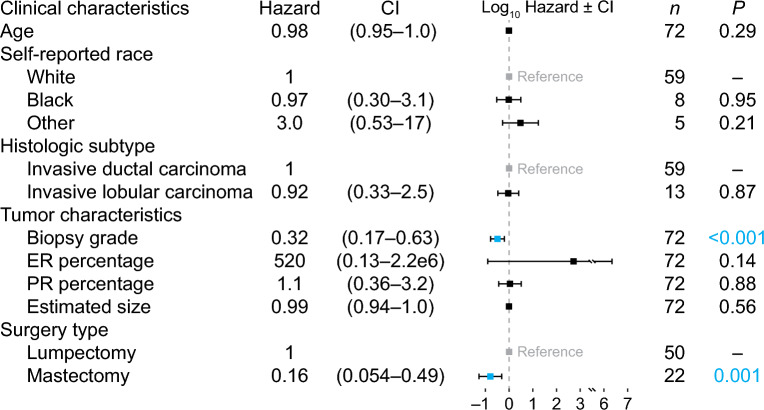
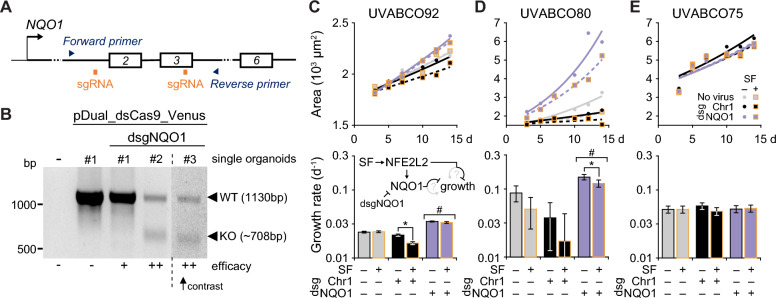
Results: We achieved > 50% success in initiating luminal breast cancer organoids from tumor scrapes and maintaining them to the 14-day zero-passage endpoint. Success was mostly independent of clinical parameters, supporting general applicability of the approach. Abundance of ESR1 and PGR in zero-passage organoids consistently remained within the range of patient variability at the endpoint. However, responsiveness to hormone withdrawal and blockade was highly variable among luminal breast cancer cases tested. Combining sulforaphane with knockout of NQO1 (a phase II antioxidant response gene and downstream effector of sulforaphane) also yielded a breadth of organoid growth phenotypes, including growth inhibition with sulforaphane, growth promotion with NQO1 knockout, and growth antagonism when combined.

Conclusions: Zero-passage organoids are a rapid and scalable way to interrogate properties of luminal breast cancer cells from patient-derived material. This includes testing drug mechanisms of action in different clinical cohorts. A future goal is to relate inter-patient variability of zero-passage organoids to long-term outcomes.

Keywords: Luminal; Matrigel; NQO1; Organoid; Sulforaphane; Systems biology; TP73; Tamoxifen.


Conflict of interest statement

Declarations. Ethics approval and consent to participate: Human sample acquisition and experimental procedures were carried out in compliance with regulations and protocols approved by the Institutional Review Board for Health Sciences Research (IRB-HSR) at the University of Virginia in accordance with the U.S. Common Rule and IRB Protocol #14176. The Institutional Review Board has granted this study a waiver of consent under 45CFR46.116 of the 2018 Common Rule. Consent for publication: Not applicable. Competing interests: The authors declare no competing interests.

Figures

Fig. 1
Fig. 1
Loss of viability and hormone receptor expression in organoids isolated from tumor scrapes. A Schematic detailing the standard gross processing of surgically resected tumors (solid black-to-orange line) alongside changes (dashed lines) that incorporate tumor scrapes (blue line). The addition of formalin is in orange. B Kaplan–Meier survival analysis of luminal breast cancer organoids generated from tumor scrapes (n = 19 independent luminal breast cancers). The median survival time (t50) is shown with the 95% confidence interval in parentheses, and the two-week time point is annotated (green). C Live-cell NucView® 488 Caspase-3 and DAPI staining of live (solid line) and apoptotic (dashed line) organoids. Scale bar is 150 µm. D and E RT-qPCR of ESR1 and PGR expression in organoids from three patients (UVABCO92, circles; UVABCO1, squares; UVABCO5, triangles) at different passages over time. Relative transcript abundance is normalized to MCF10A-5E as a basal control
Fig. 2
Fig. 2
Zero-passage organoids preserve short-term hormone receptor expression and reduce trans-differentiation of luminal breast cancer cells. A and B Comparison of ESR1 and PGR expression in originating tumor scrapes, zero-passage organoids, and 2D cultured cells relative to a basal control (MCF10A-5E; pink) and luminal breast cancer cell lines (MCF7, T47D, HCC1500, CAMA1, EFM19, and ZR-75–1). Shaded boxes indicate the observed range of expression among patients. Paired samples are connected with black lines. Blue highlights paired samples of tumor scrape, 2D culture, and zero-passage organoids (n = 4 independent luminal breast cancers). Paired 2D and organoid cultures were compared for ESR1 and PGR abundance by paired t test after log transformation. C. Downsampled scRNA-seq data of human breast cancers [21] used to define a CIBERSORTx signature matrix for bulk RNA-seq deconvolution [34]. D Gene-by-cell type signature matrix for deconvolving lineages in tumor scrapes, zero-passage organoids, and 2D cultures. E and F Comparison of luminal and basal lineage fractions in originating tumor scrapes, zero-passage organoids, and 2D cultured cells relative to luminal breast cancer cell lines (MCF7, T47D, HCC1500, CAMA1, EFM19, and ZR-75–1). Paired samples are connected with black lines. *P < 0.05 by paired one-sided t test after arcsine transformation of percentages
Fig. 3
Fig. 3
Pre-surgical characteristics and their association with organoid failure risk by day 14. Cox proportional hazards model for n = 72 luminal breast cancers showing hazard ratios with confidence interval (CI). Significant factors are blue. Tumor grade at biopsy was missing for one of the specimens, and five specimens were missing the estimated size (see Methods)
Fig. 4
Fig. 4
Reproducible miniaturization of organoid cultures to 5 µl without detectable growth deficits. A Multiway ANOVA table of P values for organoid size and the indicated fixed effects and interaction terms. Culture volumes (2 µl, 5 µl, and 7 µl) were considered together and in pairs (n = 2–6 factors or levels per effect). Specific illustrations of fixed effects are shown in subsequent subpanels. B Differences in organoid size distribution for four representative patient sources. 5 µl organoid cultures were measured for cross-sectional area by brightfield imaging on day 7. C Differences in organoid size distribution at 2, 5, 7, 10, 12 and 14 days. The 5 µl organoid culture was measured longitudinally as in (B). D Differences in organoid size distribution between 2 µl, 5 µl, and 7 µl cultures. The patient-derived sample was measured on day 7 as in (B). E Overlapping variance of downsampled technical replicates among organoid culture volumes. Organoid counts in the larger volumes of three patients were repeatedly downsampled to the 2 µl median (n = 1000 iterations; tan), and variance was estimated after shifted log transformation (see Methods). Variance estimates of the entire organoid count from each volume and technical replicate are overlaid (black). See Additional file 3: Fig. S9 for analysis of additional patients. For (BD), size distributions are summarized by their cumulative distribution function
Fig. 5
Fig. 5
Patient-specific sensitivity of zero-passage organoids to hormone withdrawal and tamoxifen treatment AF Upper panels show mean organoid area at six time points after shifted log transformation (n = 22–1407 organoids per patient, time point, and condition; see Methods) for control cultures (gray), cultures with β-estradiol withdrawn (β-est; black), and cultures with β-est withdrawn plus 200 nM 4-hydroxytamoxifen (4-HT; yellow) or 3 µM 4-HT (orange) on day 5. Overlaid are non-linear least-squares curve fits for area growth as a function of volumetric growth rate. Pathologic estimates of positivity for estrogen receptor (ESR1) and progesterone receptor (PGR) are reported as cellular percentages in the inset. Lower panels summarize the best-fit per-day (d−1) volumetric growth rate for each condition with 90% confidence intervals estimated by support plane analysis. *P < 0.05 after Bonferroni correction for multiple-hypothesis testing
Fig. 6
Fig. 6
Zero-passage organoid compatibility with lentiviral transduction and genetic modification. A Representative image of one organoid transduced with a mixture of lentiviruses encoding EGFP (green) and TdTomato (magenta). Scale bar is 50 µm. B Quantification of organoids containing cells expressing one or more fluorophores. Percent fluorescence positive ( +) is reported as the mean ± standard deviation from n = 4 independent luminal breast cancers. Differences in organoid sizes were assessed by two-way ANOVA (n = 11–27 organoids per group). C Map of the pDual_dsCas9_Venus lentiviral plasmid encoding destabilized Cas9 fused by a P2A sequence with Venus. Cloning sites for coexpressed dual-sgRNAs are indicated. D Harvesting single Venus-positive organoids for genotyping. Fluorescent organoids confirmed by epifluorescence (top right) are harvested by micropipette aspiration (before: bottom left; after: bottom right). Scale bars are 50 µm (top) and 250 µm (bottom). E and F Single-organoid genotyping of zero-passage cultures transduced with pDual_dsCas9_Venus targeting a noncoding region of human chromosome 1 (E) or chromosome 2 (F). The first lane is a PCR negative control (no genomic DNA), the second lane is a nontargeting control (single organoid transduced with empty pDual_dsCas9_Venus), and the subsequent three lanes are single organoids transduced with dual-sgRNAs. DNA markers are on the left and PCR band sizes for wild-type and knockout amplicons are on the right. Relative efficacy of targeting is indicated on the bottom of the gel
Fig. 7
Fig. 7
Combinatorial NQO1 depletion and sulforaphane treatment of zero-passage organoids yields three classes of patient-specific responses. A Experiment design for targeting and detecting deletion of NQO1. Dual-sgRNAs targeting required exons are in orange and genotyping PCR primers are in blue. B Single organoid genotyping of zero-passage cultures transduced with pDual_dsCas9_Venus targeting NQO1 as in (A). The first lane is a PCR negative control (no genomic DNA), the second lane is a nontargeting control (single organoid transduced with empty pDual_dsCas9_Venus), and the subsequent three lanes are single organoids transduced with dual-sgRNAs. DNA markers are on the left and PCR band sizes for wild-type and knockout amplicons are on the right. Relative efficacy of targeting is indicated on the bottom of the gel. The rightmost lane was contrast-enhanced independently for better visibility of the bands due to low genomic DNA content. CE Upper panels show mean organoid area at six time points after shifted log transformation (n = 17–1661 organoids per patient, time point, and condition; see Methods) for control cultures transduced with Cas9 only (gray), cultures with dual-sgRNAs (dsgRNAs) targeting a noncoding region of chromosome 1 (Chr1) targeted (black), and cultures with NQO1 targeted with dsgRNA (purple). Genotypes were treated with 10 µM sulforaphane (SF, yellow boxes) or 0.1% DMSO control. Overlaid are non-linear least-squares curve fits for growth as a function of volumetric growth rate and genotype. Lower panels summarize the best-fit per-day (d−1) volumetric growth rate for each condition with 90% confidence intervals estimated by support plane analysis. *P < 0.05 after Bonferroni correction for multiple-hypothesis testing for the indicated pairwise comparisons. #P < 0.05 indicating both dsgNQO1 conditions are less than the corresponding dsgChr1 condition. The inset of the lower panel of (C) illustrates the potential relationships between sulforaphane (SF), the transcription factor NFE2L2, its target NQO1, and organoid growth. See Additional file 3: Fig. S14 for analysis of additional patients

Update of

References

    1. Ignatiadis M, Sotiriou C. Luminal breast cancer: from biology to treatment. Nat Rev Clin Oncol. 2013;10(9):494–506. - PubMed
    1. Thompson A, Brennan K, Cox A, Gee J, Harcourt D, Harris A, Harvie M, Holen I, Howell A, Nicholson R, et al. Evaluation of the current knowledge limitations in breast cancer research: a gap analysis. Breast Cancer Res. 2008;10(2):R26. - PMC - PubMed
    1. Holliday DL, Speirs V. Choosing the right cell line for breast cancer research. Breast Cancer Res. 2011;13(4):215. - PMC - PubMed
    1. Ortiz MMO, Andrechek ER. Molecular characterization and landscape of breast cancer models from a multi-omics perspective. J Mammary Gland Biol Neoplasia. 2023;28(1):12. - PMC - PubMed
    1. Mohibi S, Mirza S, Band H, Band V. Mouse models of estrogen receptor-positive breast cancer. J Carcinog. 2011;10:35. - PMC - PubMed

MeSH terms