. 2024 Dec 17:18:1474066.
doi: 10.3389/fnbeh.2024.1474066. eCollection 2024.

Selective deletion of Tsc1 from mouse cerebellar Purkinje neurons drives sex-specific behavioral impairments linked to autism

Affiliations

Selective deletion of Tsc1 from mouse cerebellar Purkinje neurons drives sex-specific behavioral impairments linked to autism

Ryan J Lawson et al. Front Behav Neurosci. .

Abstract

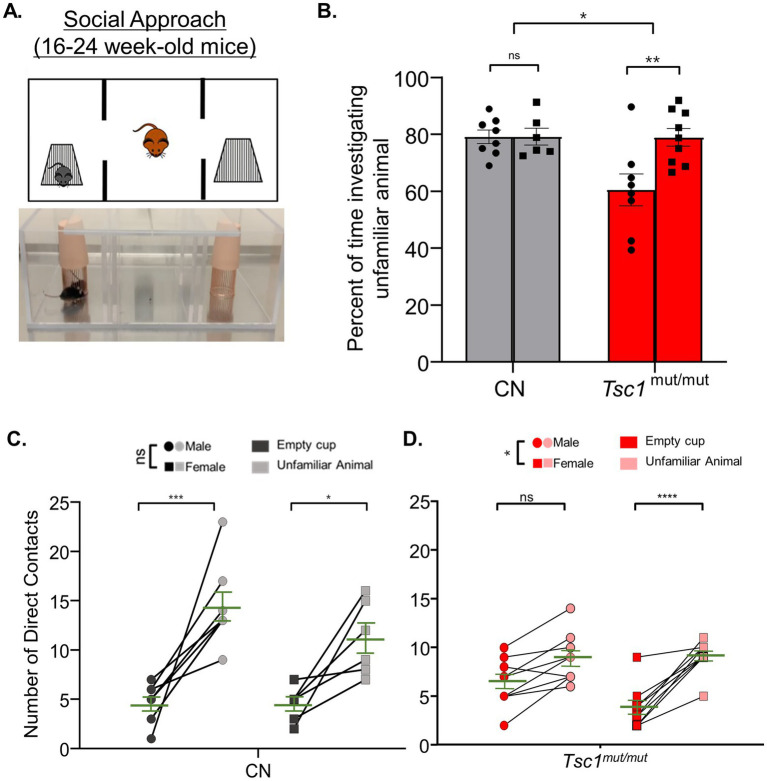
There is a striking sex bias in the prevalence and severity of autism spectrum disorder (ASD) with 80% of diagnoses occurring in males. Because the molecular etiology of ASD is likely combinatorial, including interactions across multiple genetic and environmental factors, it is difficult to investigate the physiological mechanisms driving sex-specific differences. Loss of function mutations in TSC1 result in dysregulated mTORC1 signaling and underlie a multi-system disorder known as tuberous sclerosis (TSC). Interestingly, more than 50% of individuals diagnosed with TSC are also diagnosed with ASD, making TSC mutations one of the most prevalent monogenic causes of ASD. Mice harboring targeted deletion of Tsc1 selectively in cerebellar Purkinje neurons, referred to here as Tsc1mut/mut , have multiple ASD-linked behavioral impairments, including deficits in social interactions, motor coordination, and vocalizations. However, these ASD-linked behavioral deficits have only been investigated using male Tsc1mut/mut animals. Here, we used cohorts of male and female Tsc1mut/mut animals to determine if behavioral impairments, previously identified in this model, are similar across sex. Specifically, we measured balance and motor coordination and social interaction behaviors in two age groups across sex. We determined balance and motor coordination deficits are similar in male and female Tsc1mut/mut mice, and that deficits in the firing of Tsc1mut/mut Purkinje neurons located in the cerebellar vermis are also similar across sex. However, impairments in social approach behavior were found to be significantly more severe in Tsc1mut/mut males compared to females. These results indicate the selective deletion of Tsc1 in Purkinje neurons differentially impairs cerebellar circuits based on sex.

Keywords: TSC; cerebellum; motor coordination; sexual dimorphism; social interaction; tuberous sclerosis.


Conflict of interest statement

The authors declare that the research was conducted in the absence of any commercial or financial relationships that could be construed as a potential conflict of interest.

Figures

Figure 1
Figure 1
Cre recombinase expression on the L7-Pcp2 promoter drives selective Tsc1 deletion in mouse cerebellar Purkinje neurons. (A) Depicts the breeding strategy for Purkinje neuron-specific Tsc1 deletion. Heterozygous or homozygous animals with loxP sites flanking Tsc1 were crossed with mice hemizygous for the Cre recombinase gene under control of a L7-Pcp2 promoter. To verify the Purkinje neuron-specific expression of Cre recombinase, Cre-positive animals were crossed with a Cre reporter strain in which a loxP-flanked STOP cassette prevents expression of a CAG promoter-driven tdTomato gene. In (B), 20x (left) and 63x (right) confocal images of 25 μm parasagittal cerebellar sections were taken from adult tdTomato Cre-reporter mice expressing Cre on the L7-Pcp2 promotor.
Figure 2
Figure 2
Tsc1 deletion results in reduced membrane excitability in Purkinje neurons from male and female mice. (A) 350 μm parasagittal cerebellar sections were acutely isolated for whole cell patch-clamp recordings. In panel (B), representative simple spike activity is presented from wild type and Tsc1mu/mut adult Purkinje neurons. (C) In Tsc1mut/mut Purkinje neurons, mean ± SEM spontaneous firing frequency is significantly lower than wild type Purkinje neurons. Within each genotype, mean ± SEM firing frequency is not significantly different across sex. Evoked firing was measured during 0.1–0.3 nA depolarizing current injections after a common −0.5 nA hyperpolarizing step (D). (E) Compared to wild type controls, mean ± SEM evoked firing frequencies were significantly lower in Tsc1mut/mut cells, and not different across male and female cells from either genotype. (F) Mean ± SEM measures of capacitance were not significantly different across male and female Tsc1mut/mut cells. Mean input resistance was determined to be significantly lower in male Tsc1mut/mut Purkinje neurons. Input resistance and capacitance did not differ between wild type male and female Purkinje neurons (data not shown).
Figure 3
Figure 3
No sex-specific differences were found in performance on the 10 mm elevated balance beam in 9–11 week-old and 16–24 week-old mice. (A) A cartoon depiction of the elevated balance beam testing setup is shown. (B) 9–11 week-old Tsc1mut/mut (N = 13 males and N = 11 females), Tsc1mut/wt (N = 10 males and N = 10 females), and control (CN, N = 11 males and N = 10 females) mice were tested on a 10 mm (width) elevated balance beam. Across the four testing days, the mean time to cross of Tsc1mut/mut mice (of both sexes) took significantly (p < 0.0001, RM two-way ANOVA) longer to cross than Tsc1mut/wt and control mice. (C) The same was true for the number of hindlimb foot-slips (p < 0.0001, RM two-way ANOVA). Tsc1mut/wt and control cohorts performed similarly. Within each genotype, male and female animals performed similarly across the four testing days. Mean ± SEM values are plotted. Mean ± SEM results are plotted for 16–24 week-old Tsc1mut/mut (N = 9 males and N = 10 females) and control (N = 10 males and N = 8 females) mice on the 10 mm (width) elevated balance beam in D-E. Within each genotype, male and female animals performed similarly across the four testing days. (D) Tsc1mut/mut mice took significantly longer to cross (p < 0.001, RM two-way ANOVA) than CN mice across testing days. (E) Tsc1mut/mut mice had significantly more hindlimb foot-slips (p < 0.001, RM two-way ANOVA) than CN mice across testing days.
Figure 4
Figure 4
Social approach deficits are similar across males and females in control and Tsc1 mutant animals. 9–11 week-old male and female Tsc1mut/mut (N = 13 males and N = 11 females), Tsc1mut/wt (N = 10 males and N = 10 females), and control (CN, N = 11 males and N = 10 females) mice were tested for social approach preference using the three-chamber apparatus depicted in in panel (A). Photograph and cartoon depictions show the test animal, unfamiliar stranger mouse (in the left chamber), and empty wire cup (in the right chamber). (B) Tsc1mut/mut mice spent a significantly (p < 0.05, two-way ANOVA) smaller proportion of time investigating the unfamiliar animal compared to Tsc1mut/wt and control mice. No differences were recorded between sexes. In panels (C–E), the number of contacts with the empty cup and the unfamiliar animal is plotted for each test mouse for males and females of each genotype. Within each genotype, no significant difference was measured across sex for preference for contact with the unfamiliar animal. Individual values are plotted with the mean ± SEM shown in green (ns, not significant, *p < 0.05, **p < 0.01, Šídák’s corrected multiple comparisons tests used in two-way ANOVAs).
Figure 5
Figure 5
In 16–24 week-old Tsc1mut/mut mice, social approach deficits are more severe in males compared to females. 16–24 week-old male and female Tsc1mut/mut (N = 8 males and N = 9 females) and control (CN, N = 8 males and N = 6 females) mice were tested using the three-chamber apparatus for social approach preference depicted in panel (A,B). Tsc1mut/mut mice spent a significantly (p < 0.05, two-way ANOVA) lesser percentage of time investigating the unfamiliar animal compared to controls. Male Tsc1mut/mut mice spent a significantly (p < 0.05, two-way ANOVA) lesser percentage of time investigating the unfamiliar animal compared to Tsc1mut/mut females. In panels (C,D), the number of contacts with the empty cup and the unfamiliar animal is plotted for male and female test mice of control and Tsc1mut/mut genotypes. Male Tsc1mut/mut mice showed a significantly (p < 0.05, two-way ANOVA) lesser preference for contact with the unfamiliar animal than Tsc1mut/mut females. No difference between sexes was recorded in the control group. Individual values are plotted with the mean ± SEM shown in green (ns, not significant, *p < 0.05, **p < 0.01, ***p < 0.001; ****p < 0.0001, Šídák’s corrected multiple comparison tests used in two-way ANOVAs).
Figure 6
Figure 6
Sex-specific differences in social novelty preference occur in Tsc1 mutant and control groups. 9–11 week-old male and female Tsc1mut/mut (N = 13 males and N = 11 females), Tsc1mut/wt (N = 10 males and N = 10 females), and control (CN, N = 11 males and N = 10 females) mice were tested for preference for social novelty using the three-chamber apparatus depicted in panel (A). In the photograph and cartoon depiction, the test mouse in the center chamber is free to interact with an unfamiliar or familiar animal in the two side chambers. Panels B-E. show results for 9–11 week-old animal testing and panels (F–H). show results for 16–24 week-old animal tests. (B) Female control and Tsc1mut/wt mice investigated the unfamiliar animal a significantly lesser percentage of time (CN: p < 0.001, two-way ANOVA, Tsc1mut/wt: p < 0.01, two-way ANOVA) compared to males. No significant differences were measured between genotypes. (C) For the Tsc1mut/mut and Tsc1mut/wt groups, females had significantly (p < 0.01, two-way ANOVA) lower preference for direct contact with the unfamiliar animal compared to males. Mean ± SEM values are plotted in (B). In panel (C), individual values are plotted with the mean ± SEM shown in green (ns, not significant, *p < 0.05, **p < 0.01, *** p < 0.001; ****p < 0.0001, Šídák’s corrected multiple comparison tests used in two-way ANOVAs). (F) In 16–24 week-old Tsc1mut/mut (N = 8 males and N = 9 females) and control (N = 8 males and N = 6 females) cohorts, Tsc1mut/mut mice spent significantly (p < 0.05, two-way ANOVA) less time investigating the unfamiliar mouse than controls. (G,H) Tsc1mut/mut mice had no preference for direct contact with the familiar mouse. No differences between sex were measured in control (G) or Tsc1mut/mut (H) animals. Mean ± SEM values are plotted in F. In panel G-H., individual values are plotted with the mean ± SEM shown in green (ns, not significant, * p < 0.05, ** p < 0.01, *** p < 0.001, Šídák’s corrected multiple comparison tests used in two-way ANOVAs).

Update of

References

    1. Andersen B. B., Korbo L., Pakkenberg B. (1992). A quantitative study of the human cerebellum with unbiased stereological techniques. J. Comp. Neurol. 326, 549–560. doi: 10.1002/cne.903260405, PMID: - DOI - PubMed
    1. Andersson G. W., Gillberg C., Miniscalco C. (2013). Pre-school children with suspected autism Spectrum disorders: do girls and boys have the same profiles? Res. Dev. Disabil. 34, 413–422. doi: 10.1016/j.ridd.2012.08.025, PMID: - DOI - PubMed
    1. Au K. S., Williams A. T., Steve Roach E., Batchelor L., Sparagana S. P., Delgado M. R., et al. . (2007). Genotype/phenotype correlation in 325 individuals referred for a diagnosis of tuberous sclerosis complex in the United States. Genet. Med. 9, 88–100. doi: 10.1097/GIM.0b013e31803068c7, PMID: - DOI - PubMed
    1. Bailey A., Luthert P., Dean A., Harding B., Janota I., Montgomery M., et al. . (1998). A Clinicopathological study of autism. Brain J. Neurol. 121 May, 889–905. doi: 10.1093/brain/121.5.889, PMID: - DOI - PubMed
    1. Barski J. J., Dethleffsen K., Meyer M. (2000). Cre recombinase expression in cerebellar purkinje cells. Genesis 28, 93–98. - PubMed

LinkOut - more resources