. 2024 Mar 25:2024:1506083.
doi: 10.1155/2024/1506083. eCollection 2024.

Attenuating Atherosclerosis through Inhibition of the NF- κ B/NLRP3/IL-1 β Pathway-Mediated Pyroptosis in Vascular Smooth Muscle Cells (VSMCs)

Affiliations

Attenuating Atherosclerosis through Inhibition of the NF- κ B/NLRP3/IL-1 β Pathway-Mediated Pyroptosis in Vascular Smooth Muscle Cells (VSMCs)

Shihuan Li et al. Cardiovasc Ther. .

Abstract

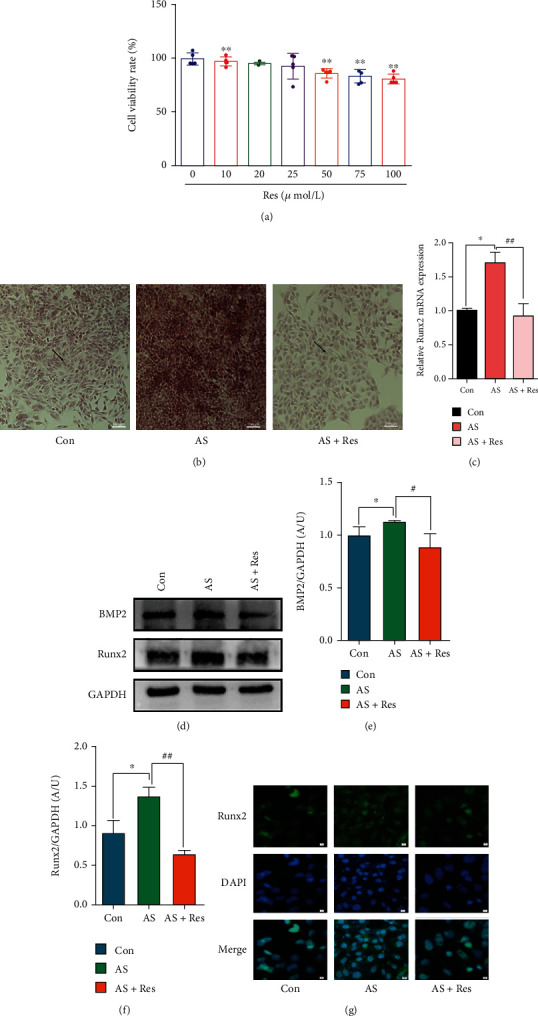
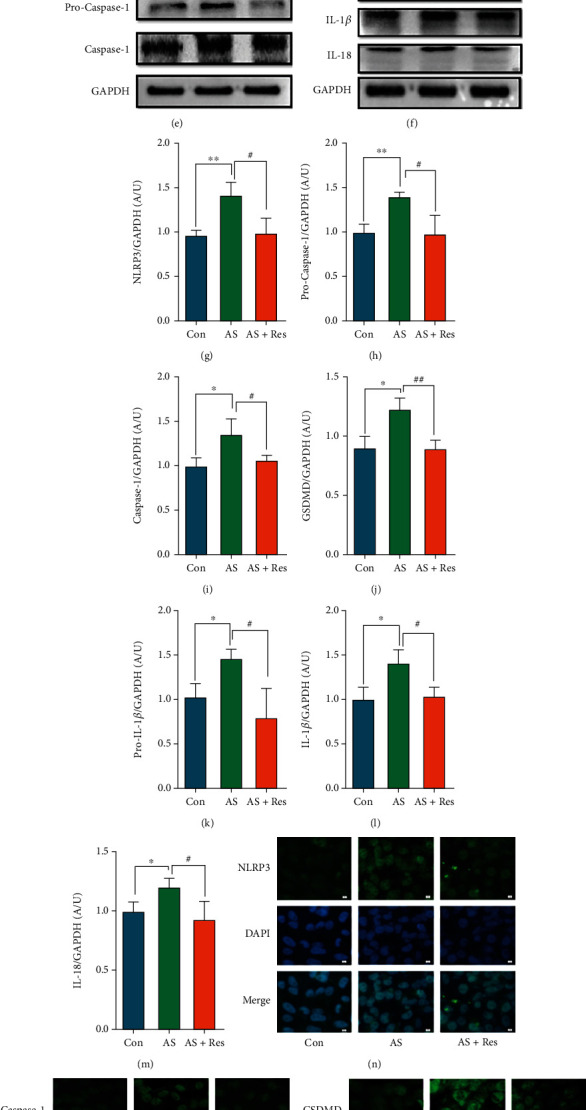
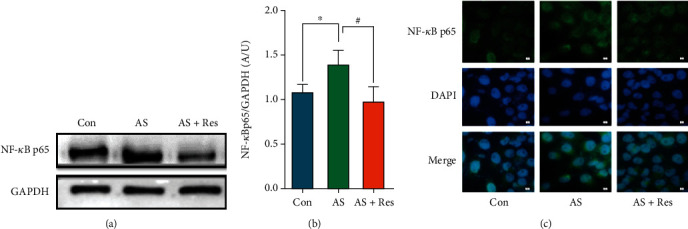
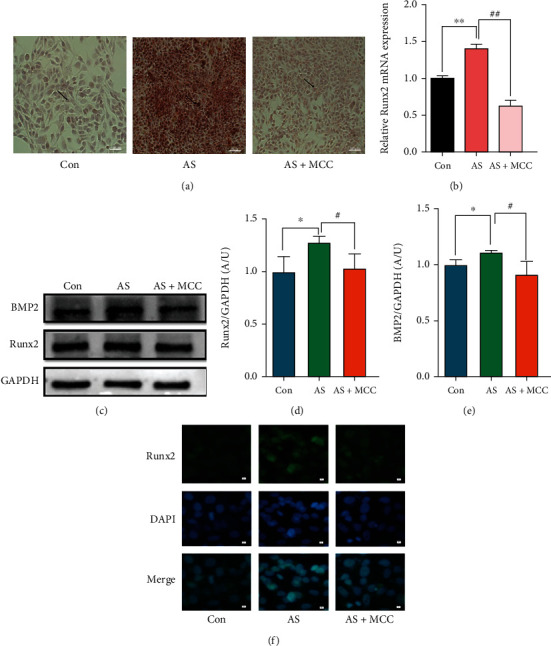
Objective: We investigated the effects of resveratrol (Res) and MCC950 on the pyroptosis of vascular smooth muscle cells (VSMCs) and the potential pathway.

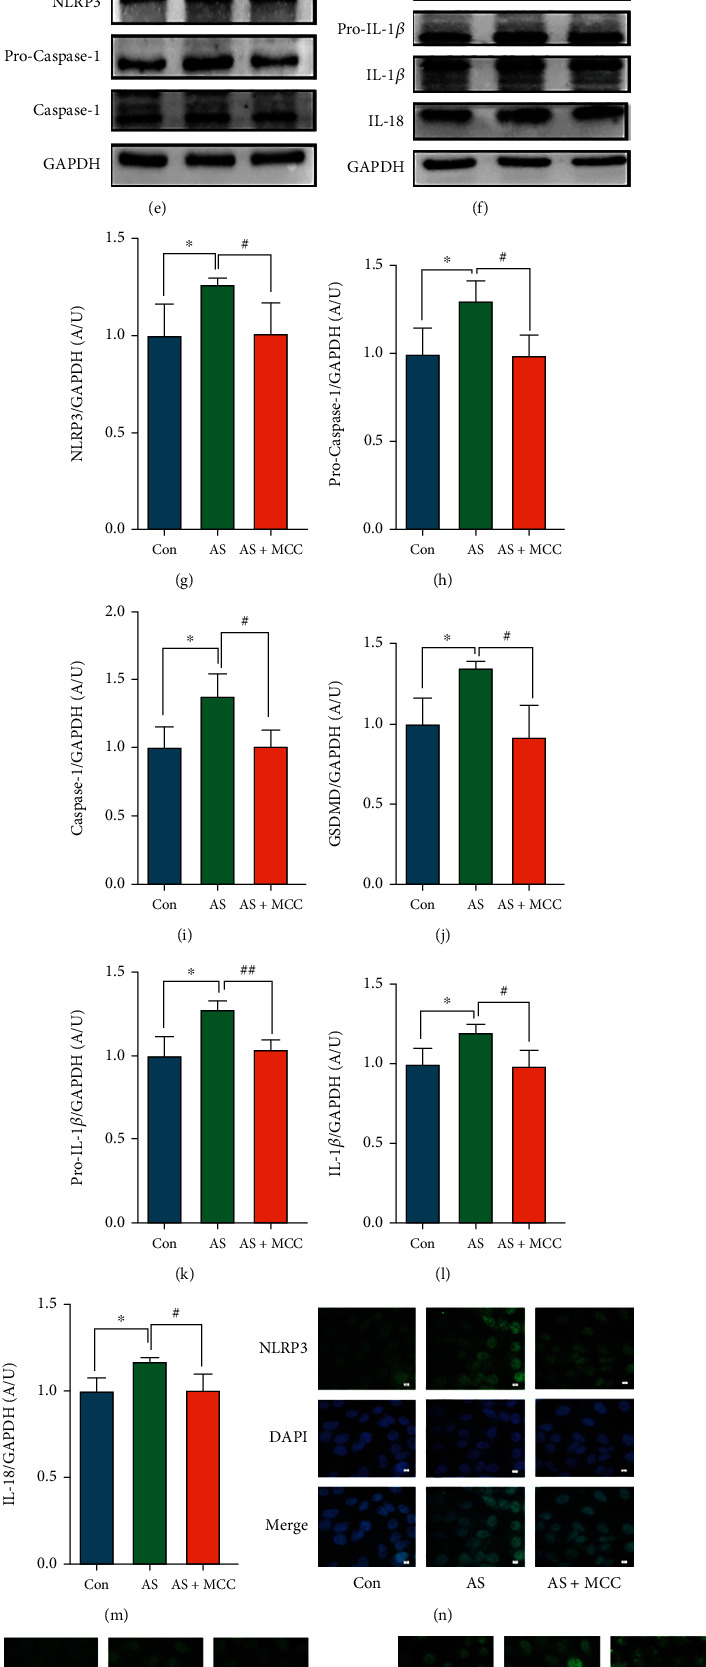
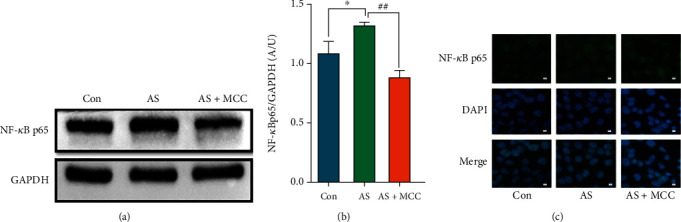
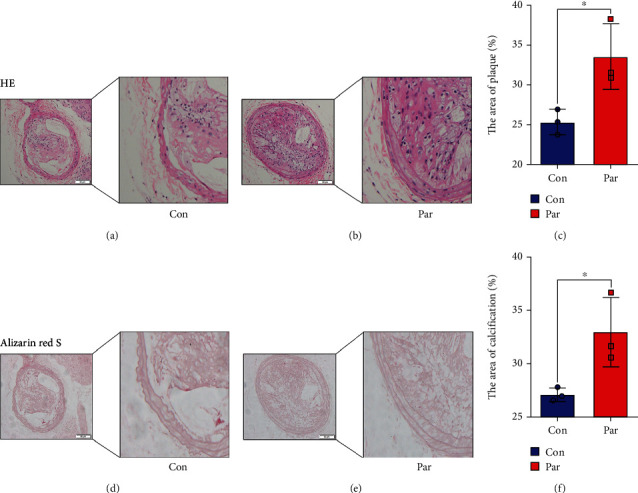
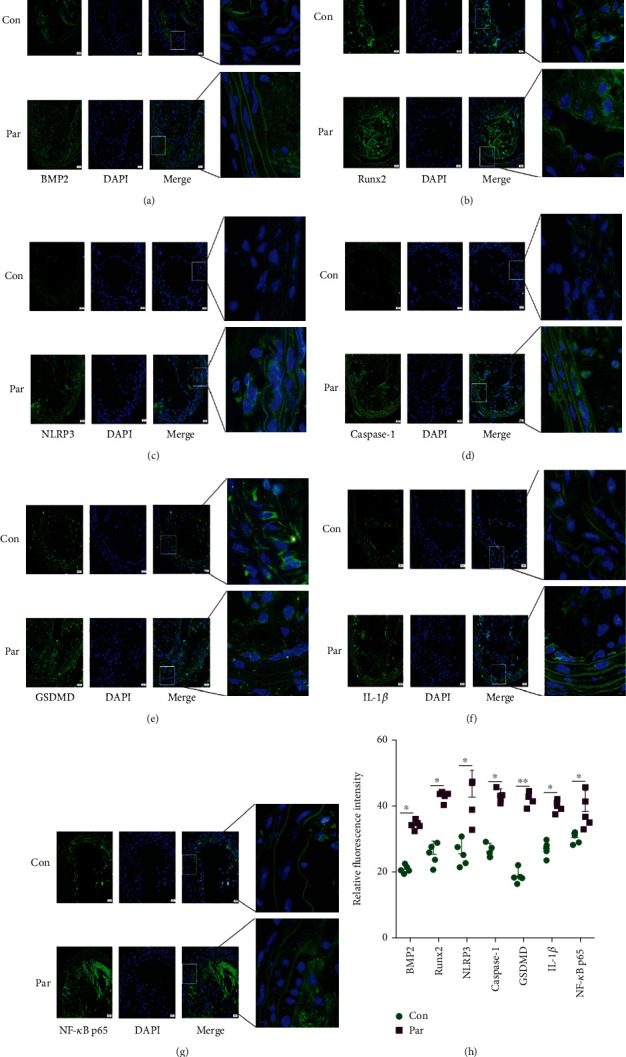
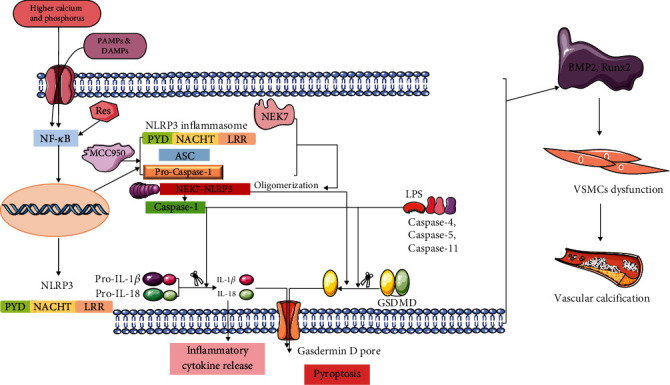
Methods and results: Compared with the control (Con) group, the atherosclerosis (AS) group showed calcified nodules, which suggested that the calcification medium induced the calcification of VSMCs. VSMCs showed proliferative activity and significantly attenuated calcification under treatment with 10 μmol/L Res. The calcium salt was detected by alizarin red S staining. Res and MCC950 downregulated the calcification, inflammatory, pyroptosis, and transcription factor-related indicators all decreased by RT-qPCR with Western blot and immunofluorescence. The results showed that Res and MCC950 refrained the calcification of VSMCs and that Res has a better effect than MCC950. Plaques and calcium salt deposits were present in the carotid region in the control group. More calcium salt deposits were evident in the plaques of the Par group by HE staining and alizarin red S staining. The calcification indexes BMP2, Runx2, and related indexes declined by immunofluorescence, which showed parthenolide-inhibited AS. The related protein expressions were consistent with the expression of the cell experiments.

Conclusion: Our data demonstrated that inflammatory response and pyroptosis exacerbate AS and unravel the link between VSMCs and the progression of AS lesions. Res and MCC950 inhibited the calcification of VSMCs by regulating NF-κB/NLRP3/IL-1β signaling axis. P53 can exacerbate the AS lesions by acting on NLRP3 inflammasome and pyroptosis. Our findings supported the clinical applications of Res and MCC950 in VSMCs individuals to counteract pyroptosis and AS, and P53 inhibitors also can be a potential treatment for AS.


Conflict of interest statement

The authors declare no competing interests.

Figures

Figure 1
Figure 1
VSMCs (CRL-1999) were treated with Res (10 μM) for the indicated time. (a) Effects of different concentrations of Res on proliferation activity of VSMCs. Data are expressed as mean ± SEM. ∗∗P < 0.01, vs. 0 μmol/L. (b) Calcium deposition in VSMCs was assessed by alizarin red S staining (positive staining: red; scale bar = 100 μm). (c) The mRNA level of Runx2 was determined by qPCR. Data are expressed as mean ± SEM. P < 0.05 vs. control group; ##P < 0.01 vs. AS group. (d) The protein levels of BMP2 and Runx2 were determined by western blotting. (e, f) Quantification of the results shown in (c). Data are expressed as mean ± SEM. P < 0.05 vs. control group; #P < 0.05, ##P < 0.01 vs. AS group. (g) Representative immunofluorescent staining images for Runx2 (green) (magnification: ×400, scale bar = 20 μm).
Figure 2
Figure 2
VSMCs (CRL-1999) were treated with Res (10 μM) for indicated time. (a–d) The mRNA levels of NLRP3 and caspase-1, GSDMD, and IL-1β were determined by qPCR. Data are expressed as mean ± SEM. ∗∗P < 0.01 vs. control group; #P < 0.05, ##P < 0.01 vs. AS group. (e, f) The protein levels of NLRP3 and pro-caspase-1, caspase-1, GSDMD, and pro-IL-1β, IL-1β, and IL-18 were determined by western blotting. (g–m) Quantification of the results shown in (e, f). Data are expressed as mean ± SEM. P < 0.05, ∗∗P < 0.01 vs. control group; #P < 0.05, ##P < 0.01 vs. AS group. (n–q) Representative immunofluorescent staining images for NLRP3 and caspase-1, GSDMD, and IL-1β (green) (magnification: ×400, scale bar = 20 μm).
Figure 3
Figure 3
VSMCs (CRL-1999) were treated with Res (10 μm) for the indicated time. (a) The protein level of NF-κB p65 was determined by western blotting. (b) Quantification of the results shown in (a). Data are expressed as mean ± SEM. P < 0.05 vs. control group; #P < 0.05 vs. AS group. (c) Representative immunofluorescent staining images for NF-κB p65 (green) (magnification: ×400, scale bar = 20 μm).
Figure 4
Figure 4
VSMCs (CRL-1999) were treated with NLRP3 inhibitor (MCC950; 2nM) for indicated time. (a) Calcium deposition in VSMCs was assessed by alizarin red S staining (positive staining: red; scale bar = 100 μm). (b) The mRNA levels of Runx2 were determined by qPCR. Data are expressed as mean ± SEM. ∗∗P < 0.01 vs. control group; ##P < 0.01 vs. AS group. (c) The protein levels of BMP2 and Runx2 were determined by western blotting. (d, e) Quantification of the results shown in (c). Data are expressed as mean ± SEM. P < 0.05 vs. control group; #P < 0.05 vs. AS group. (f) Representative immunofluorescent staining images for Runx2 (green) (magnification: ×400, scale bar = 20 μm).
Figure 5
Figure 5
VSMCs (CRL-1999) were treated with NLRP3 inhibitor (MCC950: 2nM) for indicated time. (a–d) The mRNA levels of NLRP3 and caspase-1, GSDMD, and IL-1β were determined by qPCR. Data are expressed as mean ± SEM. ∗∗P < 0.01 vs. control group; #P < 0.05, ##P < 0.01 vs. AS group. (e, f) The protein levels of NLRP3 and pro-caspase-1, caspase-1, GSDMD, and pro-IL-1β, IL-1β, and IL-18 were determined by western blotting. (g–m) Quantification of the results shown in (e, f). Data are expressed as mean ± SEM. P < 0.05 vs. control group; #P < 0.05 vs. AS group. (n–q) Representative immunofluorescent staining images for NLRP3 and caspase-1, GSDMD, and IL-1β (green) (magnification: ×400, scale bar = 20 μm).
Figure 6
Figure 6
VSMCs (CRL-1999) were treated with NLRP3 inhibitor (MCC950: 2 nM) for the indicated time. (a) The protein levels of NF-κB p65 were determined by western blotting. (b) Quantification of the results shown in (a). Data are expressed as mean ± SEM. P < 0.05 vs. control group; ##P < 0.01 vs. AS group. (c) Representative immunofluorescent staining images for NF-κB p65 (green) (magnification: ×400, scale bar = 20 μm).
Figure 7
Figure 7
The carotid arteries of ApoE-/-male mice. (a, b) Histopathologic assessment of the vascular of ApoE-/-mice after feed high fat feed intraperitoneal and injection of Par (5mg/kg) for 16 weeks. Shown are representative H&E-stained sections of carotid arteries from two independent experiments (n = 7; positive staining: brown to black; scale bar = 100 μm). (c) Quantification of the results shown in (a, b). Data are expressed as mean ± SEM. P < 0.05 vs. control group. (d, e) Calcification was assessed by alizarin red staining (positive staining: red; scale bar = 100 μm). (f) Quantification of the results shown in (d, e). Data are expressed as mean ± SEM. P < 0.05 vs. control group.
Figure 8
Figure 8
The carotid arteries of ApoE-/-male mice. (a–g) Representative immunofluorescent staining images for BMP2 and Runx2, NLRP3 and Caspase-1, GSDMD and IL-1β, and NF-κB p65 (green) (magnification: ×400, scale bar = 20 μm). (h) Quantification of the results shown in (a–g). Data are expressed as mean ± SEM. P < 0.05, ∗∗P < 0.01 vs. control group.
Figure 9
Figure 9
A graphic illustration of the mechanism action of Res, MCC950, and P53 in AS-associated VC.

Similar articles

Cited by

References

    1. AlSiraj Y., Thatcher S. E., Liang C. L., Ali H., Ensor M., Cassis L. A. Therapeutic assessment of combination therapy with a neprilysin inhibitor and angiotensin type 1 receptor antagonist on angiotensin II-induced atherosclerosis, abdominal aortic aneurysms, and hypertension. The Journal of Pharmacology and Experimental Therapeutics . 2021;377(3):326–335. doi: 10.1124/jpet.121.000525. - DOI - PMC - PubMed
    1. Durham A. L., Speer M. Y., Scatena M., Giachelli C. M., Shanahan C. M. Role of smooth muscle cells in vascular calcification: implications in atherosclerosis and arterial stiffness. Cardiovascular Research . 2018;114(4):590–600. doi: 10.1093/cvr/cvy010. - DOI - PMC - PubMed
    1. Voelkl J., Luong T. T., Tuffaha R., et al. SGK1 induces vascular smooth muscle cell calcification through NF-κB signaling. The Journal of Clinical Investigation . 2018;128(7):3024–3040. doi: 10.1172/JCI96477. - DOI - PMC - PubMed
    1. Song N., Liu Z. S., Xue W., et al. NLRP3 phosphorylation is an essential priming event for inflammasome activation. Molecular Cell . 2017;68(1):185–197.e186. doi: 10.1016/j.molcel.2017.08.017. - DOI - PubMed
    1. Han X., Xu T., Fang Q., et al. Quercetin hinders microglial activation to alleviate neurotoxicity via the interplay between NLRP3 inflammasome and mitophagy. Redox Biology . 2021;44:p. 102010. doi: 10.1016/j.redox.2021.102010. - DOI - PMC - PubMed

MeSH terms

LinkOut - more resources