

Identification of Endoplasmic Reticulum Stress-Related Biomarkers in Coronary Artery Disease
- PMID: 39742022
- PMCID: PMC11236471
- DOI: 10.1155/2024/4664731
Identification of Endoplasmic Reticulum Stress-Related Biomarkers in Coronary Artery Disease
Abstract
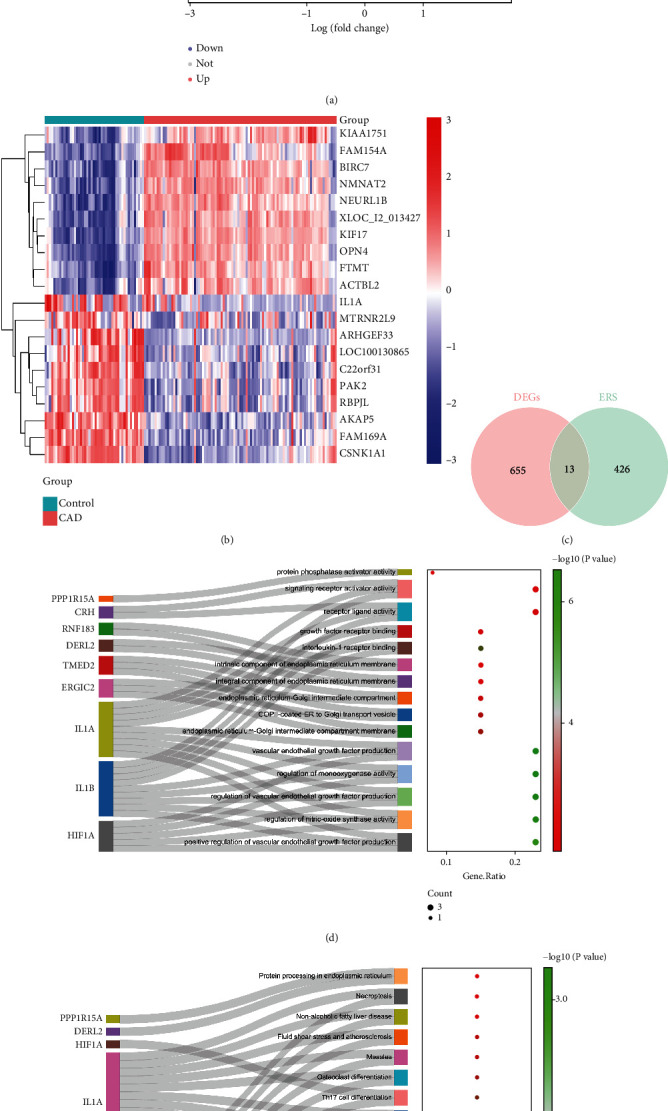
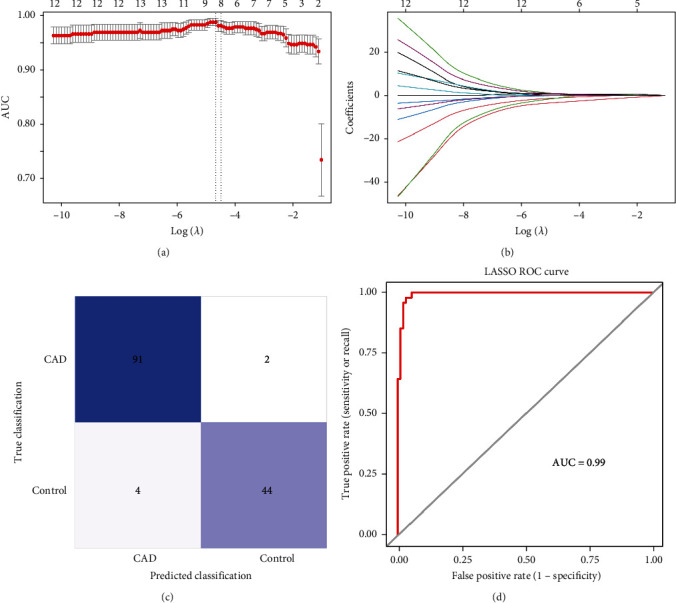
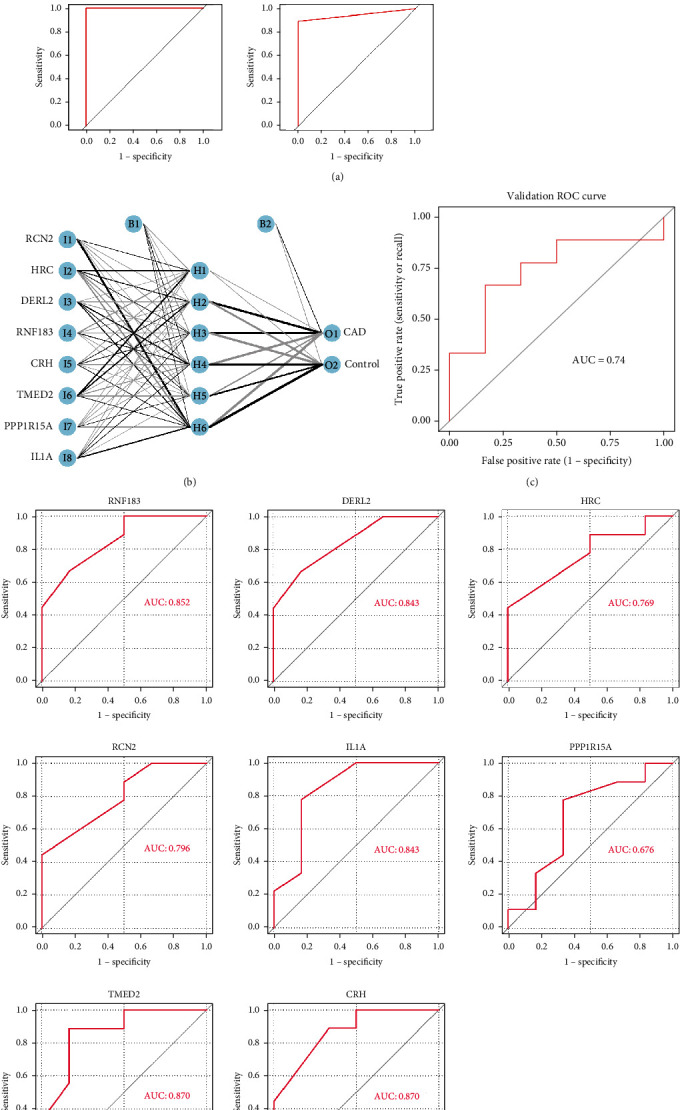
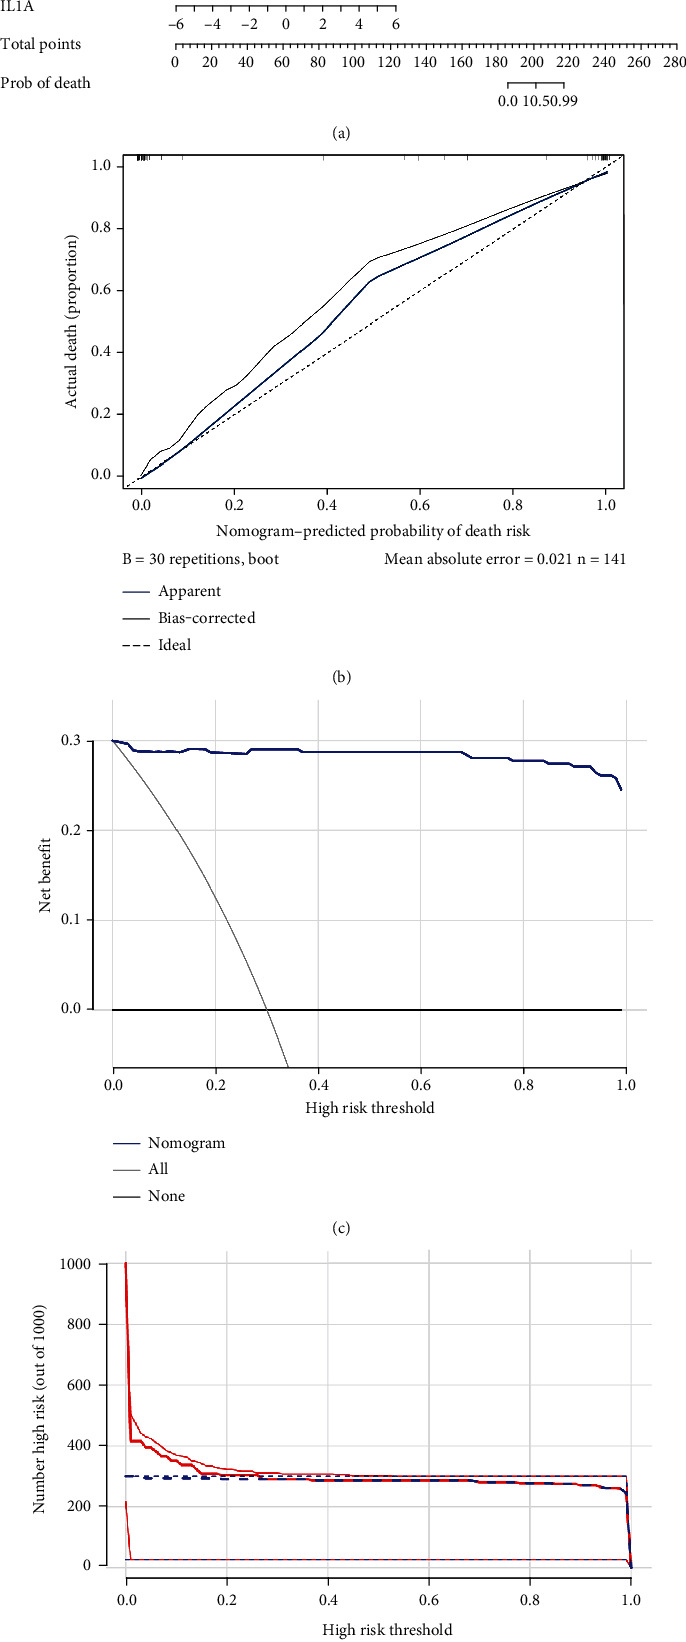
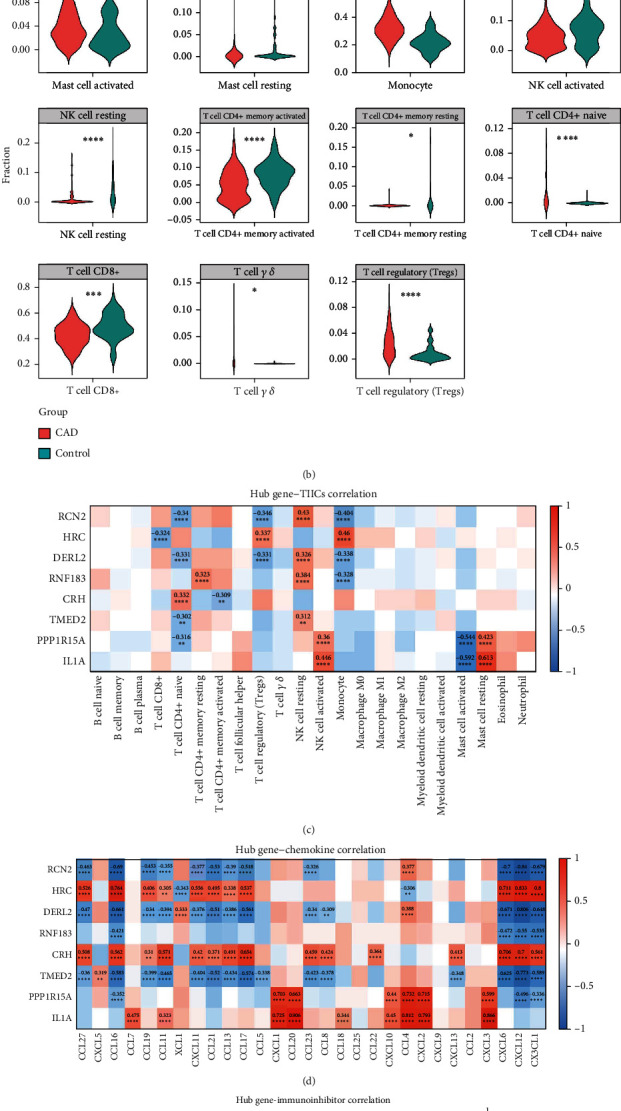
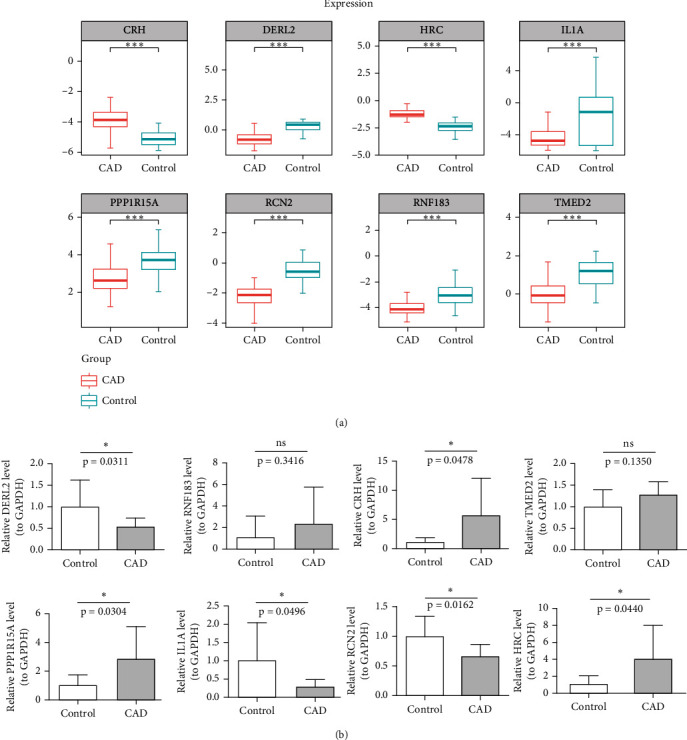
Coronary artery disease (CAD) is caused by atherosclerotic lesions in the coronary vessels. Endoplasmic reticulum stress (ERS) acts in cardiovascular disease, and its role in CAD is not clear. A total of 13 differentially expressed ERS-related genes (DEERSRGs) in CAD were identified. Functional enrichment analysis demonstrated the DEERSRGs were mainly enriched in endoplasmic reticulum (ER)-related pathways. Then, eight genes (RCN2, HRC, DERL2, RNF183, CRH, TMED2, PPP1R15A, and IL1A) were authenticated as ERS-related biomarkers in CAD by least absolute shrinkage and selection operator (LASSO). The receiver operating characteristic (ROC) analysis showed that the LASSO logistic model constructed based on biomarkers had a better diagnostic effect, which was confirmed by the ANN and GSE23561 datasets. Also, ROC results showed that seven of the eight biomarkers had better diagnostic effects. The nomogram model had good predictive power, and biomarkers were mostly enriched in pathways associated with CAD. The biomarkers were significantly associated with 10 immune cells, and RCN2, DERL2, TMED2, and RNF183 were negatively correlated with most chemokines. Eight biomarkers had significant correlations with both immunoinhibitors and immunostimulators. In addition, eight biomarkers were significantly different in both CAD and control samples, CRH and HRC were upregulated in CAD. The quantitative reverse transcription-polymerase chain reaction (qRT-PCR) showed that RCN2, HRC, DERL2, CRH, and IL1A were consistent with the bioinformatics analysis. RCN2, HRC, DERL2, RNF183, CRH, TMED2, PPP1R15A, and IL1A were identified as biomarkers of CAD. Functional enrichment analysis and immunoassays for biomarkers provide new ideas for the treatment of CAD.
Copyright © 2024 Yuanyuan Lin et al.
Conflict of interest statement
The authors declare no conflicts of interest.
Figures
Similar articles
-
Identification and verification of circRNA biomarkers for coronary artery disease based on WGCNA and the LASSO algorithm.BMC Cardiovasc Disord. 2024 Jun 17;24(1):305. doi: 10.1186/s12872-024-03972-2. BMC Cardiovasc Disord. 2024. PMID: 38880872 Free PMC article.
-
Identification of plasma miR-4505, miR-4743-5p and miR-4750-3p as novel diagnostic biomarkers for coronary artery disease in patients with type 2 diabetes mellitus: a case-control study.Cardiovasc Diabetol. 2024 Jul 29;23(1):278. doi: 10.1186/s12933-024-02374-0. Cardiovasc Diabetol. 2024. PMID: 39080630 Free PMC article.
-
Identification of potential biomarkers for atrial fibrillation and stable coronary artery disease based on WGCNA and machine algorithms.BMC Cardiovasc Disord. 2024 Aug 2;24(1):401. doi: 10.1186/s12872-024-04062-z. BMC Cardiovasc Disord. 2024. PMID: 39090590 Free PMC article.
-
Identification of potential M2 macrophage-associated diagnostic biomarkers in coronary artery disease.Biosci Rep. 2022 Dec 22;42(12):BSR20221394. doi: 10.1042/BSR20221394. Biosci Rep. 2022. PMID: 36222281 Free PMC article.
-
Characterization of LncRNA expression profile and identification of novel LncRNA biomarkers to diagnose coronary artery disease.Atherosclerosis. 2018 Aug;275:359-367. doi: 10.1016/j.atherosclerosis.2018.06.866. Epub 2018 Jun 18. Atherosclerosis. 2018. PMID: 30015300
References
MeSH terms
Substances
LinkOut - more resources
Full Text Sources
Medical
Miscellaneous
