. 2024 Dec 5:30:101377.
doi: 10.1016/j.mtbio.2024.101377. eCollection 2025 Feb.

A methotrexate labelled dual metal oxide nanocomposite for long-lasting anti-cancer theranostics

Affiliations

A methotrexate labelled dual metal oxide nanocomposite for long-lasting anti-cancer theranostics

Joyce L Y Tang et al. Mater Today Bio. .

Abstract

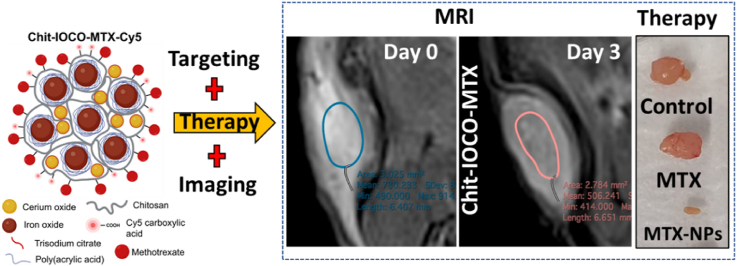
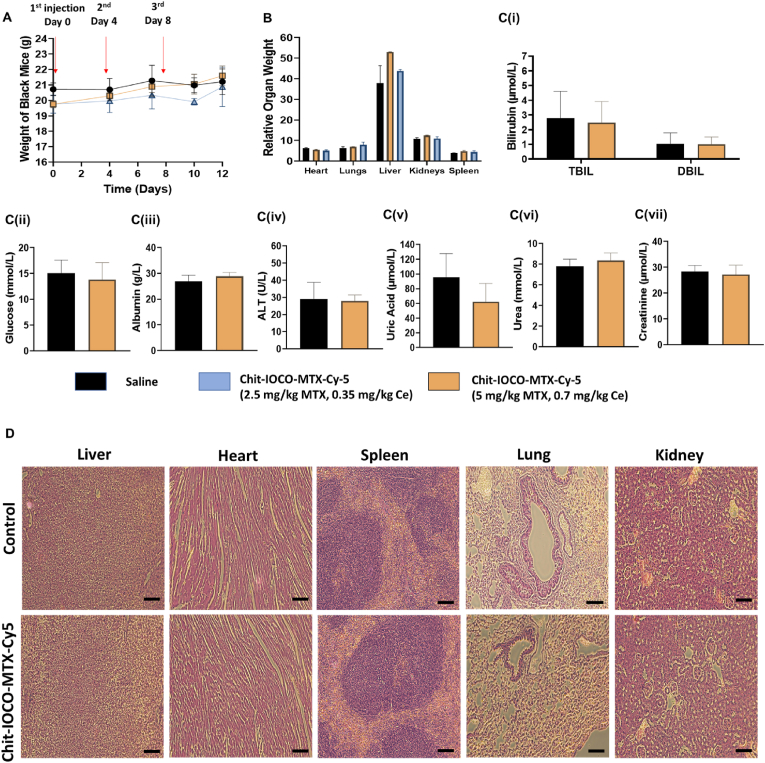
We explored the feasibility of a self-assembled chitosan nanocomposite incorporating cerium oxide/nanoceria and superparamagnetic iron oxide nanoparticles (Chit-IOCO NPs), conjugated with methotrexate (MTX) and Cy5 dye, as an integrated cancer theranostic nanosystem (Chit-IOCO-MTX-Cy5). In this system, nanoceria serves as an anti-cancer agent, while the superparamagnetic iron oxide nanoparticles function as a negative contrast agent for MR imaging. This dual metal oxide nanocomposite is conjugated with MTX which is a structural analogue of folate, serving both as a targeting mechanism for folate receptors on cancer cells and as a chemotherapeutic drug. Chit-IOCO-MTX-Cy5 exhibited exceptional negative contrast in T2 and T2∗-weighted MRI, achieving a high relaxivity of 409.5 mM⁻1 s⁻1 which is superior to clinically approved agents. The nanocomposite demonstrated both pro-oxidative and antioxidative properties, significantly increasing reactive oxygen species (ROS) production in U87MG cells (1.4-fold change), which triggered apoptosis in these cancer cells. Simultaneously, it exhibited ROS scavenging activity in non-malignant endothelial cells (0.8-fold change). Intravenous infusion of Chit-IOCO-MTX-Cy5 (5 mg/kg MTX) led to significant tumor growth inhibition, indicating a synergistic enhancement of anti-cancer effects when combining MTX and nanoceria, compared to free MTX or nanoceria without MTX conjugation. Importantly, after treatment cessation, tumours in the nanocomposite group did not re-grow, while those in the free MTX group rapidly did. In vivo MR and fluorescence imaging revealed improved uptake and retention of Chit-IOCO-MTX-Cy5 in tumours compared to nanoceria without MTX. Notably, biosafety and biochemical analyses in mice showed no significant differences between the Chit-IOCO-MTX-Cy5 treatment group and control groups.

Keywords: Cancer; Cerium oxide; Chitosan; Magnetic resonance imaging; Methotrexate; Nanoceria; Nanotheranostic; Reactive oxygen species.


Conflict of interest statement

The authors declare the following financial interests/personal relationships which may be considered as potential competing interests:Hang Thu Ta reports financial support was provided by 10.13039/501100000925National Health and Medical Research Council. Hang Thu Ta reports financial support was provided by 10.13039/501100001030National Heart Foundation of Australia. If there are other authors, they declare that they have no known competing financial interests or personal relationships that could have appeared to influence the work reported in this paper.

Figures

Image 1
Graphical abstract
Scheme 1
Scheme 1
Schematic diagram illustrating synthesis of Chit−IOCO−MTX with Cy5 as the fluorescent reporter (not drawn to scale). Chit−IOCO nanoparticles were prepared through the electrostatic self-assembly between the positively charged chitosan and negatively charged trisodium citrate coated cerium oxide (CO−TSC) and poly(acrylic acid) coated iron oxide (IO−PAA) nanoparticles. Methotrexate (MTX) and Cy5 with intrinsic carboxylic groups −COOH were conjugated to the amino groups −NH2 of Chit-IOCO through EDC amide coupling reaction.
Fig. 1
Fig. 1
Characterisation of IO−PAA, CO−TSC, Chit−IOCO, Chit-IOCO-Cy5 and Chit-IOCO-MTX-Cy5 nanoparticles. (A) (i) Nanoparticle size, polydispersity index (PDI) and zeta potential of IO−PAA. (ii) Dynamic light scattering size distribution of IO−PAA nanoparticles. (B) (i) Nanoparticle size, PDI and zeta potential of CO−TSC. (ii) Dynamic light scattering size distribution of CO−TSC nanoparticles. (C) (i) Nanoparticle size, PDI and zeta potential of Chit−IOCO. (ii) Dynamic light scattering size distribution of Chit−IOCO nanoparticles. (D) (i) Nanoparticle size, PDI and zeta potential of Chit−IOCO-Cy5. (ii) Dynamic light scattering size distribution of Chit−IOCO-Cy5 nanoparticles. (E) Illustrated structure of Chit−IOCO−MTX-Cy5 (not drawn to scale). (F) TEM image of Chit−IOCO−MTX−Cy5 at × 15 and × 40 magnifications. (G) (i) Dynamic light scattering size distribution of Chit−IOCO-MTX-Cy5 nanoparticles. (ii) Nanoparticle size, PDI and zeta potential of Chit−IOCO-MTX-Cy5. (iii) Mass percentage of NP components. MRI of Chit−IOCO−MTX−Cy5 phantoms. (H) Scheme of MR phantom preparation and MR scan position. (I) MRI images of Chit−IOCO−MTX−Cy5 phantoms. Chit−IOCO−MTX−Cy5 nanoparticles were diluted to different concentrations of iron (Fe), sealed in phantom vessels as illustrated in (H), and imaged using a 9.4 T MRI. (J) Relaxation rate (1/T2) plotted against Fe concentrations of Chit−IOCO−MTX−Cy5 using relaxation time (T2) automatically generated from T2-weighted scans by the operating system.
Fig. 2
Fig. 2
Anti-cancer effects of free methotrexate (MTX), Chit-IOCO-Cy5 and Chit-IOCO-MTX-Cy5 nanoparticles on different cancer cell lines. Cancer cells were treated with different concentrations of free MTX, Chit-IOCO-Cy5 and Chit-IOCO-MTX-Cy5 for 48 h. The fluorescence of non-treated cells was determined as 100 % cell viability. Sigmoidal dose-response curves of (A) U-87 MG, (B) HCT 116, (C) B16-F10, (D) SK-OV-3, (E) MCF7 and (F) MDA-MB-231 cells plotted against log concentrations of MTX and CO were produced from non-linear regression analyses using GraphPad Prism.
Fig. 3
Fig. 3
DCFDA assays to determine changes in intracellular ROS. (A) ROS of cells (SVEC4-10, U-87MG and HCT 116) treated with free methotrexate (MTX), Chit−IOCO or Chit−IOCO−MTX at different concentrations for 8 h. Fold change of intracellular ROS level was defined as fluorescence intensities of treated wells normalised against control wells. #p ≤ 0.05, ##p ≤ 0.01, ####p ≤ 0.0001, Student's t-test. ∗p ≤ 0.05, ∗∗p ≤ 0.01, ∗∗∗p ≤ 0.001, Student's t-test comparing Chit−IOCO−MTX to MTX and to Chit−IOCO. Apoptotic effects of NPs. (B) Flow cytometry analysis of U87MG cells treated with NPs to determine stages of apoptosis. ∗ Compared to the respective stages of apoptosis cell population of the control group: ∗p < 0.05, ∗∗p < 0.01.
Fig. 4
Fig. 4
Cellular uptake of nanoparticles with and without targeting ligand methotrexate (MTX). U-87 MG cells were treated with different iron (Fe) concentrations of Chit−IOCO−Cy5 and Chit−IOCO−MTX−Cy5 for 8 h at 37 °C with 5 % CO2, harvested for fluorescence and magnetic resonance (MR) imaging. (A) Cellular uptake measured by Cy5 fluorescence intensities. (i) Fluorescence images of harvested cells scanned on a Sapphire Biomolecular Imager with a 658 nm excitation laser coupled to a 670–750 nm filter. (ii) Fluorescence intensities of harvested cells determined from taking region of interest (ROI) measurement on ImageJ. (B) Cellular uptake measured by MR imaging. (i) T2∗-weighted MR scan images of prepared phantoms. (ii) Relaxation time (T2∗) that were automatically generated from T2∗-weighted scans by the operating system. ∗p ≤ 0.05, ∗∗p ≤ 0.01, Student's t-test comparing Chit−IOCO−MTX to Chit−IOCO. In vitro biocompatibility of Chit−IOCO and Chit−IOCO−MTX nanoparticles. (C) Cytotoxicity of methotrexate (MTX), Chit−IOCO and Chit−IOCO−MTX in SVEC4-10 cells. Cells were incubated with different concentrations of nanoparticles treatment for 48 h. The fluorescence of non-treated cells was determined as 100 % cell viability. (D) Haemolysis assay of red blood cells incubated with increasing concentrations of Chit−IOCO−Cy5 (i) and Chit−IOCO−MTX−Cy5 (ii) for 1 h at 37 °C. iii) Representative images. (For interpretation of the references to colour in this figure legend, the reader is referred to the Web version of this article.)
Fig. 5
Fig. 5
In vivo biosafety studies of Chit−IOCO−MTX−Cy5 in female C57BL/6J mice. Mice were injected intravenously via tail vein with 0.9 % saline (control group), 2.5 and 5 mg/kg MTX equivalent (0.35 and 0.7 mg/kg equivalent Ce) of Chit−IOCO−MTX−Cy5 at Day 0, 4 and 8. (A) Average body weight of mice monitored twice a week. (B) Relative organ weights (organ weight to body weight ratios) were determined as mg organ weight/g terminal body weight of mice. (C) Biochemical analysis of serum from C57BL/6J mice. Blood samples were collected at Day 12 via cardiac puncture. Purified serum samples from whole blood collected were tested for (i) Bilirubin, (ii) Glucose, (iii) Albumin, (iv) Alanine transaminase (ALT), (v) Uric acid. (vi) Urea and (vii) Creatinine. (D) Histological images of tissues stained with H & E indicating the status of major organs after animals were sacrificed at Day 12 post i.v. injection. Scale bar: 100 μm.
Fig. 6
Fig. 6
In vivo therapeutic effects of free MTX, Chit-IOCO-Cy5 and Chit-IOCO-MTX-Cy5 nanoparticles in U-87 MG tumour-bearing BALB/C mice. Mice were injected intravenously with 0.9 % saline (control group), 5 mg/kg bare methotrexate (MTX), 2.5 and 5 mg/kg MTX equivalent (0.35 and 0.7 mg/kg equivalent Ce) of Chit-IOCO-MTX-Cy5 and 0.35 and 0.7 mg/kg equivalent Ce of Chit-IOCO-Cy5 at Day 0, 4 and 8. (A) Average body weight of mice monitored twice a week during the treatment. Mice body weight analysed with repeated measures one-way ANOVA with Tukey's multiple comparisons demonstrated no significant changes in all treatment groups across the experimental period. (B) Changes in tumour volume during the experiment period. Relative tumour volume was defined as tumour volume (V0) measured normalised to tumour volume at Day 0 before administration of treatment (V0). (C) Terminal tumour weight and (D) representative images of tumour from each group. Scale bar: 10 mm. One-way ANOVA with Tukey's Multiple Comparisons Test. Compared to Saline: ∗∗p < 0.01, ∗∗∗p < 0.001, ∗∗∗∗p < 0.0001. Compared to MTX: ##p < 0.01, ###p < 0.001. Compared to Chit-IOCO-MTX-Cy5 (5 mg/kg MTX): ††p < 0.01, †††p < 0.001. Student's t-test comparing Chit−IOCO−MTX-Cy5 to Chit−IOCO-Cy5. α < 0.05, αα < 0.01. (E) Histological images of tumour tissues stained with TUNEL. Scale bar: 100 μm.
Fig. 7
Fig. 7
In vivo tumour targeting efficacy of Chit-IOCO−Cy5 and Chit-IOCO−MTX−Cy5 nanoparticles in U-87 MG tumour-bearing BALB/C mice. Mice were injected intravenously (IV) via tail vein with Chit-IOCO−Cy5 and Chit-IOCO−MTX−Cy5 at Day 0, 4 and 8. Fluorescence images of mice taken using IVIS Lumina X5 at 4 and 24 h post iv injections and processed with Aura Imaging Software. (A) Representative images were shown with white circles as regions of interest (ROI) where tumours were located. (B) The ROI values were calculated and presented as the total radiant efficiency. ∗p < 0.05, Student's t-test comparing Chit−IOCO−MTX to Chit−IOCO. Mouse tumours were imaged using a 7 T MRI before (Day 0), 1- (Day 1), 3-day (Day 3) after first injection and 5-day (Day 8) after second intravenous injection of Chit-IOCO−Cy5 (1.4 mg/kg Fe) and Chit-IOCO−MTX−Cy5 (1.2 mg/kg Fe). (C) Representative MR images of mice. Coloured circles represented ROI taken for T2 determination. Yellow arrows denote tumour. (D) Transverse relaxation time T2 values were automatically generated by the operating system using region of interest (ROI) function on the tumours. ∗∗p ≤ 0.01, ∗∗∗p ≤ 0.001, ∗∗∗∗p ≤ 0.0001, one-way ANOVA with Dunnett's multiple comparisons comparing T2 values of Day 1, 3 and 8 to Day 0. #p ≤ 0.05, ##p ≤ 0.01, Student's t-test comparing Chit−IOCO−MTX−Cy5 to Chit−IOCO−Cy5. (For interpretation of the references to colour in this figure legend, the reader is referred to the Web version of this article.)

Similar articles

Cited by

References

    1. Moonshi S.S., Bejot R., Atcha Z., Vijayaragavan V., Bhakoo K.K., Goggi J.L. A comparison of PET imaging agents for the assessment of therapy efficacy in a rodent model of glioma. Am. J. Nuclear Med. Mol. Imaging. 2013;3(5):397–407. - PMC - PubMed
    1. Frangioni J.V. New technologies for human cancer imaging. J. Clin. Oncol. 2008;26(24):4012–4021. - PMC - PubMed
    1. Funkhouser J. Reinventing pharma: the theranostic revolution. Curr. Drug Discov. 2002:17–19.
    1. Moonshi S.S., Vazquez-Prada K.X., Adelnia H., Westra van Holthe N.J., Wu Y., Tang J., Bulmer A.C., Ta H.T. Polysuccinimide-based nanoparticle: a nanocarrier with drug release delay and zero burst release properties for effective theranostics of cancer. Appl. Mater. Today. 2024;37
    1. Zhao C.-Y., Cheng R., Yang Z., Tian Z.-M. Nanotechnology for cancer therapy based on chemotherapy. Molecules. 2018;23(4):826. - PMC - PubMed

LinkOut - more resources