. 2024 Dec 17:15:1505719.
doi: 10.3389/fimmu.2024.1505719. eCollection 2024.

Longevity of antibody responses is associated with distinct antigen-specific B cell subsets early after infection

Affiliations

Longevity of antibody responses is associated with distinct antigen-specific B cell subsets early after infection

Lisan H Kuijper et al. Front Immunol. .

Abstract

Introduction: Upon infection, T cell-driven B cell responses in GC reactions induce memory B cells and antibody-secreting cells that secrete protective antibodies. How formation of specifically long-lived plasma cells is regulated via the interplay between specific B and CD4+ T cells is not well understood. Generally, antibody levels decline over time after clearance of the primary infection.

Method: In this study, convalescent individuals with stable RBD antibody levels (n=14, "sustainers") were compared with donors (n=13) with the greatest antibody decline from a cohort of 132. To investigate the role of the cellular immune compartment in the maintenance of antibody levels, SARS-CoV-2-specific responses at 4 to 6 weeks post-mild COVID-19 infection were characterized using deep immune profiling.

Results: Both groups had similar frequencies of total SARS-CoV-2-specific B and CD4+ T cells. Sustainers had fewer Spike-specific IgG+ memory B cells early after infection and increased neutralizing capacity of RBD antibodies over time, unlike the declining group. However, declining IgG titers correlated with lower frequency of Spike-specific CD4+ T cells.

Conclusion: These data suggest that "sustainers" have unique dynamics of GC reactions, yield different outputs of terminally differentiating cells, and improve the quality of protective antibodies over time. This study helps identify factors controlling formation of long-lived PC and sustained antibody responses.

Keywords: CD4+ T cells; SARS-CoV-2; declining/sustained antibody titers; deep-phenotyping; neutralization.


Conflict of interest statement

Author AP was employed by Cytek Biosciences, Inc. The remaining authors declare that the research was conducted in the absence of any commercial or financial relationships that could be construed as a potential conflict of interest.

Figures
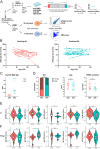
Figure 1
Figure 1
Cohort of convalescent individuals with declining or sustained RBD-IgG antibody titers. (A) Blood plasma from 132 mild convalescent individuals were sampled, and the anti-RBD IgG concentration was measured longitudinally up to 157 days after symptom onset (PSO) by ELISA. Groups of individuals with the shortest (DAb, n=13) or longest (SAb, n=14) anti-RBD IgG half-lives were selected for further immunophenotyping of their antigen-specific B and T cells. PBMCs from these individuals were either overnight stimulated with Spike and NC peptide pools to detect and phenotype Spike- and NC-specific T cells in an AIM-assay or CD3 depleted and stained with fluorescently labeled antigens to detect SARS-CoV-2-specific B cells. (B) Anti-RBD IgG titers measured up to 157 days PSO for the DAb and SAb groups. (C) RBD-IgG half-life of DAb and SAb donors, as estimated using linear mixed-effects modeling integrating all measuring points. In the case of rising antibody levels, half-life in days was arbitrarily assigned a value of 500. (D) Distribution of age, sex, and days PSO of PBMC sampling in the DAb and SAb convalescent donor groups. Individual values and median with interquartile range are shown. Mann–Whitney test was performed. (E, F) SARS-CoV-2-specific antibody titers of the DAb and SAb convalescent donor groups at the time point of the PBMC sampling, T1 (E), and at the final time point of measurements, Tfinal (F). Violin plots are shown with median and extend from the 25th to 75th percentiles. Mann–Whitney test was performed. ns, non-significant. *P < 0.05.
Figure 2
Figure 2
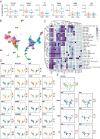
Immune phenotyping of SARS-CoV-2-specific B cells. B cells were analyzed by spectral flow cytometry for DAb (n=11) cohorts and SAb (n=10). (A) Frequency of antigen-specific B cells out of total CD19+ B cells for DAb and SAb groups. Mann–Whitney test was performed. (B) UMAP overview of numbered clusters is shown. (C) Heatmap with the relative protein marker expression for each annotated population with corresponding number on the UMAP. (D) Protein marker expression of all measured markers on B cells plotted as UMAP distribution. (E) UMAP distribution of all included cells (Density) and equal number of antigen-specific B cells in the DAb and SAb cohorts for Spike, RBD, and NC SARS-CoV-2 antigens.
Figure 3
Figure 3
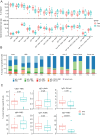
Decrease of SARS-CoV-2-specific IgG+ MBC in the sustained Ab group. (A) Frequency of B cell populations within Spike-specific B cells for DAb (n=11) and SAb (n=10) groups. Spike enrichment of each population was calculated by dividing the frequency in total CD19+ B cells by frequency of Spike-specific B cells. Order of populations was arranged by median frequency of Spike-specific populations. There were 15 most Spike-specific B cell populations that were plotted. (B) Relative frequency of eight frequent populations in Spike, RBD, and NC, and Flu HA-, RSV F-, and tetanus toxoid-specific B cells for DAb and SAb along with total B cells. (C) Comparison of frequency of selected populations of Spike-specific B cells for DAb and SAb. Mann–Whitney test was performed.
Figure 4
Figure 4
Neutralization potency of SARS-CoV-2 antibodies increase over time in SAb group whereas frequency of SARS-CoV-2-specific T cells is similar between the groups. (A) Neutralization capacity of RBD antibodies from plasma samples of DAb (n=13) and SAb (n=14) groups at time point of PBMC sampling (T1) and final measuring time point (Tfinal). (B) Ratio of Spike and RBD titers from plasma samples are displayed. Inter-time (ratio paired t-test) and inter-group (Mann–Whitney test) comparisons are shown. Box plot displays mean and extends from the 25th to 75th percentiles with whiskers to the smallest and largest value. (C) Representative flow cytometry plot of SARS-CoV-2-specific CD4+ T cells measured as percentage CD40L+ CD137+ CD4+ T cells after O/N stimulation of PBMCs with DMSO control (unstimulated), S1, S2, or NC peptide pool. (D) Frequency of SARS-CoV-2-specific CD4+ T cells after stimulation of PBMCs with peptide pools in the DAb (n=13) and SAb (n=11) convalescent donor groups. Data were background subtracted against DMSO negative control and are shown with median and interquartile range. Mann–Whitney test was performed.
Figure 5
Figure 5
Correlations between SARS-CoV-2-specific B cell, T cell, serology, and neutralization capacity in the DAb and SAb groups. Correlation matrix between Spike-specific B cell populations as frequency of CD19+ B cells with Spike-specific T-cell populations as frequency of CD4+ T cells and Spike titers and neutralization capacity of RBD Ab at T1 and Tfinal. The correlations were performed with the corrplot package to visualize the data. Spearman correlations were performed to analyze the data. The color of the circle indicates a positive or negative correlation, with the asterisks as indicators of statistical significance. The size of the circles and intensity of the colors show the value of the corresponding correlation coefficients. For the IC50, a lower value indicates a stronger neutralization capacity, so a positive correlation indicates an inverse association with neutralizing ability. Number of donors included for each set of correlations: B-T correlations included 18 donors (11 DAb and 7 SAb), B-Ab correlations 21 donors included (11 DAb and 10 SAb) and T-Ab correlations included 24 donors (13 DAb and 11 SAb). *P < 0.05, **P < 0.01, ***P < 0.001.

References

    1. Amanna IJ, Carlson NE, Slifka MK. Duration of humoral immunity to common viral and vaccine antigens. N Engl J Med. (2007) 357:1903–15. doi: 10.1056/NEJMoa066092 - DOI - PubMed
    1. Brouwer PJM, Caniels TG, van der Straten K, Snitselaar JL, Aldon Y, Bangaru S, et al. . Potent neutralizing antibodies from COVID-19 patients define multiple targets of vulnerability. Science. (2020) 369:643–50. doi: 10.1126/science.abc5902 - DOI - PMC - PubMed
    1. Piccoli L, Park YJ, Tortorici MA, Czudnochowski N, Walls AC, Beltramello M, et al. . Mapping neutralizing and immunodominant sites on the SARS-coV-2 spike receptor-binding domain by structure-guided high-resolution serology. Cell. (2020) 183:1024–1042.e21. doi: 10.1016/j.cell.2020.09.037 - DOI - PMC - PubMed
    1. Robbiani DF, Gaebler C, Muecksch F, Lorenzi JCC, Wang Z, Cho A, et al. . Convergent antibody responses to SARS-CoV-2 in convalescent individuals. Nature. (2020) 584:437–42. doi: 10.1038/s41586-020-2456-9 - DOI - PMC - PubMed
    1. Suthar MS, Zimmerman MG, Kauffman RC, Mantus G, Linderman SL, Hudson WH, et al. . Rapid generation of neutralizing antibody responses in COVID-19 patients. Cell Rep Med. (2020) 1:100040. doi: 10.1016/j.xcrm.2020.100040 - DOI - PMC - PubMed