. 2025 Jan 3;11(1):eadp8496.
doi: 10.1126/sciadv.adp8496. Epub 2025 Jan 1.

Spatial transcriptomics in bone mechanomics: Exploring the mechanoregulation of fracture healing in the era of spatial omics

Affiliations

Spatial transcriptomics in bone mechanomics: Exploring the mechanoregulation of fracture healing in the era of spatial omics

Neashan Mathavan et al. Sci Adv. .

Abstract

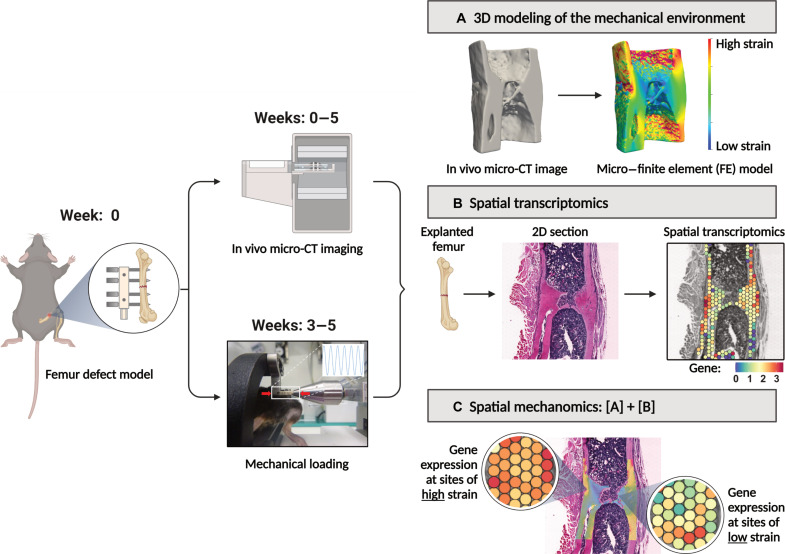
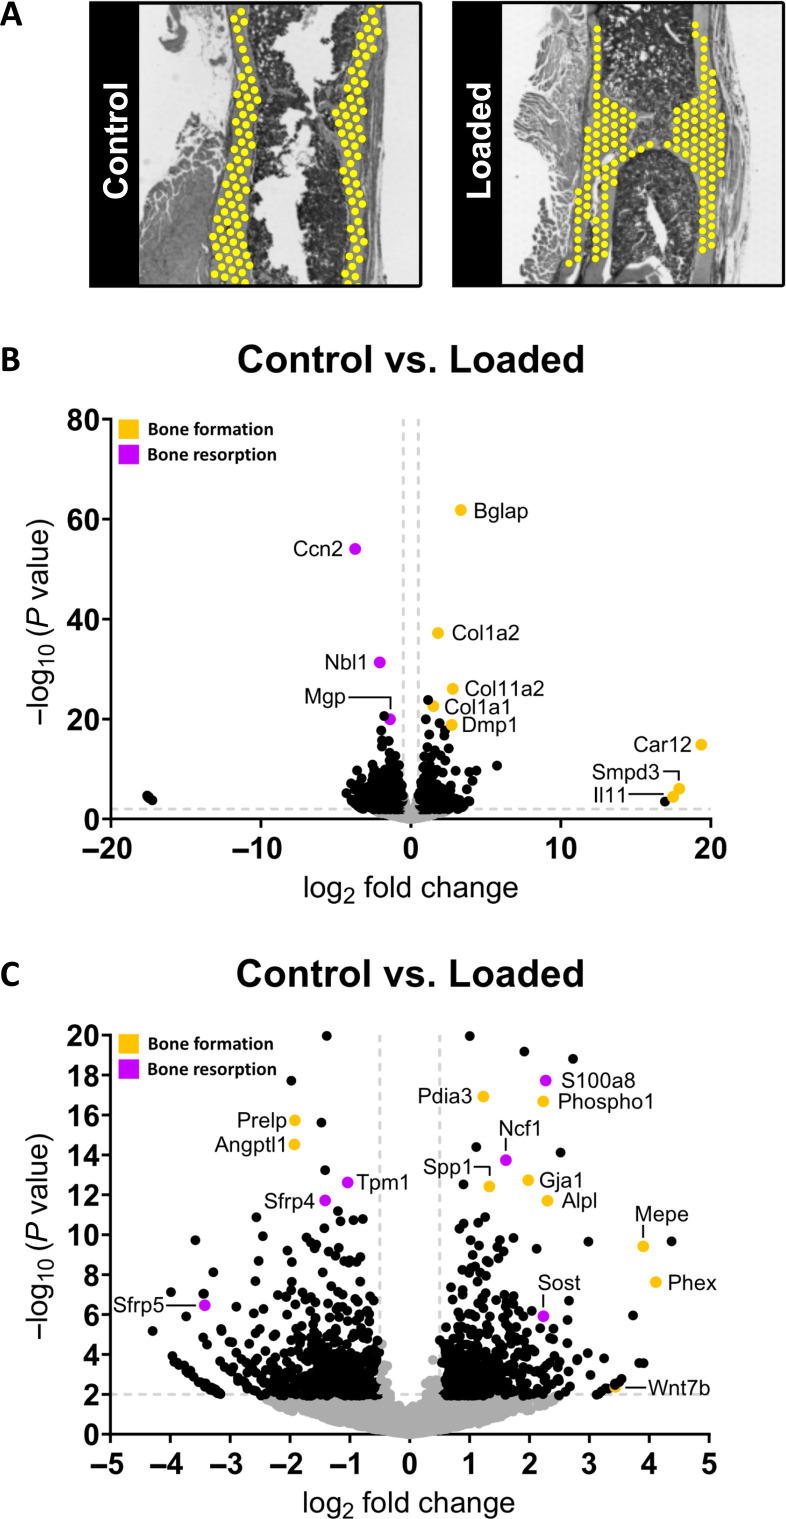
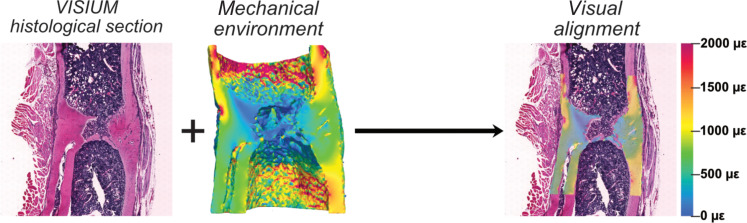
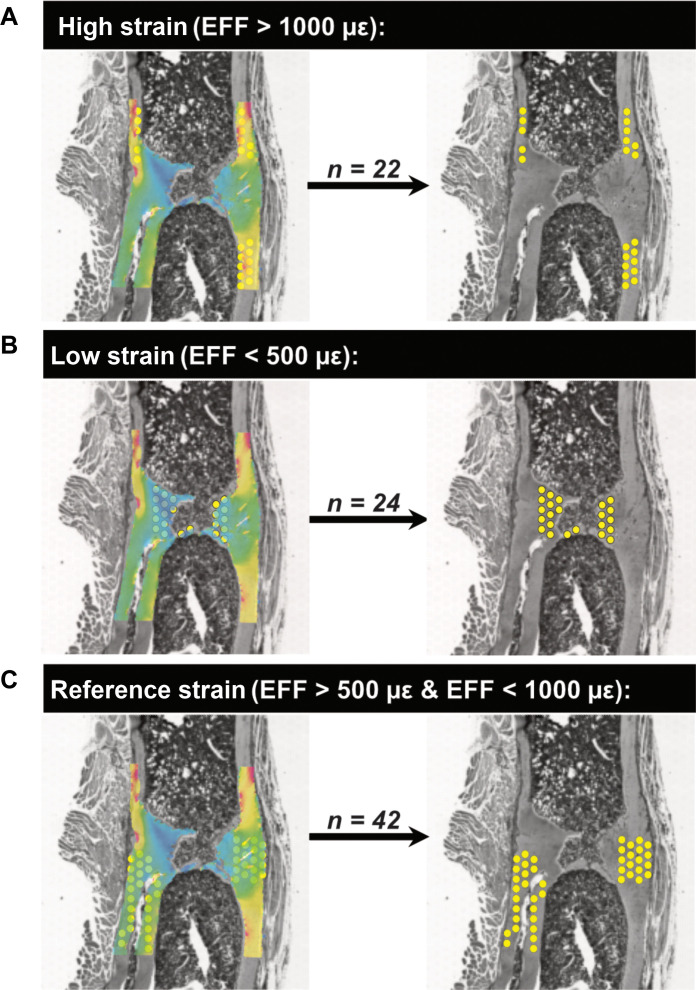
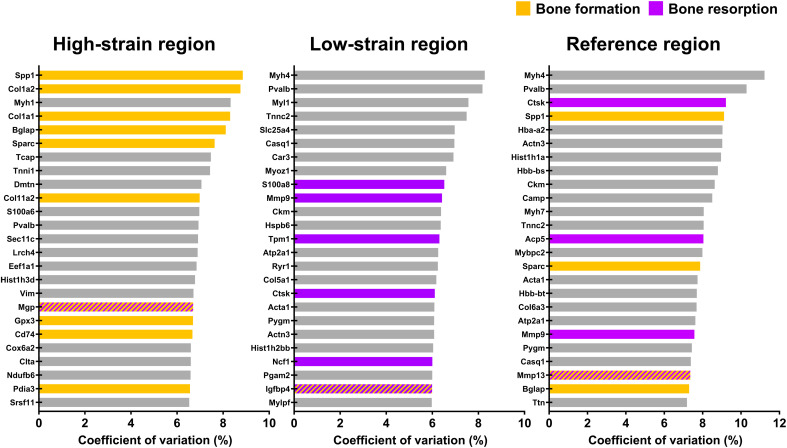
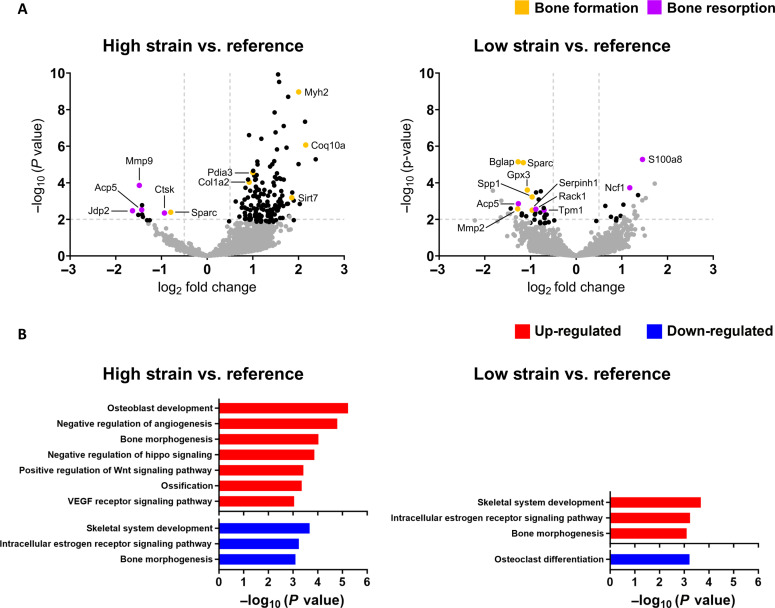
In recent decades, the field of bone mechanobiology has sought experimental techniques to unravel the molecular mechanisms governing the phenomenon of mechanically regulated fracture healing. Each cell within a fracture site resides within different local microenvironments characterized by different levels of mechanical strain; thus, preserving the spatial location of each cell is critical in relating cellular responses to mechanical stimuli. Our spatial transcriptomics-based "mechanomics" platform facilitates spatially resolved analysis of the molecular profiles of cells with respect to their local in vivo mechanical environment by integrating time-lapsed in vivo micro-computed tomography, spatial transcriptomics, and micro-finite element analysis. We investigate the transcriptomic responses of cells as a function of the local strain magnitude by identifying the differential expression of genes in regions of high and low strain within a fracture site. Our platform thus has the potential to address fundamental open questions within the field and to discover mechano-responsive targets to enhance fracture healing.


Figures

Fig. 1.
Fig. 1.. Overview of our spatial transcriptomics–based mechanomics platform to investigate the mechanobiology of fracture healing.
The platform permits the generation and spatial integration of multimodal datasets (CT bone morphology data, 3D mechanical environments, and spatially resolved gene expression data) from a single fracture site. At week 0, mid-diaphyseal femoral osteotomies are introduced in the right femur of mice and stabilized with an external fixator. Time-lapsed in vivo micro-CT imaging is performed weekly at the fracture site (weeks 0 to 5; 10.5 μm resolution). Mice that exhibit bridging at 3 weeks after surgery are subdivided into Loaded and Control groups. At weeks 3 to 5, mice received individualized cyclic loading (up to 16 N) or 0 N sham-loading three times per week. All mice are euthanized at 5 weeks after surgery. (A) Micro-FE analyses based on in vivo micro-CT images are used to generate tissue-scale 3D maps of the mechanical environment. (B) Spatial transcriptomics analyses are performed on explanted femurs. To associate spatially resolved molecular profiles of cells with their local in vivo mechanical environment, the spatial transcriptomics histology section is visually aligned within the 3D map of their mechanical environment. (C) Gene expression can thus be analyzed as a function of the local mechanical environment. Illustration created with BioRender [Mathavan, N. (2024) BioRender.com/p12y872].
Fig. 2.
Fig. 2.. Visualization of sites of bone formation, quiescence, and resorption in Control and Loaded fracture sites.
Sites of bone formation (orange) and bone resorption (purple) are identified via registration of time-lapsed in vivo images (threshold: 395 mg HA/cm3, voxel size = 10.5 μm). In Loaded fracture sites, loading was applied 3× per week from week 3 onward. Visualization performed using Paraview (version 5.7.0). Spatial transcriptomics data generated from 2D sections of these samples are presented in Fig. 4.
Fig. 3.
Fig. 3.. In vivo micro-CT morphometric analysis.
Quantitative morphometric analyses (n = 2 per group) were performed in four volumes of interest: the defect center (DC), the defect periphery (DP), the existing fracture cortex and medullary cavity (FC), and the cortex periphery (FP). Two parameters are presented: (A to D) BV/TV where the bone volume (BV) is normalized to TV (DC for DC and DP, FC for FC and FP). (E to H) Bone formation rates (BFR) and bone resorption rates (BRR). Shaded regions in each plot correspond to time points at which loading was applied 3× per week.
Fig. 4.
Fig. 4.. Spatial gene expression maps of selected bone cell markers at the fracture site of Control and Loaded mice.
Visualization of the spatial expression patterns of osteoblast markers: (A) Col1a1, (B) Bglap, (C) Runx2, and (D) Alpl; osteocyte markers: (E) Dmp1, (F) Mepe, and (G) Sost; and osteoclast markers: (H) Ctsk, (I) Acp5, and (J) Mmp9 within the fracture sites of Control and Loaded mice is presented. Each legend denotes the normalized expression of the specified gene. Data presented (n = 1 per group) correspond to samples at 5 weeks after surgery. 3D visualizations of the morphology of these Control and Loaded fracture sites are presented in Fig. 2. Spatial transcriptomics spot size = 55 μm.
Fig. 5.
Fig. 5.. Gene expression profiling in Control versus Loaded fracture sites.
Data presented (n = 1 per group) corresponds to samples at 5 weeks after surgery. (A) Areas of interest defined in each fracture site for the analysis. (B) Volcano plot to visualize differentially expressed genes (DEGs) (significance criteria: FDR-adjusted P value cutoff < 0.05 and an absolute log2 fold change > 0.5). Significant DEGs associated with bone formation are identified in orange and significant DEGs associated with bone resorption (or are inhibitors/antagonists of bone formation) are identified in purple. Non-DEGs are represented in gray. (C) Magnified view of volcano plot to highlight DEGs of interest.
Fig. 6.
Fig. 6.. Association of spatially resolved molecular profiles of cells with their local in vivo mechanical environment.
Visual alignment of the 2D spatial transcriptomics histological section within the 3D mechanical environment in the Loaded fracture site. Element size in the 3D micro-FE model of the mechanical environment is 10.5 μm by 10.5 μm by 10.5 μm.
Fig. 7.
Fig. 7.. Classification of spots with respect to their local in vivo mechanical environment.
Identification of transcriptomic responses at (A) sites of high strain (EFF > 1000 με), (B) sites of low strain (EFF < 500 με), and (C) sites corresponding to a reference strain region (EFF > 500 με and EFF < 1000 με). Element size in the 3D micro-FE model of the mechanical environment is 10.5 μm by 10.5 μm by 10.5 μm. Spot size of the spatial transcriptomics data is 55 μm. Effective strain (EFF) represents the mechanical environment.
Fig. 8.
Fig. 8.. Use of the coefficient of variation (CV) to analyze transcriptomic responses of cells with respect to their local in vivo mechanical environment.
Data presented (n = 1 per group) correspond to the mechanically loaded fracture site at 5 weeks after surgery. Use of the coefficient of variation (CV) to identify the top 25 genes of functional significance within each strain region. Genes associated with bone formation are identified in orange. Genes associated with bone resorption are identified in purple. Genes that are inhibitors of bone formation/resorption or genes that have roles in both bone formation/resorption are identified by alternating lines/hatches in orange and purple.
Fig. 9.
Fig. 9.. Use of differential gene expression analysis and gene-set enrichment analysis to analyze the transcriptomic responses of cells with respect to their local in vivo mechanical environment.
Data presented (n = 1 per group) correspond to the mechanically loaded fracture site at 5 weeks after surgery. Genes associated with bone formation are identified in orange. Genes associated with bone resorption are identified in purple. Genes that are inhibitors of bone formation/resorption or genes that have roles in both bone formation/resorption are identified by alternating lines/hatches in orange and purple. (A) Volcano plots to visualize DEGs between strain regions. (significance criteria: FDR-adjusted P value cutoff < 0.05 and an absolute log2 fold change > 0.5). Significant DEGs associated with bone formation are identified in orange and significant DEGs associated with bone resorption are identified in purple. Non-DEGs are represented in gray. (B) Gene-set enrichment analysis performed in one-on-one comparisons between mean expression of high strain versus reference spots and low strain versus reference spots. The significant annotation terms were selected using an FDR-adjusted P value < 0.05. Only annotation terms relevant to fracture healing are presented.

References

    1. J. Wolff, Das Gesetz der Transformation der Knochen (Verlag von August Hirschwald, 1892). [The law of bone remodeling].
    1. L. E. Claes, Mechanobiology of Fracture Healing: From Basic Science to Clinical Application, Springer Briefs in Bioengineering (Springer International Publishing, 2022); 10.1007/978-3-030-94082-9. - DOI
    1. S. W. Verbruggen, L. M. McNamara, Bone mechanobiology in health and disease, in Mechanobiology in Health and Disease (Elsevier, 2018), pp. 157–214; https://linkinghub.elsevier.com/retrieve/pii/B9780128129524000064.
    1. A. B. Castillo, J. C. Chen, C. R. Jacobs, Cellular and molecular mechanotransduction in bone, in Marcus and Feldman’s Osteoporosis (Elsevier, 2021), pp. 309–335; https://linkinghub.elsevier.com/retrieve/pii/B9780128130735000149.
    1. Paul G. R., Malhotra A., Müller R., Mechanical stimuli in the local in vivo environment in bone: Computational approaches linking organ-scale loads to cellular signals. Curr. Osteoporos. Rep. 16, 395–403 (2018). - PMC - PubMed