. 2025 Jan 3;11(1):eado7852.
doi: 10.1126/sciadv.ado7852. Epub 2025 Jan 1.

Identification of human cranio-maxillofacial skeletal stem cells for mandibular development

Affiliations

Identification of human cranio-maxillofacial skeletal stem cells for mandibular development

Zhuo Wang et al. Sci Adv. .

Abstract

Compared with long bone that arises from the mesoderm, the major portion of the maxillofacial bones and the front bone of the skull are derived from cranial neural crest cells and undergo intramembranous ossification. Human skeletal stem cells have been identified in embryonic and fetal long bones. Here, we describe a single-cell atlas of the human embryonic mandible and identify a population of cranio-maxillofacial skeletal stem cells (CMSSCs). These CMSSCs are marked by interferon-induced transmembrane protein 5 (IFITM5) and are specifically located around the periosteum of the jawbone and frontal bone. Additionally, these CMSSCs exhibit strong self-renewal and osteogenic differentiation capacities but lower chondrogenic differentiation potency, mediating intramembranous bone formation without cartilage formation. IFITM5+ cells are also observed in the adult jawbone and exhibit functions similar to those of embryonic CMSSCs. Thus, this study identifies CMSSCs that orchestrate the intramembranous ossification of cranio-maxillofacial bones, providing a deeper understanding of cranio-maxillofacial skeletal development and promising seed cells for bone repair.


Figures
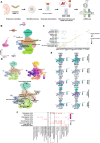
Fig. 1.
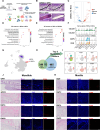
Fig. 1.. Integrated cell atlas of human embryonic mandible.
(A) Schematic illustration of the scRNA-seq workflow. Five human embryonic mandibles from GW8 to GW11 were processed for scRNA-seq. DNase, deoxyribonuclease. (B) Visualization of 13 subsets by integrated Uniform Manifold Approximation and Projection (UMAP) plots. (C) Dot plots showing the expression of individual feature genes in 13 subsets. (D) Developmental trajectory of CNC-derived mesenchymal cells inferred by Monocle 3. Top left: Pseudotime trajectory colored by clusters. Top right: Pseudotime trajectory colored by timeline. Bottom: Schematic diagram of the predictable differentiation trajectory. (E) Expression of selected differentially expressed marker genes for each cell lineage in green. (F) GO functional analysis of differentially expressed genes (DEGs) in the mesenchymal subsets.
Fig. 2.
Fig. 2.. Characterization of the CMSSCs in human embryonic mandible and identification of IFITM5 as a phenotypic marker of CMSSCs.
(A) Schematic drawing of the combined scRNA-seq and LCM-seq. (B) Representative images showing the areas of CMSSCs1 and MCCs1 collected by LCM from GW9 mandible sections. Scale bars, 100 μm. (C) Volcano plot exhibiting DEGs distribution between CMSSCs and MCCs, and the top two DEGs in CMSSCs (ASPN and OGN) and MCCs (COL2A1 and COL9A1) labeled, respectively. (D) GO analysis of DEGs in MCCs showing the top 10 terms ranked by enrichment score. (E) GO analysis of DEGs in CMSSCs showing the top 10 terms ranked by enrichment score. (F) Violin plots showing the expression level of COL2A1, COL9A1, ASPN, and OGN in the clusters of scRNA-seq data. (G) Projection of pseudo–single-cell data processed by LCM-seq data of CMSSCs and MCCs into the scRNA-seq data. (H) Venn diagram illustrating the numbers of DEGs in CMSSCs and osteogenic cells and the numbers of intersections. (I) UMAP distribution of top five membrane markers among intersection genes. (J) Hematoxylin and eosin (H&E) staining of GW9, GW12, GW14, and GW20 mandible sections. Immunofluorescence staining for IFITM5 performed on the areas marked with black dashed lines. Scale bars, 100 μm. (K) H&E staining of GW9, GW12, GW14, and GW20 maxilla sections. Immunofluorescence staining for IFITM5 performed on the areas marked with black dashed lines. Scale bars, 100 μm.
Fig. 3.
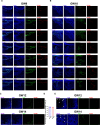
Fig. 3.. Immunofluorescent colocalization of IFITM5 with other known markers.
(A) Immunofluorescence double staining of Ki67, Ctsk, Gli1, Gremlin1, Prrx1, Dlx5, and RUNX2 (green) with IFITM5 (red) in GW9 mandible. Scale bars, 100 μm. (B) Immunofluorescence double staining of Ki67, Ctsk, Gli1, Gremlin1, Prrx1, Dlx5, and RUNX2 (green) with IFITM5 (red) in GW10 mandible. Scale bars, 100 μm. (C) Immunofluorescence double staining of Ctsk (green) with IFITM5 (red) in GW12 and GW14 mandibles. Scale bars, 100 μm. (D) Percentage of IFITM5+ cells in Ctsk+ cells in GW12 and GW14 mandibles (n = 3). (E) Immunofluorescence double staining of OPN (green) with IFITM5 (red) in GW12 and GW14 mandibles. White arrows indicated IFITM5+ cells, and white triangular arrows indicated OPN+ osteoblasts. Scale bars, 100 μm.
Fig. 4.
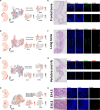
Fig. 4.. Different sites and cross-species comparisons of CMSSCs.
UMAP atlas of integrated analysis from cellular lineages (common progenitors, osteogenic cells, and chondrogenic cells) of human embryonic mandibles and mesenchymal cells of (A) human 8-WPC calvaria, (B) human 8-WPC long bone, (C) human GW9 vertebra, and (D) mouse E10.5 to E14.5 mandibles. CMSSC-like cells were circled with a dashed line and feature plots to the right visualize expression of DLX5, RUNX2, and IFITM5. H&E staining of (E) human GW9 calvaria, (F) human GW9 long bone, (G) human GW9 vertebra, and (H) mouse E14.5 and E16.5 mandibles. Immunofluorescence staining of RUNX2 or IFITM5 of the area in the dotted box. Scale bars, 100 μm.
Fig. 5.
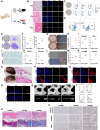
Fig. 5.. Phenotypic and functional characterizations of CMSSCs.
(A) Experimental flowchart of IFITM5+ cells isolation and characterization in vitro. (B) Flow cytometry gating strategies for sorting IFITM5+ cells (n = 3 embryos). (C) Flow cytometry plots showing serial colony formation from a single IFITM5+ cell (n = 3 clones). (D) Representative crystal violet staining of fibroblast colony-forming unit (CFU-F) colonies from IFITM5 and IFITM5+ cells. (E) Numbers and mean diameters of CFU-F colonies (n = 3 embryos). (F, H, and J) Representative alizarin red, alcian blue, and oil red O stainings after in vitro differentiation of clonally expanded IFITM5 and IFITM5+ cells. (G, I, and K) qPCR analyses of osteogenic, chondrogenic, and adipogenic marker genes and quantification of alizarin red in clonally expanded IFITM5 and IFITM5+ cells after in vitro differentiation (n = 3 embryos). (L) Workflow of IFITM5+ cell characterization in vivo. (M) Bright-field images and H&E staining of subcapsular xenografts of IFITM5 and IFITM5+ cells (n = 5). (N, P, and Q) Immunofluorescence staining of COLII, COLI, OPN, and Stem101. (O) Micro–computed tomography (CT) three-dimensional (3D) reconstruction images (top) and coronal images (bottom) of mandibular defect repair after GelMA, IFITM5, and IFITM5+ cell transplantation. (R) Quantification of bone formation parameters at defect region (n = 5). (S) H&E staining (bone defect edge demarcated by black dashed lines) and Masson staining in coronal sections of GelMA, IFITM5, and IFITM5+ cell groups. (T) Immunohistochemical staining for human nucleoli, RUNX2, and OPN in areas marked by white dashed lines in Masson staining images. Scale bars, 100 μm in all figures. [(E), (G), (I), and (K)] **P < 0.01 and ***P < 0.001 determined by an unpaired two-tailed Student’s t test. (R) *P < 0.05, **P < 0.01, and ***P < 0.001 versus GelMA; ###P < 0.001 versus IFITM5 cells determined by one-way analysis of variance (ANOVA) with Tukey’s post hoc test. SSC-A, side scatter-area; OD, optical density.
Fig. 6.
Fig. 6.. Evaluation of self-renewal and osteogenic capacities of IFITM5+ cells and CADM1+ cells.
(A) Flow cytometry gating strategies for sorting CADM1+ cells (n = 2 embryos). (B) Representative crystal violet staining of CFU-F colonies from CADM1+ and IFITM5+ cells. Scale bars, 100 μm. (C) Numbers and mean diameters of the CFU-F colonies (n = 2 embryos). (D) Representative alizarin red staining after osteogenic differentiation of CADM1+ and IFITM5+ cells. Scale bars, 100 μm. (E) Quantification of alizarin red staining in CADM1+ and IFITM5+ cells after in vitro differentiation (n = 2 embryos). (F) qPCR analyses of osteogenic marker genes in vitro differentiation (n = 2 embryos). (G) Micro-CT coronal images (top) and 3D reconstruction images (bottom) of mouse mandibular defect repair after transplantation of CADM1+ and IFITM5+ cells. (H) Quantification of bone formation parameters at defect region (n = 5). (I) Representative images of H&E staining (bone defect edge demarcated by black dashed lines) in coronal sections of GelMA, CADM1+, and IFITM5+ cell groups. Scale bar, 100 μm. [(C), (E), and (F)] *P < 0.05, **P < 0.01, and ***P < 0.001 determined by an unpaired two-tailed Student’s t test. (H) **P < 0.01 and ***P < 0.001 versus GelMA; #P < 0.05 and ###P < 0.001 versus CADM1+ cells determined by one-way ANOVA with Tukey’s post hoc test.
Fig. 7.
Fig. 7.. Detection and functional validation of IFITM5+ cells in the adult mandible.
(A) Schematic diagram of characterization IFITM5+ cells in vivo and in vitro. (B) H&E and immunofluorescence staining of IFITM5 and RUNX2 in mandible fragments aged 19, 32, and 49 (white boxes indicating magnified regions). y, years. (C) Flow analysis with MSC-specific surface markers and morphology of BMSCs (n = 3). (D) Gating scheme for sorting ZombieIFITM5+ BMSCs (n = 3 patients). (E) Crystal violet staining of CFU-F colonies from IFITM5 and IFITM5+ BMSCs. (F) Numbers and mean diameters of CFU-F colonies (n = 3 patients). (G, J, and L) Alizarin red, alcian blue, and oil red O stainings after in vitro differentiation. (H and M) Quantification of alizarin red and oil red O stainings. (I, K, and N) qPCR analyses of osteogenic, chondrogenic, and adipogenic marker genes (n = 3 patients). (O) Bright-field images and H&E staining of subcapsular xenografts of IFITM5 and IFITM5+ BMSCs (n = 5). (P, Q, and R) Immunofluorescence staining images of COLII, COLI, OPN, and Stem101. (S) Micro-CT 3D reconstruction images and coronal images of mandibular defect after GelMA, IFITM5, and IFITM5+ BMSC transplantation. (T) Quantification of bone formation parameters at defect region (n = 5). (U) H&E staining (bone defect edge demarcated by black dashed lines) and Masson staining in coronal sections of GelMA, IFITM5, and IFITM5+ BMSC groups. (V) Immunohistochemical staining for Human nucleoli, RUNX2, and OPN in areas marked by white dashed lines in Masson staining images. Scale bars, 100 μm in all figures. [(F), (H), (I), (K), (M), and (N)] **P < 0.01 and ***P < 0.001 determined by an unpaired two-tailed Student’s t test. (T) **P < 0.01 and ***P < 0.001 versus GelMA; ##P < 0.01 and ###P < 0.001 versus IFITM5 cells determined by one-way ANOVA with Tukey’s post hoc test.

References

    1. Chu C.-F., Mao S.-H., Shyu V. B.-H., Chen C.-H., Chen C.-T., Allogeneic bone-marrow mesenchymal stem cell with moldable cryogel for craniofacial bone regeneration. J. Pers. Med. 11, 1326 (2021). - PMC - PubMed
    1. Li Z., Ba R., Wang Z., Wei J., Zhao Y., Wu W., Angiogenic potential of human bone marrow-derived mesenchymal stem cells in chondrocyte brick-enriched constructs promoted stable regeneration of craniofacial cartilage. Stem Cells Transl. Med. 6, 601–612 (2017). - PMC - PubMed
    1. Mariani L., Guo X., Menezes N. A., Drozd A. M., Cakal S. D., Wang Q., Ferretti E., A TALE/HOX code unlocks WNT signalling response towards paraxial mesoderm. Nat. Commun. 12, 5136 (2021). - PMC - PubMed
    1. Lefebvre V., Bhattaram P., Vertebrate skeletogenesis. Curr. Top. Dev. Biol. 90, 291–317 (2010). - PMC - PubMed
    1. Olsen B. R., Reginato A. M., Wang W., Bone development. Annu. Rev. Cell Dev. Biol. 16, 191–220 (2000). - PubMed

MeSH terms

LinkOut - more resources