Clinical Trial
. 2025 Jan 3;11(1):eadr8849.
doi: 10.1126/sciadv.adr8849. Epub 2025 Jan 1.

Determinants of increased muscle insulin sensitivity of exercise-trained versus sedentary normal weight and overweight individuals

Affiliations
Clinical Trial

Determinants of increased muscle insulin sensitivity of exercise-trained versus sedentary normal weight and overweight individuals

Dominik Pesta et al. Sci Adv. .

Abstract

The athlete's paradox states that intramyocellular triglyceride accumulation associates with insulin resistance in sedentary but not in endurance-trained humans. Underlying mechanisms and the role of muscle lipid distribution and composition on glucose metabolism remain unclear. We compared highly trained athletes (ATHL) with sedentary normal weight (LEAN) and overweight-to-obese (OVWE) male and female individuals. This observational study found that ATHL show higher insulin sensitivity, muscle mitochondrial content, and capacity, but lower activation of novel protein kinase C (nPKC) isoforms, despite higher diacylglycerol concentrations. Notably, sedentary but insulin sensitive OVWE feature lower plasma membrane-to-mitochondria sn-1,2-diacylglycerol ratios. In ATHL, calpain-2, which cleaves nPKC, negatively associates with PKCε activation and positively with insulin sensitivity along with higher GLUT4 and hexokinase II content. These findings contribute to explaining the athletes' paradox by demonstrating lower nPKC activation, increased calpain, and mitochondrial partitioning of bioactive diacylglycerols, the latter further identifying an obesity subtype with increased insulin sensitivity (NCT03314714).


Figures

Fig. 1.
Fig. 1.. Peripheral and hepatic insulin sensitivity, glucose oxidation, and metabolic flexibility.
Oxidative and nonoxidative glucose disposal during insulin-stimulated conditions (A) and RER (B) during a hyperinsulinemic-euglycemic clamp as well as ΔRER from basal to clamped conditions as marker for metabolic flexibility (C); hepatic insulin sensitivity as iEGP (D). For (A), LEAN n = 19, OVWE n = 51, ATHL n = 34; for (B) and (C), LEAN n = 14, OVWE n = 48, ATHL n = 34; for (D), LEAN n = 21, OVWE n = 54, ATHL n = 34. Data are presented as means ± SEM; significant differences by one-way analysis of variance (ANOVA); *P < 0.05, **P < 0.01; for (A), ** compares oxidative glucose disposal and §§ nonoxidative glucose disposal; circles represent females and squares represent males; LEAN, normal weight, sedentary individuals; OVWE, overweight-to-obese; ATHL, athletes; RER, respiratory exchange ratio; iEGP, insulin-mediated suppression of endogenous glucose production.
Fig. 2.
Fig. 2.. Skeletal muscle mitochondrial function and content.
In vitro OXPHOS capacity (A), maximal respiratory capacity (B), fatty acid oxidation capacity (C) assessed per wet weight (Ww) in permeabilized muscle fibers and expressed per Ww, and CSA (D). For (A) to (C), LEAN n = 20, OVWE n = 54, ATHL n = 34. For (D), LEAN n = 18, OVWE n = 48, ATHL n = 27. All muscle samples were obtained in the basal condition. Data are presented as means ± SEM; significant differences by one-way ANOVA; *P < 0.05, **P < 0.01; circles represent females, squares represent males.
Fig. 3.
Fig. 3.. Intramyocellular lipids and skeletal muscle morphology and fiber type.
Intramyocellular lipids determined by 1H-MRS (A) and lipid area fraction assessed by TEM from the vastus lateralis muscle (B) as well as contact sites between lipid droplets and mitochondria (C) and histologically determined skeletal muscle fraction of type 1 fibers in the vastus lateralis muscle (D). For (A), LEAN n = 16, OVWE n = 24, ATHL n = 28; for (B), LEAN n = 6, OVWE n = 7, ATHL n = 9; for (C) to (D), LEAN n = 20, OVWE n = 54, ATHL n = 34. All muscle samples were obtained in the basal condition. Data are presented as means ± SEM; significant differences by one-way ANOVA; *P < 0.05, **P < 0.01; circles represent females, squares represent males; IMCT, intramyocellular triglycerides; AU, arbitrary units.
Fig. 4.
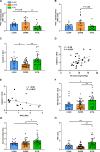
Fig. 4.. Concentration of DAG and ceramides in five fractions (lipid droplet, cytosol, plasma membrane, mitochondria, and endoplasmic reticulum) in skeletal muscle.
Concentration of sn-1,2-DAG, sn-2,3-DAG, sn-1,3-DAG, total DAG, and total ceramides (A); sn-1,2-DAG concentration in either lipid droplet (LD), cytosolic (CY), plasma membrane (PM), mitochondrial (MT), or endoplasmic reticulum (ER) subcellular compartments (B); ratios in subcellular compartments of PM to MT sn-1,2-DAG, sn-1,3-DAG, and sn-2,3-DAG (C); association of whole-body insulin sensitivity (M-value) with plasma membrane/mitochondrial ratios of sn-1,2-DAG for the OVWE group (D). For (A) to (C), LEAN n = 12, OVWE n = 40, ATHL n = 22; for (D), n = 41. All muscle samples were obtained in the basal condition. Data are presented as means ± SEM or Pearson correlations; significant differences by one-way ANOVA; *P < 0.05, **P < 0.01; circles represent females; squares represent males.
Fig. 5.
Fig. 5.. Increased myocellular insulin signaling and intracellular glucose handling as well as elevated modulator proteases elucidate the clinical phenotype.
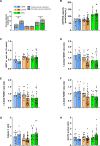
PKCθ (A) and PKCε (B) translocation derived from the membrane-to-cytosol ratio, calpain 2 (C), association of calpain 2 with M value (D) as well as calpain 2 with PKCε for the ATHL group (E), serine-473 phosphorylation of AKT (F), total GLUT4 protein (G), and HK II protein (H). For (A) and (B), LEAN n = 14, OVWE n = 17, ATHL n = 23; for (C), LEAN n = 19, OVWE n = 40, ATHL n = 30; for (D), n = 30; for (E), n = 17; for (F) to (H), LEAN n = 18, OVWE n = 40, ATHL n = 30. For (A), (B), and (G), muscle samples were obtained in the basal condition; for (C), (F), and (H), muscle samples were obtained during insulin-stimulated conditions. Data are presented as means ± SEM; significant differences by one-way ANOVA; *P < 0.05, **P < 0.01; GLUT, glucose transporter; Ser-Px-serine phosphorylation; circles represent females and squares represent males.
Fig. 6.
Fig. 6.. Sex-specific comparison of glucose disposal, mitochondrial function, intramyocellular lipids, calpain 2, and GLUT4 protein content.
Oxidative and nonoxidative glucose disposal during insulin-stimulated conditions (A); in vitro mitochondrial OXPHOS capacity (B); intramyocellular lipids determined by 1H-MRS (C); ratios in subcellular compartments of PM-to-MT sn-1,2-DAG (D), sn-1,3-DAG (E), and sn-2,3-DAG (F), calpain 2 (G), and total GLUT4 protein content (H). For (A), LEAN f n = 9, LEAN m n = 12; OVWE f n = 19; OVWE m n = 32; ATHL f n = 13; ATHL m n = 21. For (B), LEAN f n = 10; LEAN m n = 10; OVWE f n = 16; OVWE m n = 32; ATHL f n = 10; ATHL m n = 18. For (C), LEAN f n = 7; LEAN m n = 9; OVWE f n = 11; OVWE m n = 13; ATHL f n = 10; ATHL m n = 18. For (D) to (F), LEAN f n = 3; LEAN m n = 9; OVWE f n = 13; OVWE m n = 28; ATHL f n = 9; ATHL m n = 15. For (G) and (H), LEAN f n = 10; LEAN m n = 9; OVWE f n = 13; OVWE m n = 27; ATHL f n = 12; ATHL m n = 18. All muscle samples were obtained in the basal condition. Data are presented as means ± SEM; significant differences by one-way ANOVA; §§P < 0.01 for nonoxidative glucose disposal; f, female; m, male; DAG, diacylglycerol.

References

    1. Krssak M., Falk Petersen K., Dresner A., DiPietro L., Vogel S. M., Rothman D. L., Roden M., Shulman G. I., Intramyocellular lipid concentrations are correlated with insulin sensitivity in humans: A 1H NMR spectroscopy study. Diabetologia 42, 113–116 (1999). - PubMed
    1. Levin K., Daa Schroeder H., Alford F. P., Beck-Nielsen H., Morphometric documentation of abnormal intramyocellular fat storage and reduced glycogen in obese patients with type II diabetes. Diabetologia 44, 824–833 (2001). - PubMed
    1. Perseghin G., Lattuada G., De Cobelli F., Ragogna F., Ntali G., Esposito A., Belloni E., Canu T., Terruzzi I., Scifo P., Del Maschio A., Luzi L., Habitual physical activity is associated with intrahepatic fat content in humans. Diabetes Care 30, 683–688 (2007). - PubMed
    1. Dube J. J., Amati F., Stefanovic-Racic M., Toledo F. G., Sauers S. E., Goodpaster B. H., Exercise-induced alterations in intramyocellular lipids and insulin resistance: The athlete’s paradox revisited. Am. J. Physiol. Endocrinol. Metab. 294, E882–E888 (2008). - PMC - PubMed
    1. Goodpaster B. H., He J., Watkins S., Kelley D. E., Skeletal muscle lipid content and insulin resistance: Evidence for a paradox in endurance-trained athletes. J. Clin. Endocrinol. Metab. 86, 5755–5761 (2001). - PubMed

Publication types

Associated data