. 2025 Jan 3;11(1):eado9965.
doi: 10.1126/sciadv.ado9965. Epub 2025 Jan 1.

Mesolimbic dopamine neurons drive infradian rhythms in sleep-wake and heightened activity state

Affiliations

Mesolimbic dopamine neurons drive infradian rhythms in sleep-wake and heightened activity state

Pratap S Markam et al. Sci Adv. .

Abstract

Infradian mood and sleep-wake rhythms with periods of 48 hours and beyond have been observed in patients with bipolar disorder (BD), which even persist in the absence of exogenous timing cues, indicating an endogenous origin. Here, we show that mice exposed to methamphetamine in drinking water develop infradian locomotor rhythms with periods of 48 hours and beyond which extend to sleep length and manic state-associated behaviors in support of a model for cycling in BD. The cycling capacity is abrogated upon genetic disruption of dopamine (DA) production in DA neurons of the ventral tegmental area (VTA) or ablation of nucleus accumbens projecting DA neurons. Furthermore, chemogenetic activation of VTADA neurons including those that project to the nucleus accumbens led to locomotor period lengthening in circadian clock-deficient mice, which was counteracted by antipsychotic treatment. Together, our findings argue that BD cycling relies on infradian rhythm generation that depends on mesolimbic DA neurons.


Figures
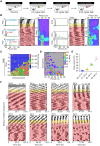
Fig. 1.
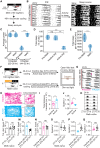
Fig. 1.. Variability and extent of infradian rhythm induction by Meth.
(A) Experimental regimen of running wheel activity monitoring in response to escalating concentrations of Meth in drinking water. (B) Representative actograms displaying running wheel activity patterns of two single-housed animals exposed to Meth. Meth concentrations applied are indicated by color shading in correspondence to (A). Lomb-Scargle periodograms on the left and CWT heatmaps on the right of each actogram show the emergence and evolution of infradian locomotor rhythms. Green line in periodograms demarcates the significant threshold for rhythmicity. Black traces in heatmaps are the wavelet ridges reporting the instantaneous peak period. hr, hours; ns, not significant. (C) Evolution of the peak period across animals identified by the wavelet ridge of the CWT. Time course of Meth treatment as indicated in (B). (D) Composite heatmap of normalized periodograms from the final 14 days of Meth treatment suggests profound period flexibility. (E) Binned display of highest peaks derived from periodograms shown in (D). Shown are means ± SEM. (F) Representative actograms of Meth-treated mice plotted modulo according the peak period from the last 14 days of the 60-day actogram. The modulo actograms demonstrate that mice can adopt robust rhythmicity in the near to far infradian range upon Meth exposure via drinking water. Grayed areas indicated data loss.
Fig. 2.
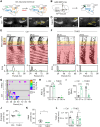
Fig. 2.. Forty-eight–hour rhythmic mice show cycling in sleep and mania-associated behaviors.
(A) Regimen to record sleep during 48-hour rhythmicity. DD, constant darkness. (B) PIR-derived spontaneous locomotor activity (left) and sleep (right) of a 48-hour rhythmic mouse. (C) Rhythmic strength (scale-averaged spectral power) in the circadian (22- to 26-hour) and infradian (44- to 52-hour) range before Meth exposure and during 48-hour cycling. (D) Daily total sleep before Meth and on active and inactive days while cycling. (E) Daily sleep (average across four consecutive days) before Meth and during 48-hour cycling. (F) Experimental design for OFT in 48- and 24-hour rhythmic mice. fps, frames per second; LD, light-dark cycle; LA, locomotor activity. (G and H) Actogram (G) of a 48-hour cycling mouse used for OFT analysis. Time of testing during active/inactive days is indicated. (H) Representative locomotor traces derived from 10-min open field video recording on inactive and active days, as indicated in (G). (I) Total distance traveled during OFT of 48-hour cycling mice during their active and inactive days. (J) Spatial d in 48-hour cycling mice during inactive and active days. (K) Representative actogram of Meth-naïve animals displaying 24-hour rhythms in locomotor activity. (L) Total distance traveled during OFT conducted during the active (ZT12 to ZT18) and inactive (ZT0 to ZT6) phases of 24-hour rhythmic, Meth-naïve mice. (M and N) Total distance traveled on active (M) and inactive (N) days by 48-hour cyclers compared to the inactive phase of Meth-naïve mice. (O) Spatial d in Meth-naïve mice during their active versus inactive phase. (P and Q) Spatial d on active (P) and inactive (Q) days by 48-hour cyclers compared to the inactive phase of Meth-naïve mice. Means ± SEM. n = 8 [(C) to (E)] and 7 [(I), (J), and (L) to (Q)]. Mann-Whitney test, (C) to (E) and (L) to (Q); Wilcoxon’s test, (I) and (J). *P < 0.05; **P < 0.01; ***P < 0.001.
Fig. 3.
Fig. 3.. Infradian rhythm generation capacity is abrogated upon VTADA neuron ablation.
(A) Experimental design: DA neuron ablation in the VTA via Casp3 and subsequent behavioral monitoring using running wheels. (B and C) Bilateral injection of AAV-DIO-taCasp3-TEVp into the VTA of DAT-Cre mice led to a loss of TH immunofluorescence in the VTA (C) compared to saline injected mice (B). IPN, interpeduncular nucleus. Scale bars, 500 μm. (D and E) Representative actograms showing running wheel activity of VTACasp3 mice and controls in constant darkness in response to escalating levels of Meth in drinking water. Lomb-Scargle periodograms below the actograms are computed for the time window indicated by the blue bar at the bottom right of the actograms. Grayed areas indicate data loss. (F) Composite display of periodograms from individual animals computed from the final 2 weeks of recording under Meth treatment. Periodograms are normalized to its peak amplitude. Gray shading indicates absence of significant amplitudes. (G and H) Periodogram-derived ASD of significant periodicities in the circadian (20- to 27-hour) and infradian (27- to 96-hour) period range before (G) and during the final 2 weeks of Meth exposure (H). (I and J) Periodogram-derived highest peak in the 20- to 96-hour range before (I) and during the final 2 weeks of Meth treatment (J). (K) Total locomotor activity (wheel revolutions) before (water) and during Meth treatment (Meth, final 2 weeks of treatment). Means ± SEM. n = 5 to 7. Mann-Whitney test, (I) and (J); two-way analysis of variance (ANOVA) with Bonferroni multiple comparison test, (G), (H), and (K). *P < 0.05; **P < 0.01; ****P < 0.0001.
Fig. 4.
Fig. 4.. Selective disruption of Th in the VTA abrogates infradian rhythm generation capacity.
(A) Schematic illustrating the Meth-mediated elevation of extracellular DA at a DA neuronal terminal. DDC, l-dopa decarboxylase. (B) Strategy for selective elimination of DA production in DA neurons of the VTA. (C and D) TH immunolabeling of midbrain sections from saline [(C), Ctrl] and AAV-GFP-Cre–injected animals [(D), THKO]. Scale bars, 500 μm. (E and F) Representative actograms showing running wheel activity of control and VTATHKO mice in constant darkness in response to escalating levels of Meth in drinking water. Grayed areas indicate missing data. Lomb-Scargle periodograms correspond to time spans indicated by blue bar. (G) Composite display of normalized periodograms from individual animals corresponding to the final 2 weeks of Meth treatment. (H and I) Periodogram-derived ASD % of significant periodicities in the circadian and infradian period ranges before [(H), pre-Meth] and at the end of Meth treatment [(I), Meth]. (J and K) Periodogram-derived highest peak before [(J), pre-Meth] and at the end of the Meth treatment regimen [(K), Meth]. (L) Total locomotor activity before (water) and during Meth treatment (Meth). Means ± SEM. n = 7 to 8. Mann-Whitney test, (J) and (K); two-way ANOVA with Bonferroni multiple comparison, (H), (I), and (L). *P < 0.05; **P < 0.01; ****P < 0.0001.
Fig. 5.
Fig. 5.. Selective disruption of Vmat2 in the VTA does not abrogate the capacity for infradian rhythm generation.
(A) Strategy of Vmat2 disruption leading to loss of DA vesicular uptake and release selectively in DA neurons of the VTA. (B and C) Bilateral injection of AAV5-GFP-Cre into the VTA of Vmat2fl/fl mice leads to loss of Vmat2 message in the VTA but not the SN. Shown are representative images of brain sections after situ hybridization with a Vmat2 specific riboprobe of viral [(C), Vmat2KO] and saline-injected mice [(B), Ctrl)]. Blue precipitate indicates Vmat2 message. Scale bars, 500 μm (SN) and 250 μm (VTA). (D and E) Representative actograms displaying running wheel activity of control (D) and VTAVmat2KO mice (E) in constant darkness in response to Meth in drinking water. Lomb-Scargle periodograms shown below correspond to the time span indicated by blue bar. (F) Composite display of normalized periodograms computed from the final 2 weeks of recording under Meth treatment. (G and H) Periodogram-derived ASD % of significant periodicities in the circadian and infradian period ranges before (G) and at the end of Meth treatment (H). (I and J) Periodogram-derived highest peak in the 20- to 96-hour range before [(I), pre-Meth] and at the end of Meth treatment [(J), Meth]. (K) Total locomotor activity before (water) and during Meth treatment (Meth). Means ± SEM. n = 5 to 6. Mann-Whitney test, (I) and (J); two-way ANOVA with Bonferroni multiple comparison, (G), (H), and (K). ****P < 0.0001.
Fig. 6.
Fig. 6.. Period shortening of VTA->NAcDA neuron–driven locomotor rhythms by antipsychotic treatment.
(A and B) Experimental regimen of locomotor rhythm monitoring in constant darkness and CNO treatment upon viral delivery of a chemogenetic actuator into DA neurons of the VTA. (C) Immunofluorescence images of VTA and NAc sections labeled for mCherry (red) and TH (green) from DAT-Cre × Bmal1−/− mice injected with AAV-DIO-hM3Dq-mCherry in the VTA. Core and shell indicate respective subregions of the NAc. Scale bars, 500 (NAc) and 250 μm (VTA). (D and E) Representative, modulo-plotted actograms showing locomotor responses to CNO in drinking water, followed by CNO + Haldol. Periodograms are computed from indicated time windows. “Tro” indicates the trough after the dominant periodogram peak during water treatment. The 0-hour to Tro periodogram segment therefore captures the periodicities that dominate at baseline (water-only treatment). Dashed line indicates significant threshold for rhythmicity. (F) Percentage of total ASD allocated to 0 hours to Tro and Tro to 24 hours, respectively. (G) Cumulative locomotor activity over 96 hours normalized to the sum of the three 96-hour time windows indicated by brackets. Means ± SEM. n = 5. Two-way ANOVA with Bonferroni multiple comparison. *P < 0.05; **P < 0.01.
Fig. 7.
Fig. 7.. Loss of infradian rhythm generation capacity upon NAc-projecting DA neuronal ablation and two-oscillator model for BD cycling.
(A) 6-OHDA was bilaterally injected into the NAc to ablate dopaminergic processes. (B and C) TH immunolabeling of striatal and midbrain sections from saline-injected (B) and 6-OHDA–injected (C) animals. Scale bars, 500 μm. (D and E) Representative actograms showing running wheel activity of saline-injected (D) and 6-OHDA–injected (E) mice in constant darkness in response to escalating doses of Meth in drinking water. Lomb-Scargle periodograms correspond to the time interval indicated (blue bars). (F) Composite display of normalized periodograms from individual animals computed from the final 2 weeks of recording under Meth treatment. (G and H) Periodogram-derived highest peak in the 20- to 96-hour range before [(G), pre-Meth] and at the end of Meth treatment [(H), Meth]. Means ± SEM. n = 7. Mann-Whitney test. ***P < 0.001.
Fig. 8.
Fig. 8.. Two-oscillator model for BD cycling.
(A) Model actogram of daily wake periods alongside fluctuations in activity/energy/mood at a DO period of 48 hours. (B) Daily wake periods reflective of a DO operating at a frequency nonharmonious to the SCN clock. (C and D) Phase-locking or in-and-out of phase “beating” of the DO and SCN clock when frequencies are harmonious (C) or nonharmonious (D) resulting in mania-associated behavioral cycling. (E) Upon “activation,” the DO influences/dominates sleep-wake and mood/mania-associated behavioral rhythms.

Update of

References

    1. Uchiyama M., Lockley S. W., Non-24-hour sleep-wake rhythm disorder in sighted and blind patients. Sleep Med. Clin. 10, 495–516 (2015). - PubMed
    1. Emens J. S., St Hilaire M. A., Klerman E. B., Brotman D. J., Lin A. L., Lewy A. J., Czeisler C. A., Behaviorally and environmentally induced non-24-hour sleep-wake rhythm disorder in sighted patients. J. Clin. Sleep Med. 18, 453–459 (2022). - PMC - PubMed
    1. Richter C. P., Two day cycles of alternating good and bad behavior in psychotic patients. Arch. Neurol. Psychiatry 39, 587–598 (1938).
    1. Wehr T. A., Goodwin F. K., Wirz-Justice A., Breitmaier J., Craig C., 48-hour sleep-wake cycles in manic-depressive illness: Naturalistic observations and sleep deprivation experiments. Arch. Gen. Psychiatry 39, 559–565 (1982). - PubMed
    1. Welsh D. K., Nino-Murcia G., Gander P. H., Keenan S., Dement W. C., Regular 48-hour cycling of sleep duration and mood in a 35-year-old woman: Use of lithium in time isolation. Biol. Psychiatry 21, 527–537 (1986). - PubMed

LinkOut - more resources