. 2025 Jan 3;11(1):eadp3251.
doi: 10.1126/sciadv.adp3251. Epub 2025 Jan 1.

Transcription factor clusters as information transfer agents

Affiliations

Transcription factor clusters as information transfer agents

Rahul Munshi et al. Sci Adv. .

Abstract

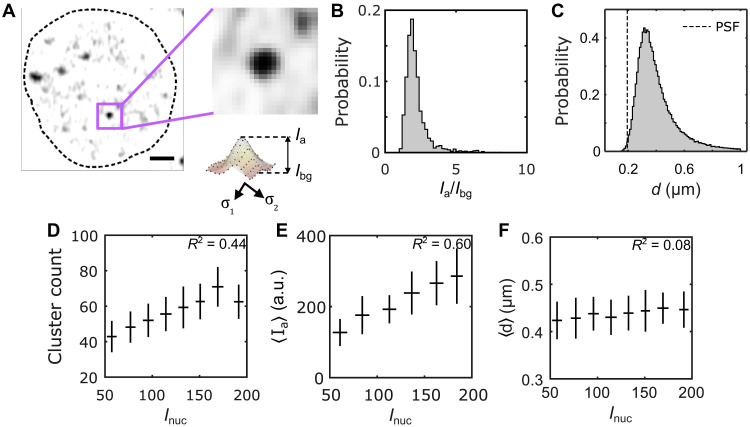
Deciphering how genes interpret information from transcription factor (TF) concentrations within the cell nucleus remains a fundamental question in gene regulation. Recent advancements have revealed the heterogeneous distribution of TF molecules, posing challenges to precisely decoding concentration signals. Using high-resolution single-cell imaging of the fluorescently tagged TF Bicoid in living Drosophila embryos, we show that Bicoid accumulation in submicrometer clusters preserves the spatial information of the maternal Bicoid gradient. These clusters provide precise spatial cues through intensity, size, and frequency. We further discover that Bicoid target genes colocalize with these clusters in an enhancer-binding affinity-dependent manner. Our modeling suggests that clustering offers a faster sensing mechanism for global nuclear concentrations than freely diffusing TF molecules detected by simple enhancers.


Figures

Fig. 1.
Fig. 1.. Quantitative characterization of nuclear Bcd heterogeneity.
(A and B) Confocal (Zeiss-Airyscan) images of cross sections of Bcd-GFP (A) and NLS-GFP (B) expressing blastoderm nuclei in living Drosophila embryos (NC14). Scale bars, 5 μm. The broken lines represent a guide to the eye for nuclear boundaries. (C) Pixel correlations computed on the nuclear pixels in 2D nuclear cross-sectional images (Materials and Methods) expressing Bcd-GFP (green, 44 nuclei from 5 embryos) and NLS-GFP (orange, 27 nuclei from 3 embryos) and from pixels within the cytoplasm of Bcd-GFP expressing embryos (gray, 5 embryos). For comparison, the objective’s point-spread-function (PSF) is in black. Inset shows mean and SDs of the computed correlation lengths l for nucleoplasmic Bcd-GFP (l = 0.24 ± 0.02 μm), nucleoplasmic NLS-GFP (l = 0.20 ± 0.02 μm), and cytoplasmic Bcd-GFP (l = 0.20 ± 0.02 μm). (D) Radial distribution function [or pair-correlation function, G(r)] for the local maxima distribution expressed as a function of distance r from the center. G(r) was calculated on time-projected (60 frames each) local intensity maxima centroid maps (fig. S5 and Materials and Methods), averaged over multiple nuclei [same nuclei and embryo count as in (C)]. A distinct peak in G(r) indicates temporally persistent confinement of the local maxima, as seen for Bcd-GFP-expressing nuclei. For NLS-GFP, the continuous reduction in the radial function suggests a gradual decline in intensity near the nuclear edges without submicrometer accumulations. The dashed line G(r)=1 corresponds to a perfectly uniform distribution, the Poisson limit.
Fig. 2.
Fig. 2.. Biophysical properties of Bcd clusters.
(A) A single nucleus showing Bcd-GFP heterogeneities. The close-up image (right) shows a single Bcd-GFP cluster. Cluster intensity fit with a 2D Gaussian (see profile below). The cluster amplitude Ia, the cluster background intensity Ibg, and the cluster size d are extracted from fit parameters (Materials and Methods). Scale bar, 1 μm. (B) A histogram of the signal-to-background ratio (Ia/Ibg) for 99,671 clusters from 2027 nuclei in 14 embryos expressing Bcd-GFP is plotted. (C) A histogram of the cluster size d, computed from the same clusters as in (B) is shown. The vertical dashed line representing the size of the PSF is included to compare with the size of the detected clusters. (D to F) The number of clusters per nucleus (D), the nuclear average of cluster amplitude 〈Ia〉 (E), and the nuclear average of cluster size 〈d〉 (F) are plotted against nuclear Bcd-GFP intensity, Inuc. Error bars represent the mean ± SD for data in each Inuc bin, calculated via bootstrap sampling of data within each bin. The coefficient of determination for each plot in (D), (E), and (F) is indicated in the respective panels.
Fig. 3.
Fig. 3.. Precision of cluster positional information potential.
(A) Overall Bcd-GFP nuclear intensity Inuc and the nuclear average of Bcd-GFP cluster intensity 〈Ic〉 as a function of nuclear position x/L (with embryo length L). 〈Ic〉 measures the molecular count within the clusters (fig. S10 and Materials and Methods). The y axis is in natural logarithm units. Blue (Inuc) and green (Ic) shaded data points represent individual nuclei (2027 nuclei in 14 embryos). Data are partitioned in x/L bins (mean and SD shown, error bars calculated from bootstrapping; exponential decay constants extracted from linear fits (solid lines) with λInuc=0.23±0.03L and λIc=0.26±0.02L). (B) Coefficients of variation (c.v.) σ/μ for Inuc and 〈Ic〉 as a function of x/L bins. (C) Errors in determination of nuclear positions using Inuc (red) and 〈Ic〉 (gray) as a function of x/L bins (obtained via error propagation, Materials and Methods). For (B) and (C), gray and red shades indicate the overall mean ± SD across all positions for 〈Ic〉 and Inuc, respectively.
Fig. 4.
Fig. 4.. Bcd cluster colocalizes with target genes.
(A) Cartoon showing scheme for dual color imaging with Bcd-GFP (green) and nascent transcription site labeled via the MS2/MCP system (magenta). (B) Images from embryos in NC14 showing nuclei expressing Bcd-GFP and hb-MS2/MCP-mRuby on sites of active transcription (arrows); scale bars, 1 μm. Dashed lines are a guide to the eye for nuclear boundaries. (C) Radial distribution of Bcd-GFP intensity around the centroid of the fluorescently labeled gene locus (i.e., hotspot). Data shown for canonical Bcd target genes, hb (102 nuclei, 13 embryos), eve (66 nuclei, 8 embryos), Kr (107 nuclei, 11 embryos), kni (90 nuclei, 6 embryos), and the nontarget gene bnk (56 nuclei, 10 embryos). Dashed line (r0 = 0.44 ± 0.05 μm) is twice the FWHM averaged over all genes. Data are obtained from simultaneous imaging of Bcd-GFP and MCP-mRuby3, marking the nascent transcription hotspots of the respective genes (Materials and Methods). (D) Schematic showing the mRNA hotspot (red) and its nearest Bcd cluster (green). When the distance r between the nearest cluster and the hotspot is less than the Bcd accumulation radius r0, the cluster is defined as being coupled to the gene; when it is greater than r0, the cluster is assumed to be uncoupled (see also fig. S13). (E) Cumulative probability distributions of distances r between the mRNA hotspot and its nearest cluster, computed for the same data as in (C). Dashed line is the median at EC50 (median effective concentration). Inset: Median distances for all genes. Errors are calculated from bootstrapping.
Fig. 5.
Fig. 5.. Bcd cluster colocalization is enhancer dependent.
(A) Distributions of transcription hotspot intensities from a synthetic strong (blue, 541 nuclei, 17 embryos) and weak (magenta, 406 nuclei, 20 embryos) enhancer constructs driving an MS2-fusion reporter (Materials and Methods and fig. S14). The strong construct generates a 3.2-fold higher intensity than the weak construct, on average. Boxes represent the first and the third quartiles, while the whiskers represent the 5th and the 95th percentiles. The medians (black lines inside the boxes) are 5.1 and 1.7 for the strong and the weak enhancers, respectively. (B) Radial distributions of relative Bcd-GFP intensities around the centroid of the transcription hotspot. The accumulation radii are statistically identical (0.36 ± 0.05 μm and 0.39 ± 0.06 μm for strong and weak enhancer constructs, respectively). (C) Cumulative probability distributions of distances r between the transcription hotspot and its nearest Bcd cluster. The black dashed line is at EC50. The median distances are 0.49 ± 0.03 μm and 0.78 ± 0.05 μm for the strong and weak constructs, respectively. Inset shows the fraction of transcription hotspot coupled to a cluster for each construct (31 and 13%, respectively).
Fig. 6.
Fig. 6.. Clustering reduces time to precise concentration interpretation.
(A and B) Two cartoons show Bcd molecules in the nucleus (green circles) and a cluster of diameter d (A) embedded in the nuclear environment and an enhancer with a binding site of length b (B). The equation in (B) is for the time taken by a sensor of size a for nuclear concentration c with an accuracy of dNN, where N is the number of molecules counted. (C) Reduction of time gT to make an accurate (i.e., ∼10%) nuclear concentration estimation as a function of the nuclear position with the cluster as nuclear concentration sensor versus an enhancer binding site being the concentration sensor (35).

Update of

Similar articles

Cited by

References

    1. Spitz F., Furlong E. E., Transcription factors: From enhancer binding to developmental control. Nat. Rev. Genet. 13, 613–626 (2012). - PubMed
    1. Panigrahi A., O’Malley B. W., Mechanisms of enhancer action: The known and the unknown. Genome Biol. 22, 108 (2021). - PMC - PubMed
    1. Trojanowski J., Rippe K., Transcription factor binding and activity on chromatin. Curr. Opin. Systs. Biol. 31, 100438 (2022).
    1. Rosenfeld N., Young J. W., Alon U., Swain P. S., Elowitz M. B., Gene regulation at the single-cell level. Science 307, 1962–1965 (2005). - PubMed
    1. Park J., Estrada J., Johnson G., Vincent B. J., Ricci-Tam C., Bragdon M. D., Shulgina Y., Cha A., Wunderlich Z., Gunawardena J., DePace A. H., Dissecting the sharp response of a canonical developmental enhancer reveals multiple sources of cooperativity. eLife 8, e41266 (2019). - PMC - PubMed

MeSH terms

LinkOut - more resources