. 2025 Jan;637(8045):461-469.
doi: 10.1038/s41586-024-08317-9. Epub 2025 Jan 1.

FBP1 controls liver cancer evolution from senescent MASH hepatocytes

Collaborators, Affiliations

FBP1 controls liver cancer evolution from senescent MASH hepatocytes

Li Gu et al. Nature. 2025 Jan.

Erratum in

  • Author Correction: FBP1 controls liver cancer evolution from senescent MASH hepatocytes.
    Gu L, Zhu Y, Nandi SP, Lee M, Watari K, Bareng B, Ohira M, Liu Y, Sakane S, Carlessi R, Sauceda C, Dhar D, Ganguly S, Hosseini M, Teneche MG, Adams PD, Gonzalez DJ, Kisseleva T; Liver Cancer Collaborative; Tirnitz-Parker JEE, Simon MC, Alexandrov LB, Karin M. Gu L, et al. Nature. 2025 Feb;638(8051):E30. doi: 10.1038/s41586-025-08653-4. Nature. 2025. PMID: 39890899 Free PMC article. No abstract available.

Abstract

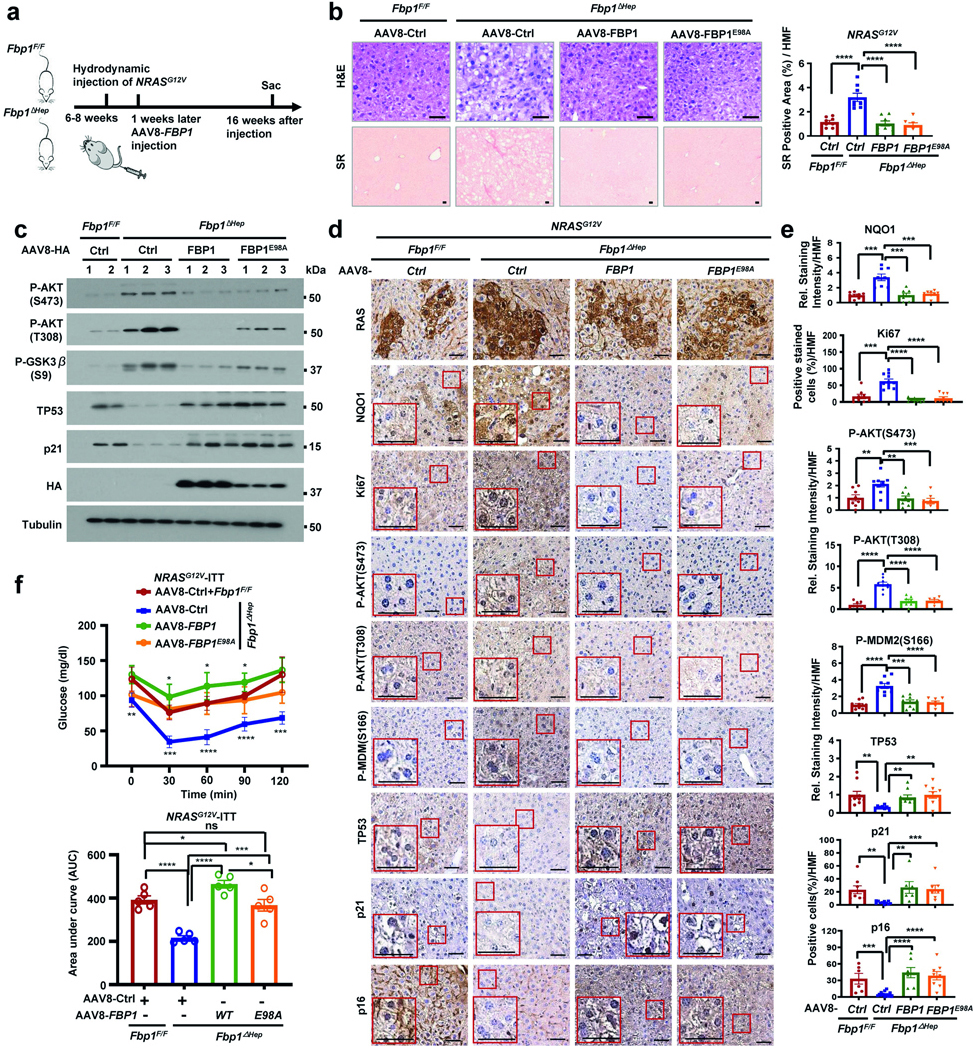
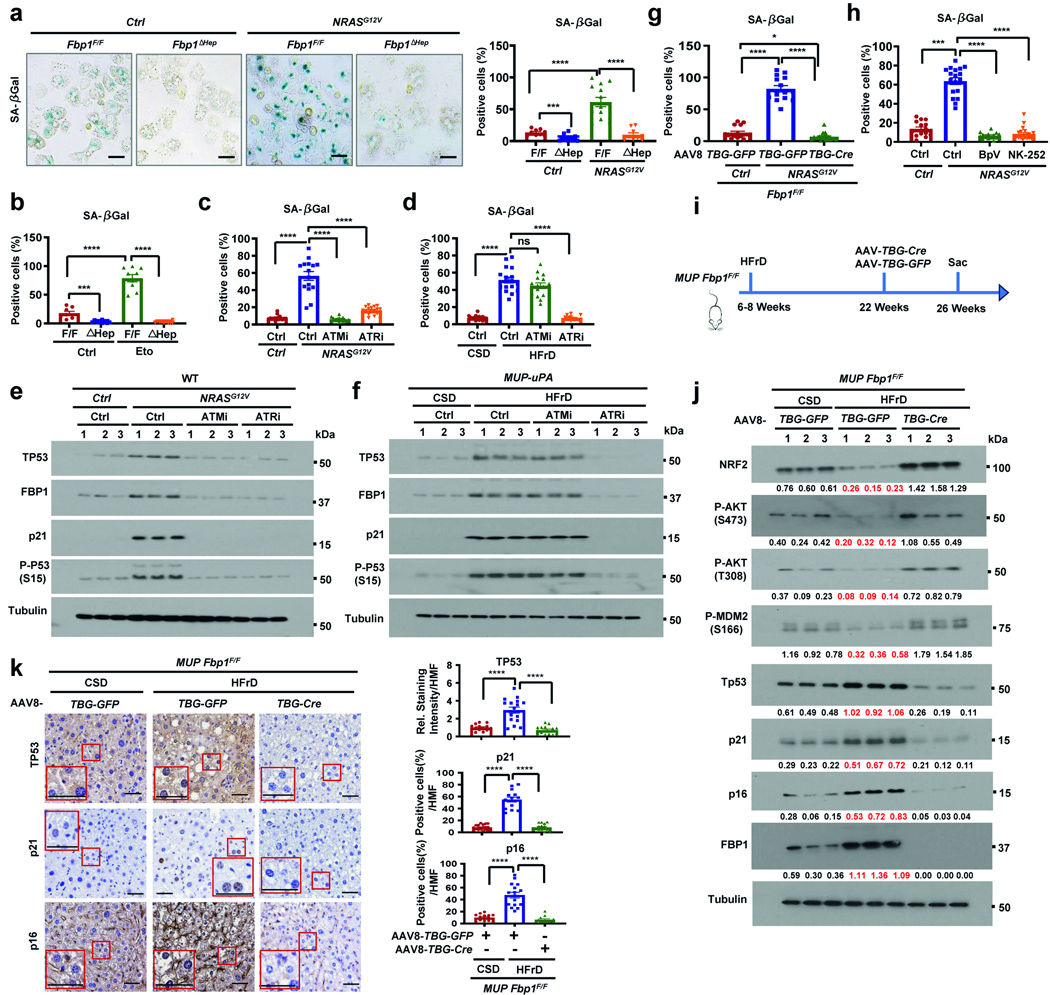
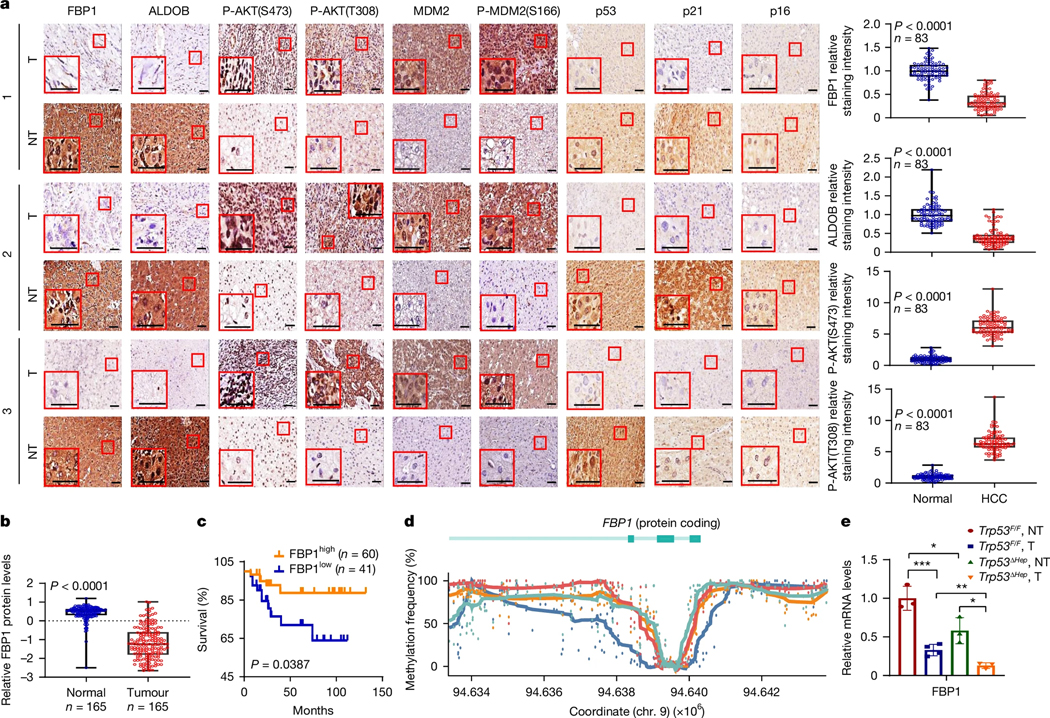
Hepatocellular carcinoma (HCC) originates from differentiated hepatocytes undergoing compensatory proliferation in livers damaged by viruses or metabolic-dysfunction-associated steatohepatitis (MASH)1. While increasing HCC risk2, MASH triggers p53-dependent hepatocyte senescence3, which we found to parallel hypernutrition-induced DNA breaks. How this tumour-suppressive response is bypassed to license oncogenic mutagenesis and enable HCC evolution was previously unclear. Here we identified the gluconeogenic enzyme fructose-1,6-bisphosphatase 1 (FBP1) as a p53 target that is elevated in senescent-like MASH hepatocytes but suppressed through promoter hypermethylation and proteasomal degradation in most human HCCs. FBP1 first declines in metabolically stressed premalignant disease-associated hepatocytes and HCC progenitor cells4,5, paralleling the protumorigenic activation of AKT and NRF2. By accelerating FBP1 and p53 degradation, AKT and NRF2 enhance the proliferation and metabolic activity of previously senescent HCC progenitors. The senescence-reversing and proliferation-supportive NRF2-FBP1-AKT-p53 metabolic switch, operative in mice and humans, also enhances the accumulation of DNA-damage-induced somatic mutations needed for MASH-to-HCC progression.


Conflict of interest statement

Competing interests: M.K. is a founder and stockholder in Elgia Pharmaceuticals and received research support from Merck and Janssen Pharmaceuticals and holds a patent for the use of MUP-uPA mice as a NASH-HCC model. L.B.A. is a compensated consultant and has equity interest in io9 and Genome Insight; his spouse is an employee of Biotheranostics. L.B.A. is also listed as an inventor on US Patent 10,776,718 for source identification by non-negative matrix factorization. L.B.A. declares US provisional applications with the following serial numbers: 63/289,601, 63/269,033, 63/483,237, 63/366,392 and 63/367,846. L.B.A. and S.P.N. also declare US provisional applications with serial numbers 63/412,835 and 63/492,348. The other authors declare no competing interests.

Figures

Extended Data Fig. 1 |
Extended Data Fig. 1 |. FBP1, ALDOB and TP53 are downregulated in human HCC.
a, Relative staining intensities of the indicated proteins from Fig. 1a. b, Relative ALDOB amounts in NT and T tissues from the CPTAC-LIHC database. c, Relative FBP1 and ALDOB amounts in NT and T tissues from the PXD006512-LIHC database. d, Percent survival of PXD006512-LIHC patients stratified according to ALDOB expression by “best expression cut-off”. Significance determined by log-rank test. e, FBP1 expression in TCGA-LIHC with WT (n = 308) and mutant (n = 107) TP53. f, Relative FBP1 promoter methylation levels in the TCGA-LIHC database. g, Relative FBP1 promoter methylation levels in HCC patients from the TCGA database. Low and high were defined as in Methods. h-j, Relative promoter methylation levels of G6PC (h), PCK1 (i) and TP53 ( j) in the TCGA-LIHC database. Data in a, b, c, e, f, h, i and j are mean ± SEM. Statistical significance determined by two-sided unpaired t-test or Mann–Whitney U test (a, b, c, e, f, h, i and j) based on data normality distribution. **P < 0.01, ***P < 0.001, ns, not significant. Box plots show center line (median), box limits (first and third quartiles) and whiskers (outer data points).
Extended Data Fig. 2 |
Extended Data Fig. 2 |. FBP1 is transcriptionally activated by TP53.
a, Schematic of the FBP1 gene 5′ and 3′ regions, showing putative TP53 binding sites and amplicons used for ChIP-qPCR. b, Relative amounts of Fbp1, p21 and Tp53 mRNAs in primary hepatocytes from Tp53F/F and Tp53ΔHep mice. c, IB demonstrating shRNA mediated TP53 knockdown and FBP1 downregulation in human hepatocytes. d, Relative FBP1, p21CIP1 and TP53 mRNA amounts in human primary hepatocytes stably transfected with shCtrl, shTP53#1 and shTP53#2. e, f, Relative FBP1, p21CIP1 and TP53 mRNAs in HepG2 (e) and SK-HEP-1 (f) cells stably transfected with shCtrl, shTP53#1 and shTP53#2. IB showing TP53 knockdown in SK-HEP-1 cells is on the right. g-j, ChIP-qPCR probing TP53 recruitment to the Fbp1 gene in Tp53F/F and Tp53ΔHep livers (g), SK-HEP-1 (h), HepG2 (i) and Huh7 ( j) cells (n = 3 BR each). k, Relative FBP1, p21CIP1and TP53 mRNAs (left, middle) and proteins (right) in NCD and HFD and CSD and HFrD fed Tp53F/F and Tp53ΔHep mice (16 weeks; n = 5 biological replicates/BR). Quantification of relative normalized protein amounts is shown below each strip. Data in b, d, e, f, g, h, i, j and k are mean ± SEM. Statistical significance determined by two-sided unpaired t-test or Mann–Whitney U test (b, g, h, i and j) and one-way ANOVA with Tukey post-hoc tests or Kruskal–Wallis test with Dunn post-hoc tests (d, e, f and k) based on data normality distribution. *P < 0.05, **P < 0.01, ***P < 0.001, ****P < 0.0001, ns, not significant.
Extended Data Fig. 3 |
Extended Data Fig. 3 |. FBP1 and TP53 are induced in MASH and blunt diet-induced DNA damage.
a, IB analysis of the indicated proteins in livers of HFrD-fed MUP-uPA mice collected at the indicated time points. Quantification of relative normalized protein amounts is shown below each strip. b, Frozen liver sections from the indicated mice stained for 53BP1 and P-γH2AX (n = 4–5 BR). Scale bars, 10 μm. Quantification of 53BP1- and P-γH2AX-positive cells per HMF is shown underneath. c, IB analysis of the indicated liver proteins after 22 weeks of CSD or HFrD feeding. MW markers, densitometric quantification of protein ratios (HFrD/CSD) and P values are on the right. d, Representative IHC of MUP-uPA livers after 32 weeks of HFrD feeding (n = 4–5 BR). Scale bars, 50 μm. Quantification of staining intensity/HMF of indicated proteins is shown underneath. e, MUP-uPA/Fbp1F/F and MUP-uPA/Fbp1ΔHep livers at 22 weeks of CSD or HFrD. f, g Representative IHC (f) and Image J (g) quantification of MUP-uPA/Fbp1F/F and MUP-uPA/Fbp1ΔHep livers in 22 weeks after HFrD (n = 7–9 BR). Scale bars, 50 μm. Data in b, c, d and g are mean ± SEM. Statistical significance determined by one-way ANOVA with Tukey post-hoc tests or Kruskal–Wallis test with Dunn post-hoc tests (b, g) and two-sided unpaired t-test or Mann–Whitney U test (d) based on data normality distribution. *P < 0.05, **P < 0.01, ***P < 0.001, ****P < 0.0001.
Extended Data Fig. 4 |
Extended Data Fig. 4 |. FBP1 and TP53 are induced in human MASH and downregulated in daHep.
a, Relative FBP1 and ALDOB expression from the GSE162694 human normal and MASH liver dataset (normal, n = 31; MASH, 0, n = 35; 1, n = 30; 2, n = 27; 3, n = 8; 4, n = 12). b, Representative IHC of human normal and MASH livers (n = 7–9 BR). Image J quantifications are to the right. c, SR staining and 53BP1 and P-γ-H2AX IHC of human normal and MASH liver tissues (n = 7–9 BR). Image J quantification is shown underneath. d, UMAP visualizations and unsupervised clustering of 78250 hepatocyte nuclei from integrated GSE185477, GSE174748, GSE192742 and GSE212046 datasets. Five hepatocyte subsets were annotated based on gene expression and liver pathology metadata (top left). FBP1 and TP53 expression shown by UMAP visualization (top right and bottom left). NRF2 pathway signatures containing n = 141 target genes in daHep and HCC are shown in the bottom right. The location of daHep nuclei is highlighted by blue ellipses. e, UMAP visualizations and unsupervised clustering of 12,540 mouse hepatocyte nuclei from the GSE200366 dataset. Four subsets previously identified, three representing normal hepatocyte zonation (Zone_1_Hep, Zone_2_Hep, Zone_3_Hep) and one daHep cluster. Density maps of Fbp1 and Dnmt1 mRNA expression in the UMAP space are shown with the daHep cluster highlighted by blue ellipses. Data in a, b and c are mean ± SEM. Statistical significance determined by one-way ANOVA with Tukey post-hoc tests or Kruskal–Wallis test with Dunn post-hoc tests (a) and two-sided unpaired t-test or Mann–Whitney U test (b, c) based on data normality distribution. *P < 0.05, **P < 0.01, ****P < 0.0001. Box plots show center line (median), box limits (first and third quartiles) and whiskers (outer data points).
Extended Data Fig. 5 |
Extended Data Fig. 5 |. Fbp1 ablation promotes MASH to HCC progression.
a, Normal hepatocytes and HCC progenitor cells (HcPC) were isolated from 22 weeks HFrD fed MUP-uPA/Fbp1F/F and MUP-uPA/Fbp1ΔHep livers (n = 5). Numbers/liver and diameters of aggregates are shown underneath. Scale bars, 100 μm. b, c, IB analysis of the indicated proteins in normal hepatocytes and HcPC from a. MW markers, densitometric quantification of protein ratios (HcPC/Normal hepatocytes) and P values are depicted on the right. d, Tumour numbers (left) and volumes (right) of MUP-uPA/Fbp1F/F and MUP-uPA/Fbp1ΔHep livers after 40 weeks of HFrD (n = 5–7 BR each). e, Representative CD44, MYC, and AFP staining of liver sections from above mice. Scale bars, 50 μm. Relative staining intensities per HMF are below. f, IB analysis of liver lysates from above mice prepared after 40 weeks of HFrD. MW markers, densitometric quantification of protein ratios (MUP-uPA/Fbp1ΔHep/MUP-uPA/Fbp1F/F) and P values are shown on the right. g, Tumour numbers (left) and volumes (right) of MUP-uPA/Fbp1F/F and MUP-uPA/Fbp1ΔHep livers after 40 weeks of HFrD +/− Nutlin-3a treatment (25 mg/kg) 2x/week for 8 weeks (n = 4–5 BR). h, MUP-uPA/Fbp1F/F and MUP-uPA/Fbp1ΔHep livers were transduced with AAV8-Ctrl, AAV8-FBP1 and AAV8-FBP1E98A 6–8 weeks after HFrD initiation (n = 4–5 BR). Mice were examined at 40 weeks. Tumour numbers (left) and volumes (right) are shown. Data in a, d, e, g and h are mean ± SEM. Statistical significance determined by two-sided unpaired t-test or Mann–Whitney U test (a, d and e) and one-way ANOVA with Tukey post-hoc tests or Kruskal–Wallis test with Dunn post-hoc tests (g, h) based on data normality distribution. *P < 0.05, **P < 0.01, ***P < 0.001, ****P < 0.0001.
Extended Data Fig. 6 |
Extended Data Fig. 6 |. FBP1 loss and AKT activation license NRASG12V-induced tumorigenesis.
a, Overall survival of Fbp1F/F and Fbp1ΔHep mice receiving NRASG12V HTVI (n = 6–8 each). Significance was determined by log-rank test. b, IHC analysis of Fbp1F/F and Fbp1ΔHep livers at the indicated times post-NRASG12V HTVI (n = 4–5 BR per time point). Scale bars, 50 μm. c, Relative staining intensities per HMF from b. d, IB of liver lysates 1, 4, and 12 weeks after NRASG12V HTVI of Fbp1F/F and Fbp1ΔHep mice. e, f, IHC of FFPE liver sections from indicated mice livers(e). Scale bars, 50 μm. Relative staining intensities (f). g, IB of NT and T lysates of Fbp1ΔHep mice 16 weeks after NRASG12V HTVI. h, IB of Tp53F/F and Tp53ΔHep liver lysates 1 and 4 weeks post NRASG12V HTVI. Data in c and f are mean ± SEM. Statistical significance determined by two-sided unpaired t-test or Mann–Whitney U test (c, f) based on data normality distribution. *P < 0.05, **P < 0.01, ***P < 0.001, ****P < 0.0001.
Extended Data Fig. 7 |
Extended Data Fig. 7 |. FBP1 inhibits NRASG12V-induced tumorigenesis regardless of its catalytic activity.
a, Schematic of NRASG12V HTVI followed by AAV8 viral transduction. b, H&E and SR staining of liver sections from Fig. 3e (n = 4–5 BR). Scale bars, 50 μm. SR staining intensities per HMF determined by Image J are shown to the right. c, IB analysis of Fbp1F/F and Fbp1ΔHep liver lysates from Fig. 3e. d, IHC of FFPE liver sections from 3e. Scale bars, 50 μm. e, Relative staining intensities per HMF determined by Image J of d. f, ITT of mice from Fig. 3e. AUC quantifications are shown below. Data in b, e and f are mean ± SEM. Statistical significance determined by one-way ANOVA with Tukey post-hoc tests or Kruskal–Wallis test with Dunn post-hoc tests (b, e and f) based on data normality distribution. *P < 0.05, **P < 0.01, ***P < 0.001, ****P < 0.0001, ns, not significant.
Extended Data Fig. 8 |
Extended Data Fig. 8 |. SA-β-Gal expression in primary hepatocytes and its ATM/ATR dependence.
a, b, Primary Fbp1F/F and Fbp1ΔHep hepatocytes were transduced with NRASG12V (a) or treated with etoposide (20 μM, 12 h) (b) and stained for SA-β-Gal (n = 4 BR). Scale bars, 100 μm. Image J quantification is shown on the right of a and in b. c, Image J quantification of primary hepatocytes prepared from WT mice 8 weeks post-HTVI with Ctrl or NRASG12V that were treated with ATMi (KU60019, 5 μM) or ATRi (AZD6738, 2 μM) for 6 h before SA-β-Gal staining (n = 4 BR). d, Image J quantification of primary hepatocytes prepared from MUP-uPA mice fed for 22 weeks with CSD or HFrD and treated with ATMi (KU60019, 5 μM) or ATRi (AZD6738, 2 μM) for 6 h before staining for SA-β-Gal (n = 3 BR). e, f, IB analysis of WT livers after 12 weeks HTVI of Ctrl or NRASG12V (e) and MUP-uPA mice fed with CSD and HFrD for 22 weeks (f). All mice were injected with ATMi (KU60019, 10 mg/kg) or ATRi (AZD6738, 10 mg/kg) 2x/week for 4 weeks (n = 4 BR). g, Primary hepatocytes prepared from 8 weeks old Fbp1F/F mice, were transfected with NRASG12V and after 2 days were infected with AAV-TBG-GFP and AAV-TBG-Cre (107 virus copies per well) for 2 days before staining for SA-β-Gal (n = 3 BR). Image J quantification is shown. h, Primary hepatocytes from WT mice were transfected with NRASG12V and after 2 days were treated with BpV (1 μM) and NK252 (2 μM) for 20 h before staining for SA-β-Gal (n = 3 BR). Image J quantification is shown. i, Experimental scheme. MUP-uPA/Fbp1F/F mice were fed HFrD for 22 weeks, infected with AAV-TBG-Cre and AAV-TBG-GFP and analysed 4 weeks later (n = 5 BR). j, IB analysis of liver lysates from above mice. Quantification of relative normalized protein amounts is shown below each strip. k, IHC of FFPE liver sections from above mice. Scale bars, 50 μm. Relative staining intensities per HMF determined by Image J are shown to the right. Data in a, b, c, d, g, h and k are mean ± SEM. Statistical significance determined by one-way ANOVA with Tukey post-hoc tests or Kruskal–Wallis test with Dunn post-hoc tests (a, b, c, d, g, h and k) based on data normality distribution. *P < 0.05, ***P < 0.001, ****P < 0.0001, ns, not significant.
Extended Data Fig. 9 |
Extended Data Fig. 9 |. NRF2 activation licences NRASG12V-induced HCC development.
a-d, IHC of FFPE liver sections from Nrf2Tg/Tg and Nrf2Act-Hep livers 1, 4, 12 and 16 weeks after NRASG12 HTVI (n = 4–5 BR) (a, c). Scale bars, 50 μm. Relative staining intensities per HMF determined by Image J (b, d). e, Tumour numbers and volumes in Nrf2Tg/Tg and Nrf2Act-Hep mice 12 and 16 weeks after HTVI of NRASG12V (n = 4–5 BR). Data in b, d and e are mean ± SEM. Statistical significance determined by two-sided unpaired t-test or Mann–Whitney U test (b, d) and Kruskal–Wallis test with Dunn post-hoc tests (e) based on data normality distribution. **P < 0.01, ***P < 0.001, ****P < 0.0001.
Extended Data Fig. 10 |
Extended Data Fig. 10 |. NRF2 and FBP1 inversely control cell senescence and proliferation genes.
a, Venn diagram showing overlap in upregulated genes in Nrf2Act-Hep vs Nrf2Tg/Tg and Fbp1ΔHep vs Fbp1F/F livers (n = 3 BR). b, Venn diagram showing overlap in downregulated genes in Nrf2Act-Hep vs Nrf2Tg/Tg and Fbp1ΔHep vs Fbp1F/F livers (n = 3 BR). c, GO BP enrichment analysis of the overlapping upregulated genes in Nrf2Act-Hep vs. Nrf2Tg/Tg and Fbp1ΔHep vs. Fbp1F/F livers 1 week after NRASG12V HTVI (n = 3 BR). Dot size corresponds to the number of genes associated with each GO BP term, and dot colour corresponds to statistical significance. d, GO BP enrichment analysis of overlapping downregulated genes in Nrf2Act-Hep vs. Nrf2Tg/Tg and Fbp1ΔHep vs. Fbp1F/F livers 1 week after NRASG12V HTVI (n = 3 BR). e, f, Venn diagrams depicting the overlap in genes that are upregulated (e) or downregulated (f) in Fbp1ΔHep vs. Fbp1F/F, Nrf2Act-Hep vs. Nrf2Tg/Tg and Tp53ΔHep vs. Tp53F/F NCD livers. g, h, Venn diagrams depicting the overlap in genes that are upregulated (g) or downregulated (h) in Fbp1ΔHep vs. Fbp1F/F, Nrf2Act-Hep vs. Nrf2Tg/Tg 1 week after NRASG12V HTVI and Tp53ΔHep vs. Tp53F/F HFD-fed livers. i, j, Heatmaps representing cell-senescence- (i) and cell-cycle- (j) associated genes in Nrf2Act-Hep livers 3 weeks after NRASG12V HTVI followed by AAV8-Ctrl and AAV8-FBP1 transduction (n = 3 BR).
Extended Data Fig. 11 |
Extended Data Fig. 11 |. NRF2 activation and FBP1 loss enable propagation of NRAS induced mutations.
a, INDEL types in HCCs from MUP-uPA/Fbp1ΔHep mice fed HFrD or HFD for 40 weeks. b, Mutational signatures displayed based on trinucleotide frequency of HFD-induced MUP-uPA/Fbp1ΔHep HCCs (1 tumour per run). c, d Duplex sequencing showing the number of mutations (c) and INDELs (d) in each signature in the indicated mice. NT- non-tumour, T-tumour. e, Number of mutations in each INDEL signature expressed as somatic mutations per megabase in HCCs from NRASG12V transduced Nrf2Act-Hep livers. f, g, Number of mutations and INDEL types in HCCs of NRASG12V transduced Nrf2Act-Hep livers for 16 weeks.
Extended Data Fig. 12 |
Extended Data Fig. 12 |. HCC emerges from senescent progenitors.
a, Schematic representation of the p21-Cre construct. The diagram was created using BioRender. b, Relative Cre and p21CIP1 mRNA amounts in primary hepatocytes transfected with the indicated vectors and treated +/− etoposide (20 μM, 48 h) (n = 3 BR). c, Schematic of experimental protocol. Mice were transduced with the indicated AAV8 vectors 2 weeks (day −14) before NRASG12V HTVI. Two weeks later, the mice were i.p. injected with PTENi (BpV) (0.5 mg/kg) or Ctrl for 8 weeks and were sacked at 16 weeks post HTVI (n = 3 BR) for HCC analysis. d, IB analysis of the indicated proteins in liver lysates from above mice. Quantification of relative normalized protein amounts is shown underneath each strip. e, f H&E and IHC of FFPE liver sections from above mice. Scale bars, 20 μm. Relative staining intensities per HMF were determined by Image J are shown to the right. g, Tumour numbers (top) and volumes (bottom) in mT/mG livers transduced with AAV8-Ctrl, AAV8-TBG-Cre or AAV8-p21-Cre 2 wks prior to NRASG12 HTVI, followed by BpV (HOpic, 0.5 mg/kg) or Ctrl i.p. injections 2x/wk for 8 wks and analysis at 16 wks post-HTVI (n = 3 each). Data in b, e, f and g are mean ± SEM. Statistical significance determined by two-sided unpaired t-test or Mann–Whitney U test (e, f and g) and Kruskal–Wallis test with Dunn post-hoc tests (b) based on data normality distribution. **P < 0.01, ***P < 0.001, ****P < 0.0001.
Fig. 1 |
Fig. 1 |. p53 dependence, FBP1 downregulation and promoter hypermethylation in human HCC.
a, Representative IHC analysis of 83 human HCC tumour (T) and adjacent NT tissues. Scale bars, 50 μm. The relative staining intensities (Methods) are shown on the right. b, The relative FBP1 amounts in NT and tumour tissues in the CPTAC-LIHC database. c, PXD006512-LIHC patient survival stratified according to FBP1 expression by best expression cut-off. Significance was determined using a log-rank test. d, FBP1 promoter and 5′ region (chromosome (chr.) 9:94633352–94643777) methylation frequency at individual CpG sites (coloured dots; blue, NT hepatocytes; red, HCC). e, Relative Fbp1 mRNA in WT and Trp53ΔHep tumour and NT tissues 9 months after DEN injection. n = 3 biological replicates. For a,b,e, data are mean ± s.e.m. Statistical significance was determined using two-sided unpaired t-tests or Mann–Whitney U-tests (a,b) and Kruskal–Wallis tests with Dunn post hoc test (e) based on data normality distribution; *P < 0.05, **P < 0.01, ***P < 0.001. The box plots show the median (centre line), first and third quartiles (box limits) and outlier datapoints (whiskers).
Fig. 2 |
Fig. 2 |. DNA-damage-induced FBP1 and p53 upregulation in MASH.
a, Immunoblot (IB) analysis of liver lysates from MUP-uPA mice fed CSD or HFrD for 22 weeks. Molecular masses are shown on the on the right. b, Representative comet assays of isolated hepatocytes. n = 3 biological replicates. Original magnification, ×10. Scale bars, 100 μm. Tail DNA and comet tail length quantifications are shown on the right. HMF, high magnification field. c, Representative IHC analysis of MUP-uPA livers at 22 weeks of HFrD. Scale bars, 50 μm. The relative staining intensities of normal versus early neoplastic hepatocytes are shown on the right. d, Relative FBP1 (left) and ALDOB (right) amounts in low- and advanced-fibrosis human MASLD proteomes. e, Representative and quantified comet assays of hepatocytes (hepa) and HcPCs. n = 3 biological replicates. Original magnification, ×10. Scale bars, 100 μm. f, Mouse hepatocyte subtype distribution, as determined using snRNA-seq. n = 3. g, Immunoblot analysis of liver lysates collected at 22 weeks of HFrD. For bf, data are mean ± s.e.m. Statistical significance was determined using one-way analysis of variance (ANOVA) with Tukey post hoc tests or Kruskal–Wallis test with Dunn post hoc tests (b,e) and two-sided unpaired t-test or Mann–Whitney U-test (c,d,f) based on data normality distribution; NS, not significant; ****P < 0.0001. The box plots show the median (centre line), first and third quartiles (box limits) and outlier datapoints (whiskers).
Fig. 3 |
Fig. 3 |. FBP1 or p53 loss and AKT activation license NRASG12V tumorigenesis.
a, Tumour numbers (left) and volumes (right) in Fbp1F/F and Fbp1ΔHep livers 12 and 16 weeks after NRASG12V HTVI. n = 4–5 biological replicates. b, Sirius Red staining and AFP, CD44 and MYC IHC at 16 weeks after NRASG12V HTVI. Scale bars, 50 μm. Quantified Sirius-Red-positive areas and relative staining intensities are shown on the right. c, Immunoblot analysis of the indicated liver lysates at 16 weeks after NRASG12V HTVI. d, Tumour numbers (top) and volumes (bottom) of Trp53F/F and Trp53ΔHep livers 12 weeks after NRASG12V HTVI. n = 4–5 biological replicates. e, The tumour numbers (top) and volumes (bottom) of Fbp1F/F and Fbp1ΔHep livers transduced with AAV8-Ctrl, AAV8-FBP1 and AAV8-FBP1(E98A) were examined 16 weeks after NRASG12V HTVI, respectively. n = 4–5 biological replicates. f, The tumour numbers (left) and volumes (right) of the indicated livers 16 weeks after NRASG12V HTVI with or without MK2206 (100 mg per kg) treatment for the last 6 weeks. n = 4 biological replicates. g, Immunoblot analysis of liver lysates from f. h, The tumour numbers (top) and volumes (bottom) of the indicated livers at 16 weeks after NRASG12V HTVI with or without nutlin-3a (25 mg per kg) treatment for the last 6 weeks. n = 4 biological replicates. For a,b,df,h, data are mean ± s.e.m. Statistical significance was determined using one-way ANOVA with Tukey post hoc tests or Kruskal–Wallis test with Dunn post-hoc tests (a,e,f,h) and two-sided unpaired t-tests or Mann–Whitney U-tests (b,d) based on data normality distribution.
Fig. 4 |
Fig. 4 |. NRF2-induced FBP1 degradation relieves senescence to license tumorigenesis.
a, NRF2 distribution in HCC cells transfected with control (Ctrl) or FBP1 short hairpin RNA (shFBP1). n = 3 biological replicates. Scale bars, 10 μm. b, Immunoblot analysis of liver lysates from 8-week-old Nrf2Tg/Tg and Nrf2Act-Hep mice. c, Immunoblot analysis of liver lysates from 9-month-old Atg7F/F and Atg7ΔHep mice. d, Immunoblot analysis of MYC–NRF2(E79Q)-expressing HCC cells treated with ERKi (SCH772984), MEKi (PD98059) or AKTi (MK2206) at 5 μM for 6 h. e, Co-immunoprecipitation (co-IP) analysis of V5–FBP1 with Flag–TRIM28 from lysates of HEK293T cells that were transfected with or without HA–ERK2(GOF) and proteasome inhibitor (MG132; 10 μM, 6 h) treatment. Gel-separated co-IPs were immunoblotted using anti-Flag antibodies. f, TRIM28-induced ubiquitylation of transfected V5–FBP1 variants in MG132-treated (10 μM, 6 h) HEK293T cells. Gel-separated V5 immunoprecipitates were immunoblotted with anti-MYC antibodies. Blots represent at least three biological replicates. WCL, whole-cell lysates. g, Representative NQO1 and P-ERK1/2 IHC in tumour and NT tissues of 83 human HCCs. Scale bars, 50 μm.
Fig. 5 |
Fig. 5 |. NRF2 and FBP1 inversely affect the hepatocyte transcriptome.
a, Gene Ontology Biological Process (GO BP) enrichment analysis of overlapping upregulated genes in Nrf2Act-Hep versus Nrf2Tg/Tg and Fbp1ΔHep versus Fbp1F/F livers. n = 3 biological replicates. The dot size and colour represent gene number and statistical significance, respectively. b, Gene Ontology Biological Process enrichment analysis of overlapping downregulated genes in Nrf2Act-Hep versus Nrf2Tg/Tg and Fbp1ΔHep versus Fbp1F/F liver. n = 3 biological replicates. c, Heat maps of cell senescence mRNAs in Nrf2Tg/Tg and Nrf2Act-Hep livers 1 week after control or NRASG12V HTVI. d, Heat maps of cell-cycle mRNAs in the above livers. e, Cell senescence (CS) (top) and cell cycle (bottom) scores of FBP1 protein amounts in CPTAC-LIHC data. n = 330. For e, data are mean ± s.e.m.
Fig. 6 |
Fig. 6 |. Mutational signatures and HCC emergence from DNA-damaged and senescent progenitors.
a, Mutational signatures based on the trinucleotide frequency of HFrD-induced MUP-uPA Fbp1ΔHep HCCs (1 tumour per run). b, Mutational signatures displayed as described above of NRASG12V-induced Nrf2Act-Hep HCCs. c, DAPI-stained frozen mT/mG liver sections (n = 3) with the indicated treatment were scanned using the Olympus SLIDEVIEW VS200 slide scanner. Scale bars, 20 μm. Subs, substitutions.

References

    1. Maeda S, Kamata H, Luo JL, Leffert H & Karin M IKKbeta couples hepatocyte death to cytokine-driven compensatory proliferation that promotes chemical hepatocarcinogenesis. Cell 121, 977–990 (2005). - PubMed
    1. Younossi ZM & Henry L Epidemiology of non-alcoholic fatty liver disease and hepatocellular carcinoma. JHEP Rep 3, 100305 (2021). - PMC - PubMed
    1. Ferreira-Gonzalez S, Rodrigo-Torres D, Gadd VL & Forbes SJ Cellular senescence in liver disease and regeneration. Semin. Liver Dis 41, 50–66 (2021). - PubMed
    1. Carlessi R et al. Single-nucleus RNA sequencing of pre-malignant liver reveals disease-associated hepatocyte state with HCC prognostic potential. Cell Genom 3, 100301 (2023). - PMC - PubMed
    1. He G et al. Identification of liver cancer progenitors whose malignant progression depends on autocrine IL-6 signaling. Cell 155, 384–396 (2013). - PMC - PubMed

MeSH terms